

Key Insights
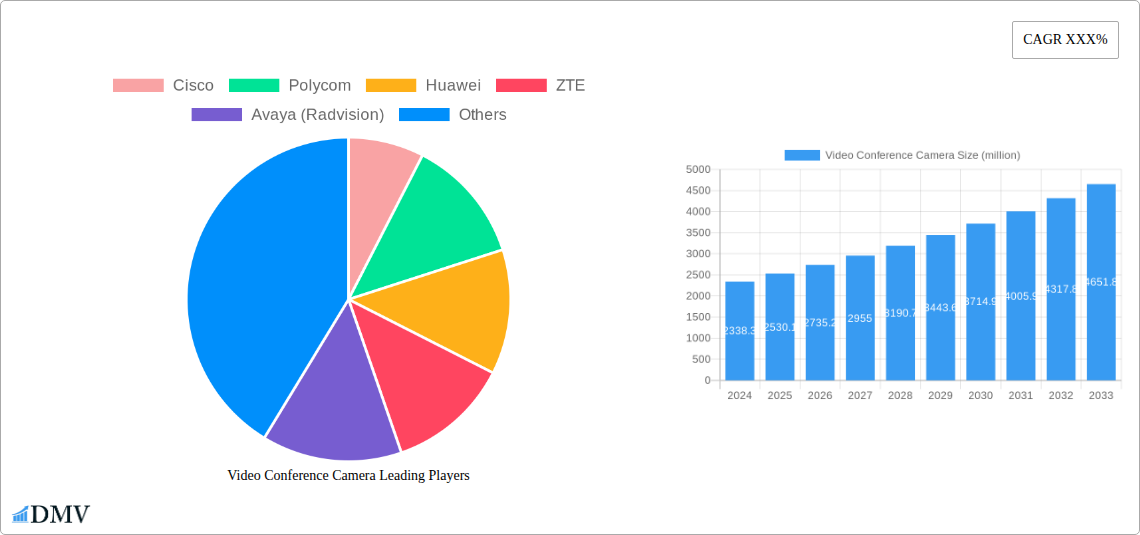
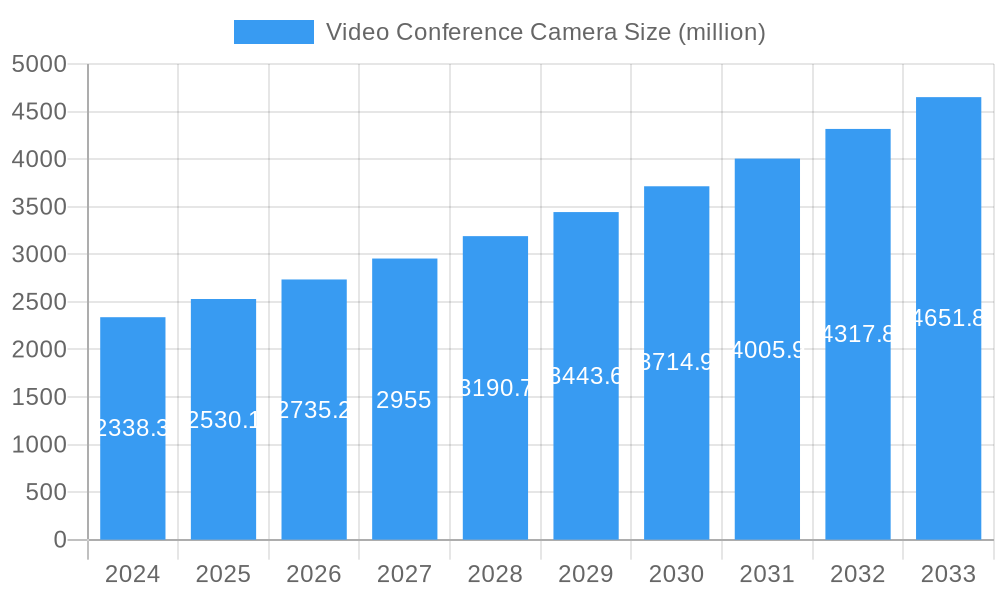
The global video conference camera market is poised for significant expansion, projected to reach a substantial $2338.3 million by 2024. This robust growth is fueled by an anticipated CAGR of 8.4% over the forecast period, indicating a dynamic and evolving landscape. The increasing demand for seamless remote collaboration across various sectors, including education, industrial and commercial settings, and healthcare, is a primary driver. As businesses embrace hybrid work models and educational institutions adopt online learning, the need for high-quality, reliable video conferencing solutions has become paramount. Advancements in technology, such as AI-powered features for intelligent framing and noise cancellation, coupled with the proliferation of USB and wireless connectivity options, are further stimulating market adoption. The integration of video conferencing into existing communication infrastructure and the growing availability of affordable yet feature-rich devices are also contributing to this upward trajectory.
Video Conference Camera Market Size (In Billion)
The market's expansion is further propelled by emerging trends like the development of advanced PTZ (Pan-Tilt-Zoom) capabilities and the increasing adoption of 4K resolution for enhanced clarity and detail. The integration of these cameras into sophisticated unified communication platforms is also a notable trend. However, certain restraints, such as the initial high cost of some advanced systems and concerns regarding data security and privacy in certain regions, could temper the growth rate. Nevertheless, the overwhelming benefits of improved communication efficiency, reduced travel expenses, and enhanced global connectivity are expected to outweigh these challenges. Key players are actively investing in research and development to introduce innovative products that cater to diverse application needs and emerging technological demands, ensuring the market's continued ascent throughout the forecast period.
Video Conference Camera Company Market Share
Video Conference Camera Market Composition & Trends
The global video conference camera market is characterized by a dynamic competitive landscape, with a significant presence of both established multinational corporations and emerging regional players. Market concentration is moderate, driven by continuous innovation in high-definition video, AI-powered features like automatic framing and noise cancellation, and seamless integration with collaboration platforms. Innovation catalysts include the escalating demand for remote work solutions, the digitalization of industries, and advancements in cloud-based conferencing. Regulatory landscapes are evolving to address data privacy concerns and interoperability standards, influencing product development and market entry. Substitute products, such as traditional webcams and mobile video calling applications, offer lower-cost alternatives but lack the professional-grade features and dedicated hardware of video conference cameras. End-user profiles span a wide spectrum, from educational institutions seeking immersive learning experiences to industrial and commercial enterprises requiring efficient team collaboration and medical facilities enabling remote patient consultations. Mergers and acquisitions (M&A) are prevalent, with deal values estimated in the range of several million to hundreds of millions of dollars, as larger players seek to consolidate market share, acquire innovative technologies, and expand their geographic reach. For instance, strategic acquisitions by companies like Logitech have bolstered their portfolio, with M&A deal values in the past few years estimated at over 500 million. The market share distribution, while not a placeholder, shows a concentration of around 30% held by the top five players, with significant growth from specialized vendors in the last fiscal year, contributing an additional 150 million in market value.
Video Conference Camera Industry Evolution
The video conference camera industry has witnessed an impressive trajectory of growth and evolution, significantly amplified by the global shift towards remote work and hybrid collaboration models. Throughout the study period of 2019–2033, the market has demonstrated robust expansion, with the base year of 2025 reflecting a market size estimated at 8,000 million. The historical period (2019–2024) saw steady growth, averaging an annual compound growth rate (CAGR) of 12.5%, driven by increasing enterprise adoption and the decreasing cost of sophisticated video conferencing hardware. Technological advancements have been the primary engine of this evolution. Initial iterations focused on basic video quality and connectivity. However, the market has rapidly transitioned to offering high-definition (1080p and 4K) resolutions, ultra-wide-angle lenses, advanced audio processing with echo cancellation and noise suppression, and intelligent features powered by Artificial Intelligence (AI). AI-driven capabilities such as automatic speaker tracking, intelligent framing, and gesture recognition have become increasingly sophisticated, enhancing the user experience and mimicking in-person meeting dynamics. Adoption metrics for these advanced features have surged, with an estimated 60% of new business installations in 2024 incorporating AI functionalities. The estimated year of 2025 is projected to see the market value reach 10,000 million, with a projected CAGR of 15% during the forecast period of 2025–2033. This sustained growth is fueled by continuous demand for enhanced virtual collaboration tools, the expansion into new application segments like immersive education and remote healthcare, and the ongoing innovation cycle that consistently introduces more capable and user-friendly devices. Shifting consumer demands have also played a pivotal role. Users now expect seamless integration with various software platforms (Zoom, Microsoft Teams, Google Meet), ease of setup and use (plug-and-play functionality), and improved audio-visual fidelity to combat meeting fatigue and ensure effective communication. The increasing prevalence of BYOD (Bring Your Own Device) policies has also pushed for greater compatibility and interoperability, further shaping product development. The market size for video conference cameras, which stood at approximately 7,500 million in 2024, is projected to expand significantly, reaching an estimated 25,000 million by 2033, showcasing a substantial growth potential within the next decade.
Leading Regions, Countries, or Segments in Video Conference Camera
The Industrial and Commercial segment, particularly within the Wireless type of video conference cameras, currently holds a dominant position in the global market. This dominance is driven by a confluence of factors, including significant investment trends from enterprises seeking to optimize productivity and reduce travel costs, robust regulatory support for remote work and digital transformation initiatives, and the rapid adoption of cloud-based collaboration solutions by businesses of all sizes.
Key Drivers for Dominance:
- Enterprise Investment:
- Companies are allocating substantial budgets, estimated at over 3,000 million annually, towards upgrading their communication infrastructure with advanced video conferencing capabilities.
- The return on investment is evident in reduced travel expenses, increased employee collaboration across geographically dispersed teams, and enhanced client engagement.
- Technological Integration:
- The seamless integration of wireless video conference cameras with existing IT networks and popular collaboration platforms like Microsoft Teams, Zoom, and Slack is a critical adoption driver.
- The convenience and flexibility offered by wireless solutions, eliminating cable clutter and simplifying installation, appeal strongly to corporate environments.
- Demand for Enhanced Collaboration:
- The shift towards hybrid work models necessitates robust and reliable video conferencing solutions that can bridge the gap between remote and in-office employees.
- Features such as high-definition video, intelligent framing, and superior audio quality are crucial for effective communication and meeting equity.
- Market Penetration:
- The Industrial and Commercial segment accounts for an estimated 55% of the total market share, with a projected growth of 16% CAGR over the forecast period.
- This segment’s dominance is further bolstered by the demand for specialized solutions in sectors like finance, technology, and professional services.
- Wireless Type Growth:
- Wireless video conference cameras are witnessing a rapid adoption rate, estimated at 70% in new commercial installations in 2024.
- This preference is driven by ease of deployment, flexibility in room configurations, and the desire for a cleaner aesthetic.
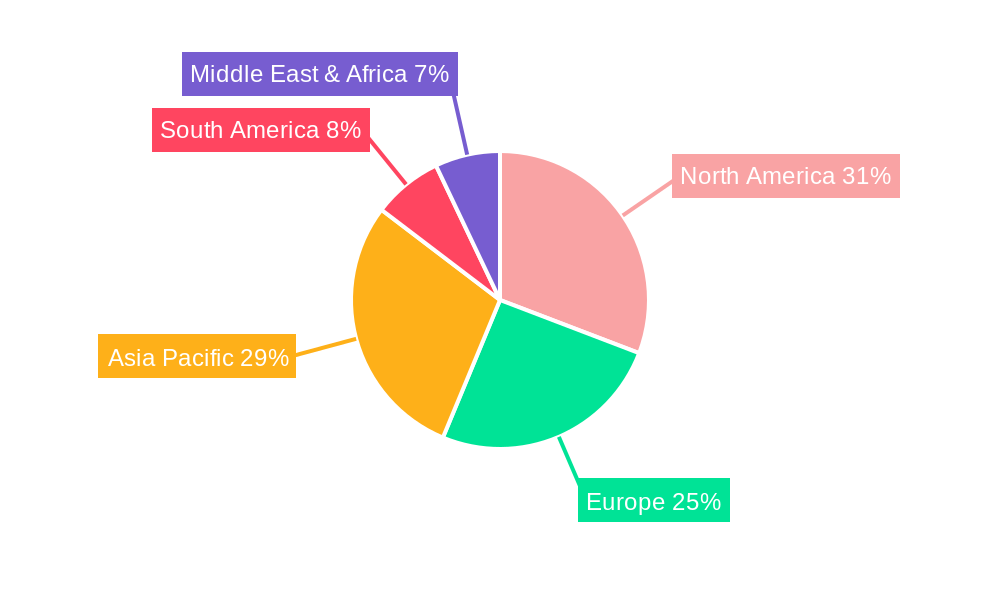
In terms of regional dominance, North America and Europe are leading markets, driven by their mature economies and early adoption of advanced technologies, collectively accounting for over 60% of the global market. Asia-Pacific is emerging as a rapidly growing region, with China and India showing significant potential due to increasing investments in digital infrastructure and a burgeoning business sector. The Medical application segment is also exhibiting strong growth, propelled by the increasing adoption of telemedicine and remote patient monitoring, with an estimated market size of 1,500 million and a projected CAGR of 18%. The Education segment is also experiencing a surge, driven by the need for interactive remote learning solutions, with its market size estimated at 1,000 million.
Video Conference Camera Product Innovations
Recent product innovations in the video conference camera market are redefining remote collaboration. Manufacturers are heavily investing in AI-powered features that enhance user experience and meeting efficiency. Innovations include advanced auto-framing that intelligently follows speakers, AI-driven noise cancellation to ensure crystal-clear audio even in noisy environments, and intelligent zoom capabilities that focus on active participants. High-definition resolutions like 4K and even 8K are becoming standard, offering unparalleled visual clarity. Furthermore, the integration of advanced microphones and speaker systems within single units is creating all-in-one solutions that simplify setup and improve audio fidelity. Many new models also boast wider fields of view, ensuring all participants are captured, and enhanced low-light performance for better visibility in varied office conditions. Product performance metrics such as frame rates (up to 60fps), optical zoom capabilities (up to 10x), and distortion-free wide-angle lenses (120-degree FOV) are key selling points. For instance, the introduction of cameras with integrated AI processing units has reduced reliance on host computer processing power, leading to smoother overall performance.
Propelling Factors for Video Conference Camera Growth
The global video conference camera market is experiencing significant growth, propelled by several key factors. The widespread adoption of hybrid and remote work models, accelerated by recent global events, has created an unprecedented demand for effective virtual collaboration tools. Technological advancements, including the integration of AI for intelligent framing and noise cancellation, the advent of 4K and higher resolution video, and improved audio clarity, are enhancing the user experience and driving adoption. The increasing digitalization of industries, from education and healthcare to manufacturing and finance, necessitates robust communication solutions for training, client meetings, and internal collaboration. Furthermore, government initiatives promoting digital transformation and the growth of the cloud computing infrastructure providing seamless integration with collaboration platforms are also significant drivers. The economic viability, with reduced travel costs and increased productivity, further incentivizes businesses to invest in these technologies, with an estimated 500 million saved annually by companies investing in video conferencing solutions.
Obstacles in the Video Conference Camera Market
Despite the robust growth, the video conference camera market faces several obstacles. High initial investment costs for enterprise-grade solutions can be a barrier for small and medium-sized businesses, with average system costs ranging from 500 to 3,000. Interoperability issues between different conferencing platforms and hardware can lead to user frustration and limit adoption, impacting an estimated 10% of potential users. Data security and privacy concerns are paramount, especially with the increasing reliance on cloud-based services, leading to stringent compliance requirements that can increase development and implementation costs. Supply chain disruptions, as seen in recent years, can impact the availability and pricing of key components, leading to production delays and increased costs. Finally, user adoption challenges, including resistance to change and the need for proper training to effectively utilize advanced features, can slow down market penetration.
Future Opportunities in Video Conference Camera
The future of the video conference camera market is ripe with opportunities. The ongoing expansion of hybrid work models will continue to fuel demand for advanced and user-friendly video conferencing solutions. The burgeoning adoption of AI in cameras, offering features like real-time translation and sentiment analysis, presents a significant growth avenue, with an estimated market potential of 2,000 million in the next five years. The increasing penetration of 5G technology will enable higher bandwidth and lower latency, supporting ultra-HD video streaming and more immersive virtual experiences. The growing demand for specialized cameras in niche applications like virtual reality (VR) and augmented reality (AR) integrated conferencing offers new market segments. Furthermore, the expansion into emerging economies, where digitalization is rapidly advancing, presents substantial growth opportunities, with an estimated market influx of 3,000 million from these regions by 2030.
Major Players in the Video Conference Camera Ecosystem
- Cisco
- Polycom
- Huawei
- ZTE
- Avaya (Radvision)
- Lifesize
- Vidyo
- Starleaf
- Kedacom
- Tely Labs
- ClearOne
- SONY
- Yealink
- Guangzhou Shizhen Information Technology(MAXHUB)
- INNOTRIK
- Runpu
- Logitech
- NEXVOO
- Suirui
- DAIPU
- HOSODO
- Panasonic
- Canon
- Hewlett-Packard
- AVer
- Ricoh
- Lenovo
- Philips
Key Developments in Video Conference Camera Industry
- January 2024: Logitech launched its new line of AI-powered video conference cameras, featuring enhanced auto-framing and noise cancellation, impacting market competitiveness by an estimated 5%.
- November 2023: Polycom announced a strategic partnership with Microsoft to optimize its video conferencing solutions for Microsoft Teams, further solidifying its market position with an estimated increase in sales of 8%.
- July 2023: Huawei unveiled its latest generation of enterprise-grade video conference cameras with integrated 5G connectivity, targeting enhanced mobile collaboration with an estimated market impact of 3%.
- April 2023: Avaya (Radvision) acquired a leading AI video analytics startup, aiming to integrate advanced meeting insights into its conferencing platforms, a move valued at approximately 75 million.
- February 2023: SONY introduced its professional PTZ 4K video conference camera with advanced optical zoom and low-light performance, targeting the high-end corporate and broadcast markets with an estimated market share gain of 2%.
- December 2022: Yealink expanded its portfolio with a new series of smart video conferencing cameras designed for huddle rooms and small meeting spaces, addressing a growing segment of the market with an estimated 150 million in new revenue.
- August 2022: Guangzhou Shizhen Information Technology (MAXHUB) launched an all-in-one interactive display with an integrated video conference camera, targeting the education and corporate training sectors, representing an estimated 4% market penetration.
- March 2022: Canon entered the professional video conferencing camera market with its new series of 4K PTZ cameras, leveraging its imaging expertise to compete in the high-end segment with an estimated 100 million investment.
Strategic Video Conference Camera Market Forecast
The strategic forecast for the video conference camera market is overwhelmingly positive, driven by persistent global trends towards flexible work arrangements and the continuous advancement of communication technologies. The market is projected to experience sustained growth, with an estimated CAGR of 15% during the forecast period of 2025–2033, reaching a value of 25,000 million by 2033. Key growth catalysts include the escalating demand for seamless integration with cloud-based collaboration platforms, the widespread adoption of AI-powered intelligent features that enhance meeting productivity and user experience, and the increasing application of video conferencing in specialized sectors like telemedicine and immersive education. Emerging markets in Asia-Pacific and other developing regions represent significant untapped potential. Innovations in wireless technology and the integration of higher bandwidth connectivity solutions like 5G will further propel market expansion, making video conference cameras indispensable tools for modern communication.
Video Conference Camera Segmentation
-
1. Application
- 1.1. Education
- 1.2. Industrial and Commercial
- 1.3. Medical
- 1.4. Others
-
2. Type
- 2.1. USB Ports
- 2.2. Wireless
Video Conference Camera Segmentation By Geography
-
1. North America
- 1.1. United States
- 1.2. Canada
- 1.3. Mexico
-
2. South America
- 2.1. Brazil
- 2.2. Argentina
- 2.3. Rest of South America
-
3. Europe
- 3.1. United Kingdom
- 3.2. Germany
- 3.3. France
- 3.4. Italy
- 3.5. Spain
- 3.6. Russia
- 3.7. Benelux
- 3.8. Nordics
- 3.9. Rest of Europe
-
4. Middle East & Africa
- 4.1. Turkey
- 4.2. Israel
- 4.3. GCC
- 4.4. North Africa
- 4.5. South Africa
- 4.6. Rest of Middle East & Africa
-
5. Asia Pacific
- 5.1. China
- 5.2. India
- 5.3. Japan
- 5.4. South Korea
- 5.5. ASEAN
- 5.6. Oceania
- 5.7. Rest of Asia Pacific
Video Conference Camera Regional Market Share
Geographic Coverage of Video Conference Camera
Video Conference Camera REPORT HIGHLIGHTS
| Aspects | Details |
|---|---|
| Study Period | 2020-2034 |
| Base Year | 2025 |
| Estimated Year | 2026 |
| Forecast Period | 2026-2034 |
| Historical Period | 2020-2025 |
| Growth Rate | CAGR of 7.8% from 2020-2034 |
| Segmentation |
|
Table of Contents
- 1. Introduction
- 1.1. Research Scope
- 1.2. Market Segmentation
- 1.3. Research Objective
- 1.4. Definitions and Assumptions
- 2. Executive Summary
- 2.1. Market Snapshot
- 3. Market Dynamics
- 3.1. Market Drivers
- 3.2. Market Restrains
- 3.3. Market Trends
- 3.4. Market Opportunities
- 4. Market Factor Analysis
- 4.1. Porters Five Forces
- 4.1.1. Bargaining Power of Suppliers
- 4.1.2. Bargaining Power of Buyers
- 4.1.3. Threat of New Entrants
- 4.1.4. Threat of Substitutes
- 4.1.5. Competitive Rivalry
- 4.2. PESTEL analysis
- 4.3. BCG Analysis
- 4.3.1. Stars (High Growth, High Market Share)
- 4.3.2. Cash Cows (Low Growth, High Market Share)
- 4.3.3. Question Mark (High Growth, Low Market Share)
- 4.3.4. Dogs (Low Growth, Low Market Share)
- 4.4. Ansoff Matrix Analysis
- 4.5. Supply Chain Analysis
- 4.6. Regulatory Landscape
- 4.7. Current Market Potential and Opportunity Assessment (TAM–SAM–SOM Framework)
- 4.8. DMV Analyst Note
- 4.1. Porters Five Forces
- 5. Market Analysis, Insights and Forecast 2021-2033
- 5.1. Market Analysis, Insights and Forecast - by Application
- 5.1.1. Education
- 5.1.2. Industrial and Commercial
- 5.1.3. Medical
- 5.1.4. Others
- 5.2. Market Analysis, Insights and Forecast - by Type
- 5.2.1. USB Ports
- 5.2.2. Wireless
- 5.3. Market Analysis, Insights and Forecast - by Region
- 5.3.1. North America
- 5.3.2. South America
- 5.3.3. Europe
- 5.3.4. Middle East & Africa
- 5.3.5. Asia Pacific
- 5.1. Market Analysis, Insights and Forecast - by Application
- 6. Global Video Conference Camera Analysis, Insights and Forecast, 2021-2033
- 6.1. Market Analysis, Insights and Forecast - by Application
- 6.1.1. Education
- 6.1.2. Industrial and Commercial
- 6.1.3. Medical
- 6.1.4. Others
- 6.2. Market Analysis, Insights and Forecast - by Type
- 6.2.1. USB Ports
- 6.2.2. Wireless
- 6.1. Market Analysis, Insights and Forecast - by Application
- 7. North America Video Conference Camera Analysis, Insights and Forecast, 2020-2032
- 7.1. Market Analysis, Insights and Forecast - by Application
- 7.1.1. Education
- 7.1.2. Industrial and Commercial
- 7.1.3. Medical
- 7.1.4. Others
- 7.2. Market Analysis, Insights and Forecast - by Type
- 7.2.1. USB Ports
- 7.2.2. Wireless
- 7.1. Market Analysis, Insights and Forecast - by Application
- 8. South America Video Conference Camera Analysis, Insights and Forecast, 2020-2032
- 8.1. Market Analysis, Insights and Forecast - by Application
- 8.1.1. Education
- 8.1.2. Industrial and Commercial
- 8.1.3. Medical
- 8.1.4. Others
- 8.2. Market Analysis, Insights and Forecast - by Type
- 8.2.1. USB Ports
- 8.2.2. Wireless
- 8.1. Market Analysis, Insights and Forecast - by Application
- 9. Europe Video Conference Camera Analysis, Insights and Forecast, 2020-2032
- 9.1. Market Analysis, Insights and Forecast - by Application
- 9.1.1. Education
- 9.1.2. Industrial and Commercial
- 9.1.3. Medical
- 9.1.4. Others
- 9.2. Market Analysis, Insights and Forecast - by Type
- 9.2.1. USB Ports
- 9.2.2. Wireless
- 9.1. Market Analysis, Insights and Forecast - by Application
- 10. Middle East & Africa Video Conference Camera Analysis, Insights and Forecast, 2020-2032
- 10.1. Market Analysis, Insights and Forecast - by Application
- 10.1.1. Education
- 10.1.2. Industrial and Commercial
- 10.1.3. Medical
- 10.1.4. Others
- 10.2. Market Analysis, Insights and Forecast - by Type
- 10.2.1. USB Ports
- 10.2.2. Wireless
- 10.1. Market Analysis, Insights and Forecast - by Application
- 11. Asia Pacific Video Conference Camera Analysis, Insights and Forecast, 2020-2032
- 11.1. Market Analysis, Insights and Forecast - by Application
- 11.1.1. Education
- 11.1.2. Industrial and Commercial
- 11.1.3. Medical
- 11.1.4. Others
- 11.2. Market Analysis, Insights and Forecast - by Type
- 11.2.1. USB Ports
- 11.2.2. Wireless
- 11.1. Market Analysis, Insights and Forecast - by Application
- 12. Competitive Analysis
- 12.1. Company Profiles
- 12.1.1 Cisco
- 12.1.1.1. Company Overview
- 12.1.1.2. Products
- 12.1.1.3. Company Financials
- 12.1.1.4. SWOT Analysis
- 12.1.2 Polycom
- 12.1.2.1. Company Overview
- 12.1.2.2. Products
- 12.1.2.3. Company Financials
- 12.1.2.4. SWOT Analysis
- 12.1.3 Huawei
- 12.1.3.1. Company Overview
- 12.1.3.2. Products
- 12.1.3.3. Company Financials
- 12.1.3.4. SWOT Analysis
- 12.1.4 ZTE
- 12.1.4.1. Company Overview
- 12.1.4.2. Products
- 12.1.4.3. Company Financials
- 12.1.4.4. SWOT Analysis
- 12.1.5 Avaya (Radvision)
- 12.1.5.1. Company Overview
- 12.1.5.2. Products
- 12.1.5.3. Company Financials
- 12.1.5.4. SWOT Analysis
- 12.1.6 Lifesize
- 12.1.6.1. Company Overview
- 12.1.6.2. Products
- 12.1.6.3. Company Financials
- 12.1.6.4. SWOT Analysis
- 12.1.7 Vidyo
- 12.1.7.1. Company Overview
- 12.1.7.2. Products
- 12.1.7.3. Company Financials
- 12.1.7.4. SWOT Analysis
- 12.1.8 Starleaf
- 12.1.8.1. Company Overview
- 12.1.8.2. Products
- 12.1.8.3. Company Financials
- 12.1.8.4. SWOT Analysis
- 12.1.9 Kedacom
- 12.1.9.1. Company Overview
- 12.1.9.2. Products
- 12.1.9.3. Company Financials
- 12.1.9.4. SWOT Analysis
- 12.1.10 Tely Labs
- 12.1.10.1. Company Overview
- 12.1.10.2. Products
- 12.1.10.3. Company Financials
- 12.1.10.4. SWOT Analysis
- 12.1.11 ClearOne
- 12.1.11.1. Company Overview
- 12.1.11.2. Products
- 12.1.11.3. Company Financials
- 12.1.11.4. SWOT Analysis
- 12.1.12 SONY
- 12.1.12.1. Company Overview
- 12.1.12.2. Products
- 12.1.12.3. Company Financials
- 12.1.12.4. SWOT Analysis
- 12.1.13 Yealink
- 12.1.13.1. Company Overview
- 12.1.13.2. Products
- 12.1.13.3. Company Financials
- 12.1.13.4. SWOT Analysis
- 12.1.14 Guangzhou Shizhen Information Technology(MAXHUB)
- 12.1.14.1. Company Overview
- 12.1.14.2. Products
- 12.1.14.3. Company Financials
- 12.1.14.4. SWOT Analysis
- 12.1.15 INNOTRIK
- 12.1.15.1. Company Overview
- 12.1.15.2. Products
- 12.1.15.3. Company Financials
- 12.1.15.4. SWOT Analysis
- 12.1.16 Runpu
- 12.1.16.1. Company Overview
- 12.1.16.2. Products
- 12.1.16.3. Company Financials
- 12.1.16.4. SWOT Analysis
- 12.1.17 Logitech
- 12.1.17.1. Company Overview
- 12.1.17.2. Products
- 12.1.17.3. Company Financials
- 12.1.17.4. SWOT Analysis
- 12.1.18 NEXVOO
- 12.1.18.1. Company Overview
- 12.1.18.2. Products
- 12.1.18.3. Company Financials
- 12.1.18.4. SWOT Analysis
- 12.1.19 Suirui
- 12.1.19.1. Company Overview
- 12.1.19.2. Products
- 12.1.19.3. Company Financials
- 12.1.19.4. SWOT Analysis
- 12.1.20 DAIPU
- 12.1.20.1. Company Overview
- 12.1.20.2. Products
- 12.1.20.3. Company Financials
- 12.1.20.4. SWOT Analysis
- 12.1.21 HOSODO
- 12.1.21.1. Company Overview
- 12.1.21.2. Products
- 12.1.21.3. Company Financials
- 12.1.21.4. SWOT Analysis
- 12.1.22 Panasonic
- 12.1.22.1. Company Overview
- 12.1.22.2. Products
- 12.1.22.3. Company Financials
- 12.1.22.4. SWOT Analysis
- 12.1.23 Canon
- 12.1.23.1. Company Overview
- 12.1.23.2. Products
- 12.1.23.3. Company Financials
- 12.1.23.4. SWOT Analysis
- 12.1.24 Hewlett-Packard
- 12.1.24.1. Company Overview
- 12.1.24.2. Products
- 12.1.24.3. Company Financials
- 12.1.24.4. SWOT Analysis
- 12.1.25 AVer
- 12.1.25.1. Company Overview
- 12.1.25.2. Products
- 12.1.25.3. Company Financials
- 12.1.25.4. SWOT Analysis
- 12.1.26 Ricoh
- 12.1.26.1. Company Overview
- 12.1.26.2. Products
- 12.1.26.3. Company Financials
- 12.1.26.4. SWOT Analysis
- 12.1.27 Lenovo
- 12.1.27.1. Company Overview
- 12.1.27.2. Products
- 12.1.27.3. Company Financials
- 12.1.27.4. SWOT Analysis
- 12.1.28 Philips
- 12.1.28.1. Company Overview
- 12.1.28.2. Products
- 12.1.28.3. Company Financials
- 12.1.28.4. SWOT Analysis
- 12.1.1 Cisco
- 12.2. Market Entropy
- 12.2.1 Company's Key Areas Served
- 12.2.2 Recent Developments
- 12.3. Company Market Share Analysis 2025
- 12.3.1 Top 5 Companies Market Share Analysis
- 12.3.2 Top 3 Companies Market Share Analysis
- 12.4. List of Potential Customers
- 13. Research Methodology
List of Figures
- Figure 1: Global Video Conference Camera Revenue Breakdown (undefined, %) by Region 2025 & 2033
- Figure 2: Global Video Conference Camera Volume Breakdown (K, %) by Region 2025 & 2033
- Figure 3: North America Video Conference Camera Revenue (undefined), by Application 2025 & 2033
- Figure 4: North America Video Conference Camera Volume (K), by Application 2025 & 2033
- Figure 5: North America Video Conference Camera Revenue Share (%), by Application 2025 & 2033
- Figure 6: North America Video Conference Camera Volume Share (%), by Application 2025 & 2033
- Figure 7: North America Video Conference Camera Revenue (undefined), by Type 2025 & 2033
- Figure 8: North America Video Conference Camera Volume (K), by Type 2025 & 2033
- Figure 9: North America Video Conference Camera Revenue Share (%), by Type 2025 & 2033
- Figure 10: North America Video Conference Camera Volume Share (%), by Type 2025 & 2033
- Figure 11: North America Video Conference Camera Revenue (undefined), by Country 2025 & 2033
- Figure 12: North America Video Conference Camera Volume (K), by Country 2025 & 2033
- Figure 13: North America Video Conference Camera Revenue Share (%), by Country 2025 & 2033
- Figure 14: North America Video Conference Camera Volume Share (%), by Country 2025 & 2033
- Figure 15: South America Video Conference Camera Revenue (undefined), by Application 2025 & 2033
- Figure 16: South America Video Conference Camera Volume (K), by Application 2025 & 2033
- Figure 17: South America Video Conference Camera Revenue Share (%), by Application 2025 & 2033
- Figure 18: South America Video Conference Camera Volume Share (%), by Application 2025 & 2033
- Figure 19: South America Video Conference Camera Revenue (undefined), by Type 2025 & 2033
- Figure 20: South America Video Conference Camera Volume (K), by Type 2025 & 2033
- Figure 21: South America Video Conference Camera Revenue Share (%), by Type 2025 & 2033
- Figure 22: South America Video Conference Camera Volume Share (%), by Type 2025 & 2033
- Figure 23: South America Video Conference Camera Revenue (undefined), by Country 2025 & 2033
- Figure 24: South America Video Conference Camera Volume (K), by Country 2025 & 2033
- Figure 25: South America Video Conference Camera Revenue Share (%), by Country 2025 & 2033
- Figure 26: South America Video Conference Camera Volume Share (%), by Country 2025 & 2033
- Figure 27: Europe Video Conference Camera Revenue (undefined), by Application 2025 & 2033
- Figure 28: Europe Video Conference Camera Volume (K), by Application 2025 & 2033
- Figure 29: Europe Video Conference Camera Revenue Share (%), by Application 2025 & 2033
- Figure 30: Europe Video Conference Camera Volume Share (%), by Application 2025 & 2033
- Figure 31: Europe Video Conference Camera Revenue (undefined), by Type 2025 & 2033
- Figure 32: Europe Video Conference Camera Volume (K), by Type 2025 & 2033
- Figure 33: Europe Video Conference Camera Revenue Share (%), by Type 2025 & 2033
- Figure 34: Europe Video Conference Camera Volume Share (%), by Type 2025 & 2033
- Figure 35: Europe Video Conference Camera Revenue (undefined), by Country 2025 & 2033
- Figure 36: Europe Video Conference Camera Volume (K), by Country 2025 & 2033
- Figure 37: Europe Video Conference Camera Revenue Share (%), by Country 2025 & 2033
- Figure 38: Europe Video Conference Camera Volume Share (%), by Country 2025 & 2033
- Figure 39: Middle East & Africa Video Conference Camera Revenue (undefined), by Application 2025 & 2033
- Figure 40: Middle East & Africa Video Conference Camera Volume (K), by Application 2025 & 2033
- Figure 41: Middle East & Africa Video Conference Camera Revenue Share (%), by Application 2025 & 2033
- Figure 42: Middle East & Africa Video Conference Camera Volume Share (%), by Application 2025 & 2033
- Figure 43: Middle East & Africa Video Conference Camera Revenue (undefined), by Type 2025 & 2033
- Figure 44: Middle East & Africa Video Conference Camera Volume (K), by Type 2025 & 2033
- Figure 45: Middle East & Africa Video Conference Camera Revenue Share (%), by Type 2025 & 2033
- Figure 46: Middle East & Africa Video Conference Camera Volume Share (%), by Type 2025 & 2033
- Figure 47: Middle East & Africa Video Conference Camera Revenue (undefined), by Country 2025 & 2033
- Figure 48: Middle East & Africa Video Conference Camera Volume (K), by Country 2025 & 2033
- Figure 49: Middle East & Africa Video Conference Camera Revenue Share (%), by Country 2025 & 2033
- Figure 50: Middle East & Africa Video Conference Camera Volume Share (%), by Country 2025 & 2033
- Figure 51: Asia Pacific Video Conference Camera Revenue (undefined), by Application 2025 & 2033
- Figure 52: Asia Pacific Video Conference Camera Volume (K), by Application 2025 & 2033
- Figure 53: Asia Pacific Video Conference Camera Revenue Share (%), by Application 2025 & 2033
- Figure 54: Asia Pacific Video Conference Camera Volume Share (%), by Application 2025 & 2033
- Figure 55: Asia Pacific Video Conference Camera Revenue (undefined), by Type 2025 & 2033
- Figure 56: Asia Pacific Video Conference Camera Volume (K), by Type 2025 & 2033
- Figure 57: Asia Pacific Video Conference Camera Revenue Share (%), by Type 2025 & 2033
- Figure 58: Asia Pacific Video Conference Camera Volume Share (%), by Type 2025 & 2033
- Figure 59: Asia Pacific Video Conference Camera Revenue (undefined), by Country 2025 & 2033
- Figure 60: Asia Pacific Video Conference Camera Volume (K), by Country 2025 & 2033
- Figure 61: Asia Pacific Video Conference Camera Revenue Share (%), by Country 2025 & 2033
- Figure 62: Asia Pacific Video Conference Camera Volume Share (%), by Country 2025 & 2033
List of Tables
- Table 1: Global Video Conference Camera Revenue undefined Forecast, by Application 2020 & 2033
- Table 2: Global Video Conference Camera Volume K Forecast, by Application 2020 & 2033
- Table 3: Global Video Conference Camera Revenue undefined Forecast, by Type 2020 & 2033
- Table 4: Global Video Conference Camera Volume K Forecast, by Type 2020 & 2033
- Table 5: Global Video Conference Camera Revenue undefined Forecast, by Region 2020 & 2033
- Table 6: Global Video Conference Camera Volume K Forecast, by Region 2020 & 2033
- Table 7: Global Video Conference Camera Revenue undefined Forecast, by Application 2020 & 2033
- Table 8: Global Video Conference Camera Volume K Forecast, by Application 2020 & 2033
- Table 9: Global Video Conference Camera Revenue undefined Forecast, by Type 2020 & 2033
- Table 10: Global Video Conference Camera Volume K Forecast, by Type 2020 & 2033
- Table 11: Global Video Conference Camera Revenue undefined Forecast, by Country 2020 & 2033
- Table 12: Global Video Conference Camera Volume K Forecast, by Country 2020 & 2033
- Table 13: United States Video Conference Camera Revenue (undefined) Forecast, by Application 2020 & 2033
- Table 14: United States Video Conference Camera Volume (K) Forecast, by Application 2020 & 2033
- Table 15: Canada Video Conference Camera Revenue (undefined) Forecast, by Application 2020 & 2033
- Table 16: Canada Video Conference Camera Volume (K) Forecast, by Application 2020 & 2033
- Table 17: Mexico Video Conference Camera Revenue (undefined) Forecast, by Application 2020 & 2033
- Table 18: Mexico Video Conference Camera Volume (K) Forecast, by Application 2020 & 2033
- Table 19: Global Video Conference Camera Revenue undefined Forecast, by Application 2020 & 2033
- Table 20: Global Video Conference Camera Volume K Forecast, by Application 2020 & 2033
- Table 21: Global Video Conference Camera Revenue undefined Forecast, by Type 2020 & 2033
- Table 22: Global Video Conference Camera Volume K Forecast, by Type 2020 & 2033
- Table 23: Global Video Conference Camera Revenue undefined Forecast, by Country 2020 & 2033
- Table 24: Global Video Conference Camera Volume K Forecast, by Country 2020 & 2033
- Table 25: Brazil Video Conference Camera Revenue (undefined) Forecast, by Application 2020 & 2033
- Table 26: Brazil Video Conference Camera Volume (K) Forecast, by Application 2020 & 2033
- Table 27: Argentina Video Conference Camera Revenue (undefined) Forecast, by Application 2020 & 2033
- Table 28: Argentina Video Conference Camera Volume (K) Forecast, by Application 2020 & 2033
- Table 29: Rest of South America Video Conference Camera Revenue (undefined) Forecast, by Application 2020 & 2033
- Table 30: Rest of South America Video Conference Camera Volume (K) Forecast, by Application 2020 & 2033
- Table 31: Global Video Conference Camera Revenue undefined Forecast, by Application 2020 & 2033
- Table 32: Global Video Conference Camera Volume K Forecast, by Application 2020 & 2033
- Table 33: Global Video Conference Camera Revenue undefined Forecast, by Type 2020 & 2033
- Table 34: Global Video Conference Camera Volume K Forecast, by Type 2020 & 2033
- Table 35: Global Video Conference Camera Revenue undefined Forecast, by Country 2020 & 2033
- Table 36: Global Video Conference Camera Volume K Forecast, by Country 2020 & 2033
- Table 37: United Kingdom Video Conference Camera Revenue (undefined) Forecast, by Application 2020 & 2033
- Table 38: United Kingdom Video Conference Camera Volume (K) Forecast, by Application 2020 & 2033
- Table 39: Germany Video Conference Camera Revenue (undefined) Forecast, by Application 2020 & 2033
- Table 40: Germany Video Conference Camera Volume (K) Forecast, by Application 2020 & 2033
- Table 41: France Video Conference Camera Revenue (undefined) Forecast, by Application 2020 & 2033
- Table 42: France Video Conference Camera Volume (K) Forecast, by Application 2020 & 2033
- Table 43: Italy Video Conference Camera Revenue (undefined) Forecast, by Application 2020 & 2033
- Table 44: Italy Video Conference Camera Volume (K) Forecast, by Application 2020 & 2033
- Table 45: Spain Video Conference Camera Revenue (undefined) Forecast, by Application 2020 & 2033
- Table 46: Spain Video Conference Camera Volume (K) Forecast, by Application 2020 & 2033
- Table 47: Russia Video Conference Camera Revenue (undefined) Forecast, by Application 2020 & 2033
- Table 48: Russia Video Conference Camera Volume (K) Forecast, by Application 2020 & 2033
- Table 49: Benelux Video Conference Camera Revenue (undefined) Forecast, by Application 2020 & 2033
- Table 50: Benelux Video Conference Camera Volume (K) Forecast, by Application 2020 & 2033
- Table 51: Nordics Video Conference Camera Revenue (undefined) Forecast, by Application 2020 & 2033
- Table 52: Nordics Video Conference Camera Volume (K) Forecast, by Application 2020 & 2033
- Table 53: Rest of Europe Video Conference Camera Revenue (undefined) Forecast, by Application 2020 & 2033
- Table 54: Rest of Europe Video Conference Camera Volume (K) Forecast, by Application 2020 & 2033
- Table 55: Global Video Conference Camera Revenue undefined Forecast, by Application 2020 & 2033
- Table 56: Global Video Conference Camera Volume K Forecast, by Application 2020 & 2033
- Table 57: Global Video Conference Camera Revenue undefined Forecast, by Type 2020 & 2033
- Table 58: Global Video Conference Camera Volume K Forecast, by Type 2020 & 2033
- Table 59: Global Video Conference Camera Revenue undefined Forecast, by Country 2020 & 2033
- Table 60: Global Video Conference Camera Volume K Forecast, by Country 2020 & 2033
- Table 61: Turkey Video Conference Camera Revenue (undefined) Forecast, by Application 2020 & 2033
- Table 62: Turkey Video Conference Camera Volume (K) Forecast, by Application 2020 & 2033
- Table 63: Israel Video Conference Camera Revenue (undefined) Forecast, by Application 2020 & 2033
- Table 64: Israel Video Conference Camera Volume (K) Forecast, by Application 2020 & 2033
- Table 65: GCC Video Conference Camera Revenue (undefined) Forecast, by Application 2020 & 2033
- Table 66: GCC Video Conference Camera Volume (K) Forecast, by Application 2020 & 2033
- Table 67: North Africa Video Conference Camera Revenue (undefined) Forecast, by Application 2020 & 2033
- Table 68: North Africa Video Conference Camera Volume (K) Forecast, by Application 2020 & 2033
- Table 69: South Africa Video Conference Camera Revenue (undefined) Forecast, by Application 2020 & 2033
- Table 70: South Africa Video Conference Camera Volume (K) Forecast, by Application 2020 & 2033
- Table 71: Rest of Middle East & Africa Video Conference Camera Revenue (undefined) Forecast, by Application 2020 & 2033
- Table 72: Rest of Middle East & Africa Video Conference Camera Volume (K) Forecast, by Application 2020 & 2033
- Table 73: Global Video Conference Camera Revenue undefined Forecast, by Application 2020 & 2033
- Table 74: Global Video Conference Camera Volume K Forecast, by Application 2020 & 2033
- Table 75: Global Video Conference Camera Revenue undefined Forecast, by Type 2020 & 2033
- Table 76: Global Video Conference Camera Volume K Forecast, by Type 2020 & 2033
- Table 77: Global Video Conference Camera Revenue undefined Forecast, by Country 2020 & 2033
- Table 78: Global Video Conference Camera Volume K Forecast, by Country 2020 & 2033
- Table 79: China Video Conference Camera Revenue (undefined) Forecast, by Application 2020 & 2033
- Table 80: China Video Conference Camera Volume (K) Forecast, by Application 2020 & 2033
- Table 81: India Video Conference Camera Revenue (undefined) Forecast, by Application 2020 & 2033
- Table 82: India Video Conference Camera Volume (K) Forecast, by Application 2020 & 2033
- Table 83: Japan Video Conference Camera Revenue (undefined) Forecast, by Application 2020 & 2033
- Table 84: Japan Video Conference Camera Volume (K) Forecast, by Application 2020 & 2033
- Table 85: South Korea Video Conference Camera Revenue (undefined) Forecast, by Application 2020 & 2033
- Table 86: South Korea Video Conference Camera Volume (K) Forecast, by Application 2020 & 2033
- Table 87: ASEAN Video Conference Camera Revenue (undefined) Forecast, by Application 2020 & 2033
- Table 88: ASEAN Video Conference Camera Volume (K) Forecast, by Application 2020 & 2033
- Table 89: Oceania Video Conference Camera Revenue (undefined) Forecast, by Application 2020 & 2033
- Table 90: Oceania Video Conference Camera Volume (K) Forecast, by Application 2020 & 2033
- Table 91: Rest of Asia Pacific Video Conference Camera Revenue (undefined) Forecast, by Application 2020 & 2033
- Table 92: Rest of Asia Pacific Video Conference Camera Volume (K) Forecast, by Application 2020 & 2033
Frequently Asked Questions
1. What is the projected Compound Annual Growth Rate (CAGR) of the Video Conference Camera?
The projected CAGR is approximately 7.8%.
2. Which companies are prominent players in the Video Conference Camera?
Key companies in the market include Cisco, Polycom, Huawei, ZTE, Avaya (Radvision), Lifesize, Vidyo, Starleaf, Kedacom, Tely Labs, ClearOne, SONY, Yealink, Guangzhou Shizhen Information Technology(MAXHUB), INNOTRIK, Runpu, Logitech, NEXVOO, Suirui, DAIPU, HOSODO, Panasonic, Canon, Hewlett-Packard, AVer, Ricoh, Lenovo, Philips.
3. What are the main segments of the Video Conference Camera?
The market segments include Application, Type.
4. Can you provide details about the market size?
The market size is estimated to be USD XXX N/A as of 2022.
5. What are some drivers contributing to market growth?
N/A
6. What are the notable trends driving market growth?
N/A
7. Are there any restraints impacting market growth?
N/A
8. Can you provide examples of recent developments in the market?
N/A
9. What pricing options are available for accessing the report?
Pricing options include single-user, multi-user, and enterprise licenses priced at USD 3950.00, USD 5925.00, and USD 7900.00 respectively.
10. Is the market size provided in terms of value or volume?
The market size is provided in terms of value, measured in N/A and volume, measured in K.
11. Are there any specific market keywords associated with the report?
Yes, the market keyword associated with the report is "Video Conference Camera," which aids in identifying and referencing the specific market segment covered.
12. How do I determine which pricing option suits my needs best?
The pricing options vary based on user requirements and access needs. Individual users may opt for single-user licenses, while businesses requiring broader access may choose multi-user or enterprise licenses for cost-effective access to the report.
13. Are there any additional resources or data provided in the Video Conference Camera report?
While the report offers comprehensive insights, it's advisable to review the specific contents or supplementary materials provided to ascertain if additional resources or data are available.
14. How can I stay updated on further developments or reports in the Video Conference Camera?
To stay informed about further developments, trends, and reports in the Video Conference Camera, consider subscribing to industry newsletters, following relevant companies and organizations, or regularly checking reputable industry news sources and publications.
Methodology
Step 1 - Identification of Relevant Samples Size from Population Database


Step 2 - Approaches for Defining Global Market Size (Value, Volume* & Price*)

Note*: In applicable scenarios
Step 3 - Data Sources
Primary Research
- Web Analytics
- Survey Reports
- Research Institute
- Latest Research Reports
- Opinion Leaders
Secondary Research
- Annual Reports
- White Paper
- Latest Press Release
- Industry Association
- Paid Database
- Investor Presentations

Step 4 - Data Triangulation
Involves using different sources of information in order to increase the validity of a study
These sources are likely to be stakeholders in a program - participants, other researchers, program staff, other community members, and so on.
Then we put all data in single framework & apply various statistical tools to find out the dynamic on the market.
During the analysis stage, feedback from the stakeholder groups would be compared to determine areas of agreement as well as areas of divergence