

Key Insights
The global video conference camera market is experiencing robust growth, driven by the increasing adoption of remote work models, the expansion of hybrid work environments, and the rising demand for enhanced communication and collaboration tools across various sectors. The market's size in 2025 is estimated at $5 billion, reflecting a significant increase from previous years. This substantial growth is fueled by technological advancements leading to improved camera quality, enhanced features like AI-powered noise cancellation and auto-framing, and the integration of video conferencing with other collaboration platforms. Furthermore, the affordability of high-quality video conferencing solutions is making them accessible to a wider range of businesses and individuals, further stimulating market expansion. The market is segmented based on resolution, features (like pan-tilt-zoom), deployment type (cloud vs. on-premise), and end-user industry (including education, healthcare, and government). Competitive intensity is high, with established players like Cisco and Polycom alongside emerging players like Maxhub and Yealink vying for market share through innovation and strategic partnerships.
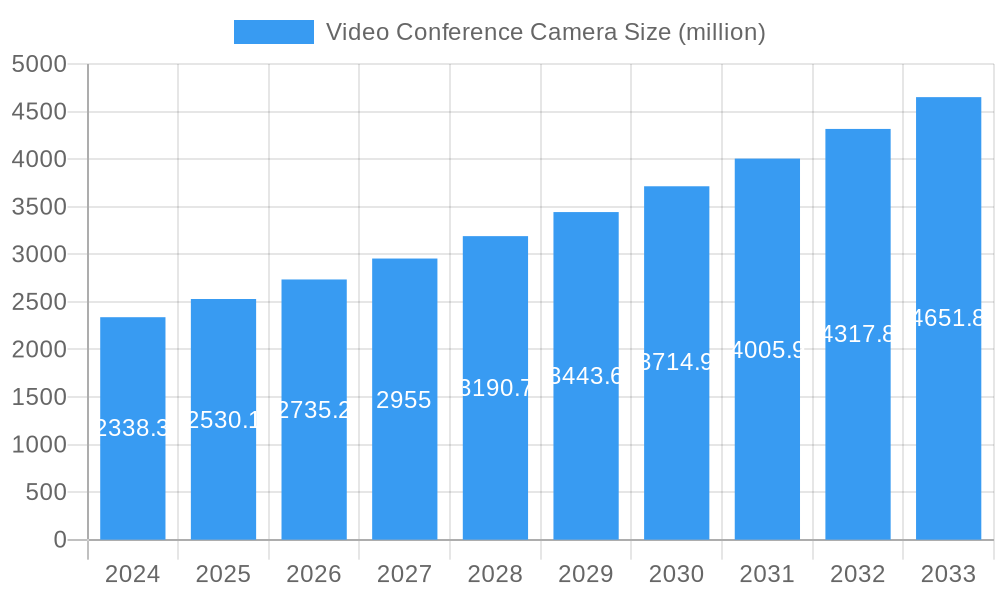
Video Conference Camera Market Size (In Billion)
The forecast period (2025-2033) anticipates a continued upward trajectory, with a Compound Annual Growth Rate (CAGR) projected at approximately 15%. Factors like the increasing penetration of 5G networks, the growing preference for virtual meetings and events, and the ongoing investments in digital infrastructure will propel market expansion. However, challenges such as cybersecurity concerns related to data privacy and the need for reliable internet connectivity in geographically diverse areas could pose some restraints. Nevertheless, the overall market outlook remains positive, indicating significant opportunities for both established and new players in the video conference camera industry. The market is expected to surpass $15 billion by 2033, driven by consistent technological innovation and the enduring demand for seamless virtual communication solutions.
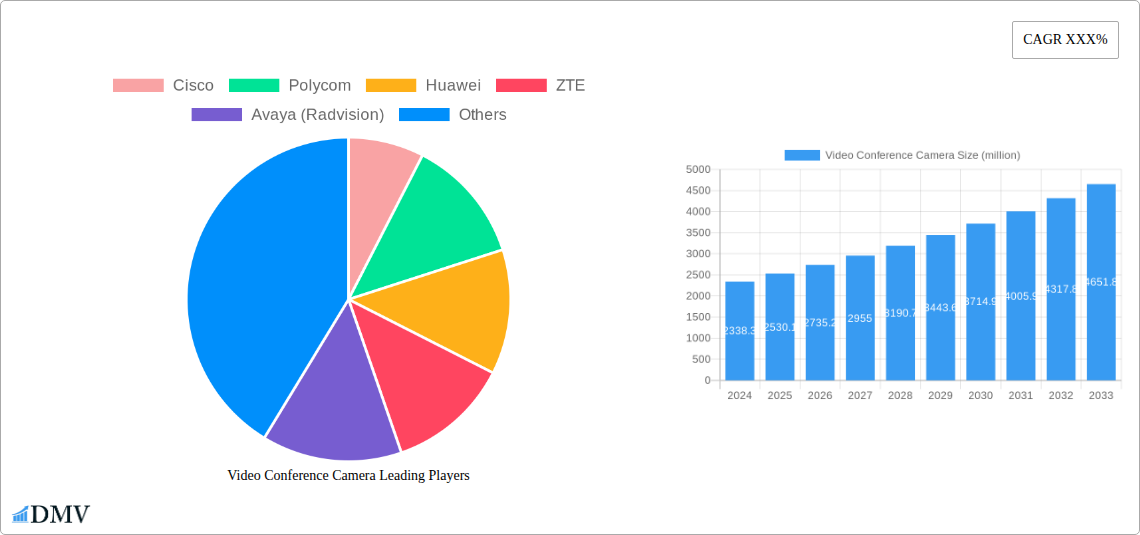
Video Conference Camera Company Market Share
Video Conference Camera Market Report: A Comprehensive Analysis (2019-2033)
This insightful report provides a detailed analysis of the global Video Conference Camera market, projecting a market value exceeding $XX million by 2033. The study covers the period from 2019 to 2033, with a focus on the forecast period (2025-2033), using 2025 as the base year and estimated year. The report delves into market composition, leading players, technological advancements, and future growth opportunities, offering valuable insights for stakeholders across the industry.
Video Conference Camera Market Composition & Trends
This section analyzes the competitive landscape, identifying key trends shaping the Video Conference Camera market. The report examines market concentration, revealing the share held by major players like Cisco, Polycom, Huawei, and others. We analyze innovation drivers, such as advancements in AI-powered features and 4K resolution capabilities, and their impact on market growth. Regulatory landscapes impacting international trade and data privacy are also scrutinized. The report further investigates substitute products, including software-based video conferencing solutions, and assesses their influence on market dynamics. Detailed end-user profiles across various sectors—from corporate enterprises to education and healthcare—are profiled, illustrating diverse applications and market needs. Finally, the report documents significant mergers and acquisitions (M&A) activities within the industry, estimating deal values in the millions of dollars and analyzing their influence on market consolidation and technological advancements.
- Market Share Distribution (2025): Cisco (XX%), Polycom (XX%), Huawei (XX%), Others (XX%).
- Top 3 M&A Deals (2019-2024): Deal 1: $XX million; Deal 2: $XX million; Deal 3: $XX million.
Video Conference Camera Industry Evolution
This section details the evolution of the Video Conference Camera market from 2019 to 2033. We analyze market growth trajectories, revealing a Compound Annual Growth Rate (CAGR) of XX% during the forecast period (2025-2033). Technological advancements, including the integration of advanced features like AI-powered noise cancellation and improved video compression technologies, are meticulously examined. The report also charts the shift in consumer demands, highlighting preferences for seamless integration with existing communication platforms and enhanced security features. Specific data points, such as adoption rates of 4K cameras and the penetration of AI-powered features in different segments, will be provided. This section also explores the impact of the pandemic and increased remote work adoption on market growth. Further, we analyze the influence of factors like rising internet penetration and the increasing need for efficient communication across global teams.
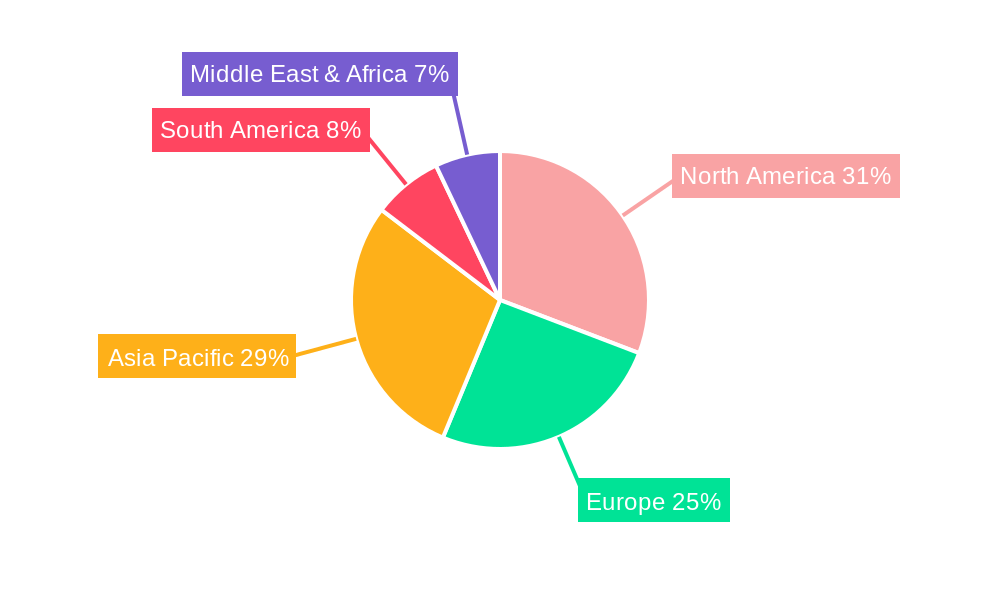
Leading Regions, Countries, or Segments in Video Conference Camera
This section pinpoints the dominant regions and segments within the Video Conference Camera market. North America currently leads the market, driven by factors such as high technological adoption and strong investment in advanced communication infrastructure.
- Key Drivers for North American Dominance:
- Strong R&D investment in video conferencing technology.
- High adoption rates in corporate and education sectors.
- Favorable regulatory environment for technological advancements.
- Other Key Regions: Europe, Asia-Pacific, etc. Detailed analysis of their growth drivers and market characteristics will be provided. This will include an examination of the influence of government regulations, economic factors, and competitive landscapes within each region.
Video Conference Camera Product Innovations
Recent product innovations have focused on improving video and audio quality, integrating AI capabilities for enhanced user experience, and introducing advanced security features. New products incorporate features like AI-powered noise cancellation, improved auto-framing capabilities, and better low-light performance. The emergence of 4K and 8K resolution cameras is driving market growth. These innovations address demands for higher-quality video calls and seamless integration across various platforms.
Propelling Factors for Video Conference Camera Growth
Several factors contribute to the growth of the Video Conference Camera market. Technological advancements, such as improved image sensors and AI-powered features, are driving market expansion. Economic factors, including the increasing adoption of remote work and the growing demand for collaborative tools, are key propellants. Regulatory changes, especially those promoting digital transformation and remote communication in various sectors, further stimulate market growth.
Obstacles in the Video Conference Camera Market
Despite significant growth, the Video Conference Camera market faces challenges. Regulatory hurdles, such as data privacy regulations in various jurisdictions, impose constraints. Supply chain disruptions, particularly concerning semiconductor components, may impact production capacity and prices. Intense competition among established players and new entrants also presents a significant obstacle. These factors can affect market profitability and growth projections.
Future Opportunities in Video Conference Camera
Future opportunities lie in the integration of advanced technologies like augmented reality (AR) and virtual reality (VR) to enhance video conferencing experiences. Expansion into new markets, including developing economies, and tapping into niche sectors, such as healthcare and education, offer substantial growth potential. Growing consumer demand for advanced features such as superior video quality and enhanced security features will present new opportunities.
Major Players in the Video Conference Camera Ecosystem
Key Developments in Video Conference Camera Industry
- 2022 Q4: Cisco launched its new flagship video conferencing camera with enhanced AI features.
- 2023 Q1: Polycom announced a strategic partnership to expand its global distribution network.
- 2023 Q2: Huawei released a new range of budget-friendly video conference cameras targeting the SME market.
- (Further key developments with dates will be included)
Strategic Video Conference Camera Market Forecast
The Video Conference Camera market is poised for robust growth driven by continuous technological innovation, expanding adoption across diverse sectors, and favorable regulatory changes supporting remote work. The integration of advanced features like AI and improved security protocols, coupled with the expansion into untapped markets, will propel market expansion exceeding $XX million by 2033. Sustained demand for high-quality video conferencing solutions in corporate settings and the educational sector will remain primary drivers of market growth during the forecast period.
Video Conference Camera Segmentation
-
1. Application
- 1.1. Education
- 1.2. Industrial and Commercial
- 1.3. Medical
- 1.4. Others
-
2. Type
- 2.1. USB Ports
- 2.2. Wireless
Video Conference Camera Segmentation By Geography
-
1. North America
- 1.1. United States
- 1.2. Canada
- 1.3. Mexico
-
2. South America
- 2.1. Brazil
- 2.2. Argentina
- 2.3. Rest of South America
-
3. Europe
- 3.1. United Kingdom
- 3.2. Germany
- 3.3. France
- 3.4. Italy
- 3.5. Spain
- 3.6. Russia
- 3.7. Benelux
- 3.8. Nordics
- 3.9. Rest of Europe
-
4. Middle East & Africa
- 4.1. Turkey
- 4.2. Israel
- 4.3. GCC
- 4.4. North Africa
- 4.5. South Africa
- 4.6. Rest of Middle East & Africa
-
5. Asia Pacific
- 5.1. China
- 5.2. India
- 5.3. Japan
- 5.4. South Korea
- 5.5. ASEAN
- 5.6. Oceania
- 5.7. Rest of Asia Pacific
Video Conference Camera Regional Market Share
Geographic Coverage of Video Conference Camera
Video Conference Camera REPORT HIGHLIGHTS
| Aspects | Details |
|---|---|
| Study Period | 2020-2034 |
| Base Year | 2025 |
| Estimated Year | 2026 |
| Forecast Period | 2026-2034 |
| Historical Period | 2020-2025 |
| Growth Rate | CAGR of 7.8% from 2020-2034 |
| Segmentation |
|
Table of Contents
- 1. Introduction
- 1.1. Research Scope
- 1.2. Market Segmentation
- 1.3. Research Objective
- 1.4. Definitions and Assumptions
- 2. Executive Summary
- 2.1. Market Snapshot
- 3. Market Dynamics
- 3.1. Market Drivers
- 3.2. Market Restrains
- 3.3. Market Trends
- 3.4. Market Opportunities
- 4. Market Factor Analysis
- 4.1. Porters Five Forces
- 4.1.1. Bargaining Power of Suppliers
- 4.1.2. Bargaining Power of Buyers
- 4.1.3. Threat of New Entrants
- 4.1.4. Threat of Substitutes
- 4.1.5. Competitive Rivalry
- 4.2. PESTEL analysis
- 4.3. BCG Analysis
- 4.3.1. Stars (High Growth, High Market Share)
- 4.3.2. Cash Cows (Low Growth, High Market Share)
- 4.3.3. Question Mark (High Growth, Low Market Share)
- 4.3.4. Dogs (Low Growth, Low Market Share)
- 4.4. Ansoff Matrix Analysis
- 4.5. Supply Chain Analysis
- 4.6. Regulatory Landscape
- 4.7. Current Market Potential and Opportunity Assessment (TAM–SAM–SOM Framework)
- 4.8. DMV Analyst Note
- 4.1. Porters Five Forces
- 5. Market Analysis, Insights and Forecast 2021-2033
- 5.1. Market Analysis, Insights and Forecast - by Application
- 5.1.1. Education
- 5.1.2. Industrial and Commercial
- 5.1.3. Medical
- 5.1.4. Others
- 5.2. Market Analysis, Insights and Forecast - by Type
- 5.2.1. USB Ports
- 5.2.2. Wireless
- 5.3. Market Analysis, Insights and Forecast - by Region
- 5.3.1. North America
- 5.3.2. South America
- 5.3.3. Europe
- 5.3.4. Middle East & Africa
- 5.3.5. Asia Pacific
- 5.1. Market Analysis, Insights and Forecast - by Application
- 6. Global Video Conference Camera Analysis, Insights and Forecast, 2021-2033
- 6.1. Market Analysis, Insights and Forecast - by Application
- 6.1.1. Education
- 6.1.2. Industrial and Commercial
- 6.1.3. Medical
- 6.1.4. Others
- 6.2. Market Analysis, Insights and Forecast - by Type
- 6.2.1. USB Ports
- 6.2.2. Wireless
- 6.1. Market Analysis, Insights and Forecast - by Application
- 7. North America Video Conference Camera Analysis, Insights and Forecast, 2020-2032
- 7.1. Market Analysis, Insights and Forecast - by Application
- 7.1.1. Education
- 7.1.2. Industrial and Commercial
- 7.1.3. Medical
- 7.1.4. Others
- 7.2. Market Analysis, Insights and Forecast - by Type
- 7.2.1. USB Ports
- 7.2.2. Wireless
- 7.1. Market Analysis, Insights and Forecast - by Application
- 8. South America Video Conference Camera Analysis, Insights and Forecast, 2020-2032
- 8.1. Market Analysis, Insights and Forecast - by Application
- 8.1.1. Education
- 8.1.2. Industrial and Commercial
- 8.1.3. Medical
- 8.1.4. Others
- 8.2. Market Analysis, Insights and Forecast - by Type
- 8.2.1. USB Ports
- 8.2.2. Wireless
- 8.1. Market Analysis, Insights and Forecast - by Application
- 9. Europe Video Conference Camera Analysis, Insights and Forecast, 2020-2032
- 9.1. Market Analysis, Insights and Forecast - by Application
- 9.1.1. Education
- 9.1.2. Industrial and Commercial
- 9.1.3. Medical
- 9.1.4. Others
- 9.2. Market Analysis, Insights and Forecast - by Type
- 9.2.1. USB Ports
- 9.2.2. Wireless
- 9.1. Market Analysis, Insights and Forecast - by Application
- 10. Middle East & Africa Video Conference Camera Analysis, Insights and Forecast, 2020-2032
- 10.1. Market Analysis, Insights and Forecast - by Application
- 10.1.1. Education
- 10.1.2. Industrial and Commercial
- 10.1.3. Medical
- 10.1.4. Others
- 10.2. Market Analysis, Insights and Forecast - by Type
- 10.2.1. USB Ports
- 10.2.2. Wireless
- 10.1. Market Analysis, Insights and Forecast - by Application
- 11. Asia Pacific Video Conference Camera Analysis, Insights and Forecast, 2020-2032
- 11.1. Market Analysis, Insights and Forecast - by Application
- 11.1.1. Education
- 11.1.2. Industrial and Commercial
- 11.1.3. Medical
- 11.1.4. Others
- 11.2. Market Analysis, Insights and Forecast - by Type
- 11.2.1. USB Ports
- 11.2.2. Wireless
- 11.1. Market Analysis, Insights and Forecast - by Application
- 12. Competitive Analysis
- 12.1. Company Profiles
- 12.1.1 Cisco
- 12.1.1.1. Company Overview
- 12.1.1.2. Products
- 12.1.1.3. Company Financials
- 12.1.1.4. SWOT Analysis
- 12.1.2 Polycom
- 12.1.2.1. Company Overview
- 12.1.2.2. Products
- 12.1.2.3. Company Financials
- 12.1.2.4. SWOT Analysis
- 12.1.3 Huawei
- 12.1.3.1. Company Overview
- 12.1.3.2. Products
- 12.1.3.3. Company Financials
- 12.1.3.4. SWOT Analysis
- 12.1.4 ZTE
- 12.1.4.1. Company Overview
- 12.1.4.2. Products
- 12.1.4.3. Company Financials
- 12.1.4.4. SWOT Analysis
- 12.1.5 Avaya (Radvision)
- 12.1.5.1. Company Overview
- 12.1.5.2. Products
- 12.1.5.3. Company Financials
- 12.1.5.4. SWOT Analysis
- 12.1.6 Lifesize
- 12.1.6.1. Company Overview
- 12.1.6.2. Products
- 12.1.6.3. Company Financials
- 12.1.6.4. SWOT Analysis
- 12.1.7 Vidyo
- 12.1.7.1. Company Overview
- 12.1.7.2. Products
- 12.1.7.3. Company Financials
- 12.1.7.4. SWOT Analysis
- 12.1.8 Starleaf
- 12.1.8.1. Company Overview
- 12.1.8.2. Products
- 12.1.8.3. Company Financials
- 12.1.8.4. SWOT Analysis
- 12.1.9 Kedacom
- 12.1.9.1. Company Overview
- 12.1.9.2. Products
- 12.1.9.3. Company Financials
- 12.1.9.4. SWOT Analysis
- 12.1.10 Tely Labs
- 12.1.10.1. Company Overview
- 12.1.10.2. Products
- 12.1.10.3. Company Financials
- 12.1.10.4. SWOT Analysis
- 12.1.11 ClearOne
- 12.1.11.1. Company Overview
- 12.1.11.2. Products
- 12.1.11.3. Company Financials
- 12.1.11.4. SWOT Analysis
- 12.1.12 SONY
- 12.1.12.1. Company Overview
- 12.1.12.2. Products
- 12.1.12.3. Company Financials
- 12.1.12.4. SWOT Analysis
- 12.1.13 Yealink
- 12.1.13.1. Company Overview
- 12.1.13.2. Products
- 12.1.13.3. Company Financials
- 12.1.13.4. SWOT Analysis
- 12.1.14 Guangzhou Shizhen Information Technology(MAXHUB)
- 12.1.14.1. Company Overview
- 12.1.14.2. Products
- 12.1.14.3. Company Financials
- 12.1.14.4. SWOT Analysis
- 12.1.15 INNOTRIK
- 12.1.15.1. Company Overview
- 12.1.15.2. Products
- 12.1.15.3. Company Financials
- 12.1.15.4. SWOT Analysis
- 12.1.16 Runpu
- 12.1.16.1. Company Overview
- 12.1.16.2. Products
- 12.1.16.3. Company Financials
- 12.1.16.4. SWOT Analysis
- 12.1.17 Logitech
- 12.1.17.1. Company Overview
- 12.1.17.2. Products
- 12.1.17.3. Company Financials
- 12.1.17.4. SWOT Analysis
- 12.1.18 NEXVOO
- 12.1.18.1. Company Overview
- 12.1.18.2. Products
- 12.1.18.3. Company Financials
- 12.1.18.4. SWOT Analysis
- 12.1.19 Suirui
- 12.1.19.1. Company Overview
- 12.1.19.2. Products
- 12.1.19.3. Company Financials
- 12.1.19.4. SWOT Analysis
- 12.1.20 DAIPU
- 12.1.20.1. Company Overview
- 12.1.20.2. Products
- 12.1.20.3. Company Financials
- 12.1.20.4. SWOT Analysis
- 12.1.21 HOSODO
- 12.1.21.1. Company Overview
- 12.1.21.2. Products
- 12.1.21.3. Company Financials
- 12.1.21.4. SWOT Analysis
- 12.1.22 Panasonic
- 12.1.22.1. Company Overview
- 12.1.22.2. Products
- 12.1.22.3. Company Financials
- 12.1.22.4. SWOT Analysis
- 12.1.23 Canon
- 12.1.23.1. Company Overview
- 12.1.23.2. Products
- 12.1.23.3. Company Financials
- 12.1.23.4. SWOT Analysis
- 12.1.24 Hewlett-Packard
- 12.1.24.1. Company Overview
- 12.1.24.2. Products
- 12.1.24.3. Company Financials
- 12.1.24.4. SWOT Analysis
- 12.1.25 AVer
- 12.1.25.1. Company Overview
- 12.1.25.2. Products
- 12.1.25.3. Company Financials
- 12.1.25.4. SWOT Analysis
- 12.1.26 Ricoh
- 12.1.26.1. Company Overview
- 12.1.26.2. Products
- 12.1.26.3. Company Financials
- 12.1.26.4. SWOT Analysis
- 12.1.27 Lenovo
- 12.1.27.1. Company Overview
- 12.1.27.2. Products
- 12.1.27.3. Company Financials
- 12.1.27.4. SWOT Analysis
- 12.1.28 Philips
- 12.1.28.1. Company Overview
- 12.1.28.2. Products
- 12.1.28.3. Company Financials
- 12.1.28.4. SWOT Analysis
- 12.1.1 Cisco
- 12.2. Market Entropy
- 12.2.1 Company's Key Areas Served
- 12.2.2 Recent Developments
- 12.3. Company Market Share Analysis 2025
- 12.3.1 Top 5 Companies Market Share Analysis
- 12.3.2 Top 3 Companies Market Share Analysis
- 12.4. List of Potential Customers
- 13. Research Methodology
List of Figures
- Figure 1: Global Video Conference Camera Revenue Breakdown (undefined, %) by Region 2025 & 2033
- Figure 2: North America Video Conference Camera Revenue (undefined), by Application 2025 & 2033
- Figure 3: North America Video Conference Camera Revenue Share (%), by Application 2025 & 2033
- Figure 4: North America Video Conference Camera Revenue (undefined), by Type 2025 & 2033
- Figure 5: North America Video Conference Camera Revenue Share (%), by Type 2025 & 2033
- Figure 6: North America Video Conference Camera Revenue (undefined), by Country 2025 & 2033
- Figure 7: North America Video Conference Camera Revenue Share (%), by Country 2025 & 2033
- Figure 8: South America Video Conference Camera Revenue (undefined), by Application 2025 & 2033
- Figure 9: South America Video Conference Camera Revenue Share (%), by Application 2025 & 2033
- Figure 10: South America Video Conference Camera Revenue (undefined), by Type 2025 & 2033
- Figure 11: South America Video Conference Camera Revenue Share (%), by Type 2025 & 2033
- Figure 12: South America Video Conference Camera Revenue (undefined), by Country 2025 & 2033
- Figure 13: South America Video Conference Camera Revenue Share (%), by Country 2025 & 2033
- Figure 14: Europe Video Conference Camera Revenue (undefined), by Application 2025 & 2033
- Figure 15: Europe Video Conference Camera Revenue Share (%), by Application 2025 & 2033
- Figure 16: Europe Video Conference Camera Revenue (undefined), by Type 2025 & 2033
- Figure 17: Europe Video Conference Camera Revenue Share (%), by Type 2025 & 2033
- Figure 18: Europe Video Conference Camera Revenue (undefined), by Country 2025 & 2033
- Figure 19: Europe Video Conference Camera Revenue Share (%), by Country 2025 & 2033
- Figure 20: Middle East & Africa Video Conference Camera Revenue (undefined), by Application 2025 & 2033
- Figure 21: Middle East & Africa Video Conference Camera Revenue Share (%), by Application 2025 & 2033
- Figure 22: Middle East & Africa Video Conference Camera Revenue (undefined), by Type 2025 & 2033
- Figure 23: Middle East & Africa Video Conference Camera Revenue Share (%), by Type 2025 & 2033
- Figure 24: Middle East & Africa Video Conference Camera Revenue (undefined), by Country 2025 & 2033
- Figure 25: Middle East & Africa Video Conference Camera Revenue Share (%), by Country 2025 & 2033
- Figure 26: Asia Pacific Video Conference Camera Revenue (undefined), by Application 2025 & 2033
- Figure 27: Asia Pacific Video Conference Camera Revenue Share (%), by Application 2025 & 2033
- Figure 28: Asia Pacific Video Conference Camera Revenue (undefined), by Type 2025 & 2033
- Figure 29: Asia Pacific Video Conference Camera Revenue Share (%), by Type 2025 & 2033
- Figure 30: Asia Pacific Video Conference Camera Revenue (undefined), by Country 2025 & 2033
- Figure 31: Asia Pacific Video Conference Camera Revenue Share (%), by Country 2025 & 2033
List of Tables
- Table 1: Global Video Conference Camera Revenue undefined Forecast, by Application 2020 & 2033
- Table 2: Global Video Conference Camera Revenue undefined Forecast, by Type 2020 & 2033
- Table 3: Global Video Conference Camera Revenue undefined Forecast, by Region 2020 & 2033
- Table 4: Global Video Conference Camera Revenue undefined Forecast, by Application 2020 & 2033
- Table 5: Global Video Conference Camera Revenue undefined Forecast, by Type 2020 & 2033
- Table 6: Global Video Conference Camera Revenue undefined Forecast, by Country 2020 & 2033
- Table 7: United States Video Conference Camera Revenue (undefined) Forecast, by Application 2020 & 2033
- Table 8: Canada Video Conference Camera Revenue (undefined) Forecast, by Application 2020 & 2033
- Table 9: Mexico Video Conference Camera Revenue (undefined) Forecast, by Application 2020 & 2033
- Table 10: Global Video Conference Camera Revenue undefined Forecast, by Application 2020 & 2033
- Table 11: Global Video Conference Camera Revenue undefined Forecast, by Type 2020 & 2033
- Table 12: Global Video Conference Camera Revenue undefined Forecast, by Country 2020 & 2033
- Table 13: Brazil Video Conference Camera Revenue (undefined) Forecast, by Application 2020 & 2033
- Table 14: Argentina Video Conference Camera Revenue (undefined) Forecast, by Application 2020 & 2033
- Table 15: Rest of South America Video Conference Camera Revenue (undefined) Forecast, by Application 2020 & 2033
- Table 16: Global Video Conference Camera Revenue undefined Forecast, by Application 2020 & 2033
- Table 17: Global Video Conference Camera Revenue undefined Forecast, by Type 2020 & 2033
- Table 18: Global Video Conference Camera Revenue undefined Forecast, by Country 2020 & 2033
- Table 19: United Kingdom Video Conference Camera Revenue (undefined) Forecast, by Application 2020 & 2033
- Table 20: Germany Video Conference Camera Revenue (undefined) Forecast, by Application 2020 & 2033
- Table 21: France Video Conference Camera Revenue (undefined) Forecast, by Application 2020 & 2033
- Table 22: Italy Video Conference Camera Revenue (undefined) Forecast, by Application 2020 & 2033
- Table 23: Spain Video Conference Camera Revenue (undefined) Forecast, by Application 2020 & 2033
- Table 24: Russia Video Conference Camera Revenue (undefined) Forecast, by Application 2020 & 2033
- Table 25: Benelux Video Conference Camera Revenue (undefined) Forecast, by Application 2020 & 2033
- Table 26: Nordics Video Conference Camera Revenue (undefined) Forecast, by Application 2020 & 2033
- Table 27: Rest of Europe Video Conference Camera Revenue (undefined) Forecast, by Application 2020 & 2033
- Table 28: Global Video Conference Camera Revenue undefined Forecast, by Application 2020 & 2033
- Table 29: Global Video Conference Camera Revenue undefined Forecast, by Type 2020 & 2033
- Table 30: Global Video Conference Camera Revenue undefined Forecast, by Country 2020 & 2033
- Table 31: Turkey Video Conference Camera Revenue (undefined) Forecast, by Application 2020 & 2033
- Table 32: Israel Video Conference Camera Revenue (undefined) Forecast, by Application 2020 & 2033
- Table 33: GCC Video Conference Camera Revenue (undefined) Forecast, by Application 2020 & 2033
- Table 34: North Africa Video Conference Camera Revenue (undefined) Forecast, by Application 2020 & 2033
- Table 35: South Africa Video Conference Camera Revenue (undefined) Forecast, by Application 2020 & 2033
- Table 36: Rest of Middle East & Africa Video Conference Camera Revenue (undefined) Forecast, by Application 2020 & 2033
- Table 37: Global Video Conference Camera Revenue undefined Forecast, by Application 2020 & 2033
- Table 38: Global Video Conference Camera Revenue undefined Forecast, by Type 2020 & 2033
- Table 39: Global Video Conference Camera Revenue undefined Forecast, by Country 2020 & 2033
- Table 40: China Video Conference Camera Revenue (undefined) Forecast, by Application 2020 & 2033
- Table 41: India Video Conference Camera Revenue (undefined) Forecast, by Application 2020 & 2033
- Table 42: Japan Video Conference Camera Revenue (undefined) Forecast, by Application 2020 & 2033
- Table 43: South Korea Video Conference Camera Revenue (undefined) Forecast, by Application 2020 & 2033
- Table 44: ASEAN Video Conference Camera Revenue (undefined) Forecast, by Application 2020 & 2033
- Table 45: Oceania Video Conference Camera Revenue (undefined) Forecast, by Application 2020 & 2033
- Table 46: Rest of Asia Pacific Video Conference Camera Revenue (undefined) Forecast, by Application 2020 & 2033
Frequently Asked Questions
1. What is the projected Compound Annual Growth Rate (CAGR) of the Video Conference Camera?
The projected CAGR is approximately 7.8%.
2. Which companies are prominent players in the Video Conference Camera?
Key companies in the market include Cisco, Polycom, Huawei, ZTE, Avaya (Radvision), Lifesize, Vidyo, Starleaf, Kedacom, Tely Labs, ClearOne, SONY, Yealink, Guangzhou Shizhen Information Technology(MAXHUB), INNOTRIK, Runpu, Logitech, NEXVOO, Suirui, DAIPU, HOSODO, Panasonic, Canon, Hewlett-Packard, AVer, Ricoh, Lenovo, Philips.
3. What are the main segments of the Video Conference Camera?
The market segments include Application, Type.
4. Can you provide details about the market size?
The market size is estimated to be USD XXX N/A as of 2022.
5. What are some drivers contributing to market growth?
N/A
6. What are the notable trends driving market growth?
N/A
7. Are there any restraints impacting market growth?
N/A
8. Can you provide examples of recent developments in the market?
N/A
9. What pricing options are available for accessing the report?
Pricing options include single-user, multi-user, and enterprise licenses priced at USD 2900.00, USD 4350.00, and USD 5800.00 respectively.
10. Is the market size provided in terms of value or volume?
The market size is provided in terms of value, measured in N/A.
11. Are there any specific market keywords associated with the report?
Yes, the market keyword associated with the report is "Video Conference Camera," which aids in identifying and referencing the specific market segment covered.
12. How do I determine which pricing option suits my needs best?
The pricing options vary based on user requirements and access needs. Individual users may opt for single-user licenses, while businesses requiring broader access may choose multi-user or enterprise licenses for cost-effective access to the report.
13. Are there any additional resources or data provided in the Video Conference Camera report?
While the report offers comprehensive insights, it's advisable to review the specific contents or supplementary materials provided to ascertain if additional resources or data are available.
14. How can I stay updated on further developments or reports in the Video Conference Camera?
To stay informed about further developments, trends, and reports in the Video Conference Camera, consider subscribing to industry newsletters, following relevant companies and organizations, or regularly checking reputable industry news sources and publications.
Methodology
Step 1 - Identification of Relevant Samples Size from Population Database


Step 2 - Approaches for Defining Global Market Size (Value, Volume* & Price*)

Note*: In applicable scenarios
Step 3 - Data Sources
Primary Research
- Web Analytics
- Survey Reports
- Research Institute
- Latest Research Reports
- Opinion Leaders
Secondary Research
- Annual Reports
- White Paper
- Latest Press Release
- Industry Association
- Paid Database
- Investor Presentations

Step 4 - Data Triangulation
Involves using different sources of information in order to increase the validity of a study
These sources are likely to be stakeholders in a program - participants, other researchers, program staff, other community members, and so on.
Then we put all data in single framework & apply various statistical tools to find out the dynamic on the market.
During the analysis stage, feedback from the stakeholder groups would be compared to determine areas of agreement as well as areas of divergence