

Key Insights
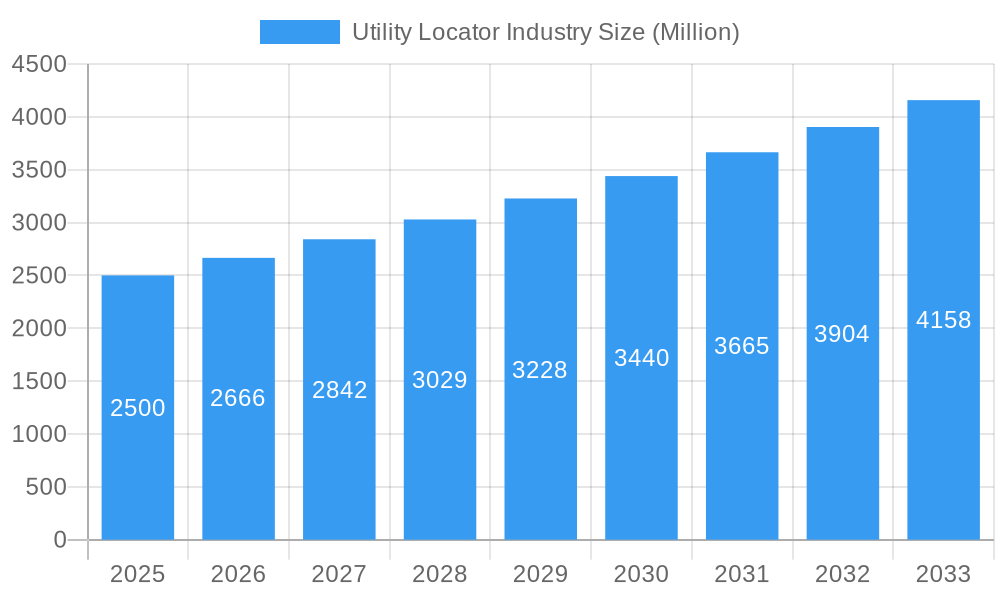
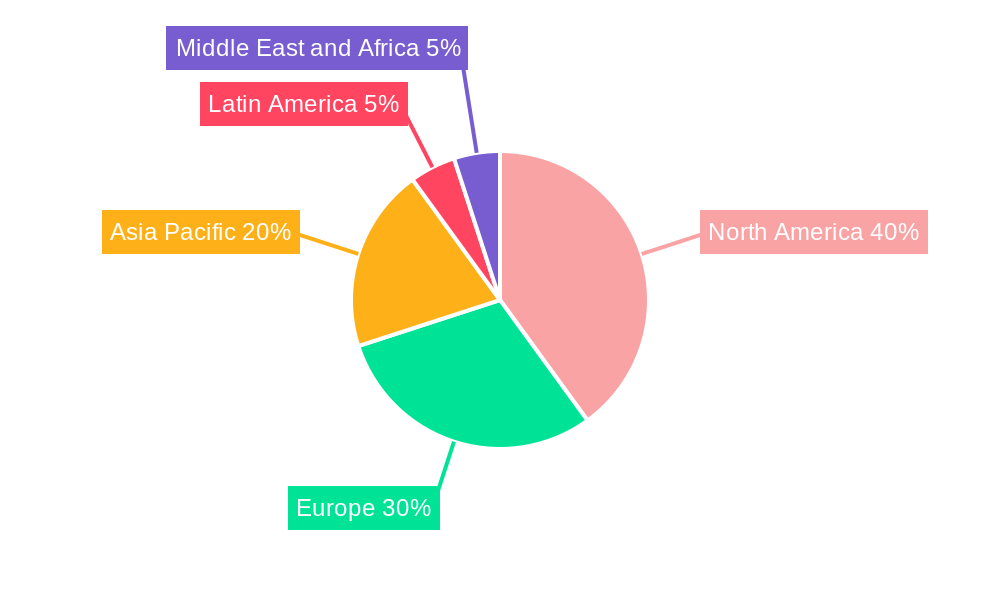
The global utility locator market is poised for significant expansion, propelled by escalating urbanization, extensive infrastructure development, and stringent safety mandates designed to mitigate underground utility damage. The market, valued at 913.78 million in the base year 2024, is projected to achieve a Compound Annual Growth Rate (CAGR) of 6.28%, forecasting a market size of over 913.78 million by 2033. Key growth catalysts include the widespread adoption of sophisticated technologies such as electromagnetic field and ground penetrating radar systems, enhancing the precision and efficiency of underground asset detection. Additionally, the rising demand for utility location services across critical sectors including oil & gas, energy, transportation, and telecommunications is a primary driver of market growth. The market is comprehensively segmented by target (metallic and non-metallic utilities), methodology (electromagnetic field, ground penetrating radar, and alternative techniques), application (oil & gas, energy, transportation, water & sewage, telecommunications, and other applications), and offering (equipment and services). North America currently leads the market due to substantial infrastructure investments and technological progress, while the Asia-Pacific region anticipates the most rapid expansion, fueled by swift infrastructure development and increasing urbanization in emerging economies.
Utility Locator Industry Market Size (In Million)
While the utility locator market demonstrates considerable growth prospects, certain challenges exist. Substantial upfront investment in advanced equipment can pose a barrier for smaller enterprises. Furthermore, the requirement for highly skilled professionals to operate and analyze data from these technologies presents a hurdle. Nevertheless, continuous technological innovation and heightened awareness regarding damage prevention are expected to overcome these limitations, fostering sustained market expansion throughout the forecast period. The competitive arena features established industry leaders such as Leica Geosystems, Vivax-Metrotech, and Emerson Electric, alongside specialized providers like ProStar Geocorp and Irth Solutions, all committed to advancing technology and service offerings to secure a competitive advantage.
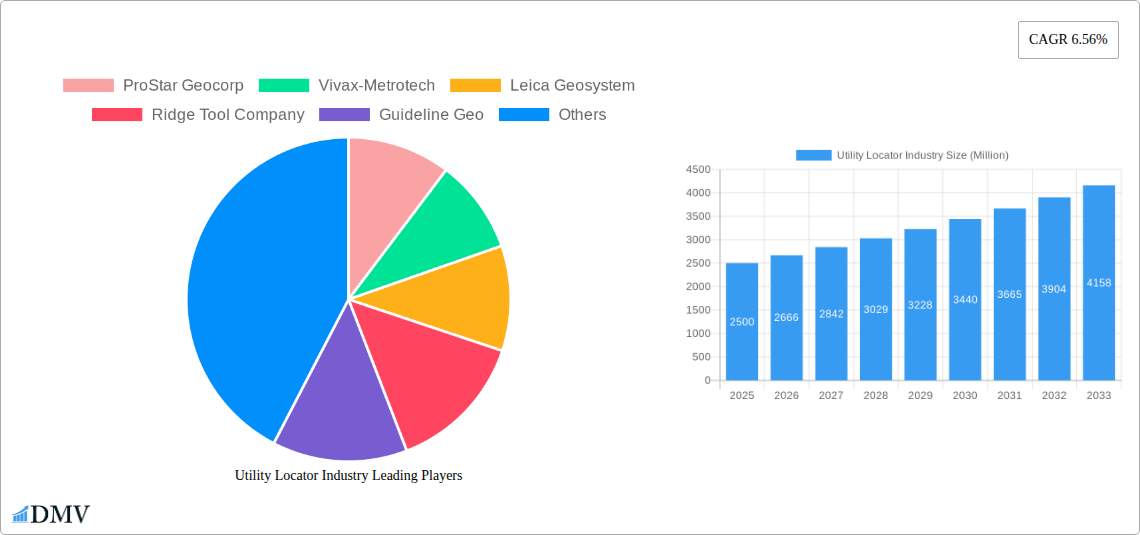
Utility Locator Industry Company Market Share
Utility Locator Industry Market Report: 2019-2033
This comprehensive report provides a detailed analysis of the Utility Locator Industry, encompassing market size, trends, leading players, and future projections from 2019 to 2033. With a focus on key segments – by target (metallic and non-metallic utilities), technique (electromagnetic field, ground penetrating radar, and other techniques), application (oil & gas, electricity, transportation, water & sewage, telecommunications, and others), and offering (equipment and services) – this report offers invaluable insights for stakeholders seeking to navigate this dynamic market. The report covers a market valued at $XX Million in 2025, projecting significant growth to $XX Million by 2033.
Utility Locator Industry Market Composition & Trends
The Utility Locator Industry is characterized by a moderately concentrated market, with key players such as ProStar Geocorp, Vivax-Metrotech, Leica Geosystems, and Honeywell International Inc. holding significant market share. The precise distribution of market share amongst these companies and others is detailed within the full report, along with a comprehensive breakdown of recent M&A activity and their impact on the competitive landscape. Deal values totalled $XX Million in the period covered by this report.
- Market Concentration: Moderately concentrated, with a few dominant players and a larger number of smaller niche players.
- Innovation Catalysts: Government regulations promoting safety and efficiency drive innovation in detection technologies and data management solutions.
- Regulatory Landscape: Stringent safety regulations in many regions mandate accurate utility location, impacting market growth positively.
- Substitute Products: Limited viable substitutes currently exist, enhancing market stability.
- End-User Profiles: The report provides a detailed profile of end-users across various sectors including Oil & Gas, Electricity, and Transportation.
- M&A Activities: Significant M&A activity has been observed, consolidating the market and driving technological integration.
Utility Locator Industry Industry Evolution
The Utility Locator Industry has witnessed robust growth from 2019 to 2024, driven by increased infrastructure development, stringent safety regulations, and the adoption of advanced technologies. The market is expected to maintain a compound annual growth rate (CAGR) of XX% during the forecast period (2025-2033), reaching a projected market value of $XX Million by 2033. This growth trajectory is fuelled by several factors, including the increasing demand for precise utility location data to prevent accidents and costly repairs, the adoption of advanced technologies such as GPS and GIS integration, and the increasing demand for efficient and safer underground construction projects. Technological advancements, such as the development of more accurate and efficient detection technologies and data analytics platforms, are further accelerating market growth. Consumer demands are also shifting towards more integrated and user-friendly solutions, encouraging providers to enhance their offerings and services.
Leading Regions, Countries, or Segments in Utility Locator Industry
The North American region currently dominates the Utility Locator Industry, driven by robust infrastructure development, stringent safety regulations, and significant investments in technological advancements. However, regions like Europe and Asia-Pacific are experiencing substantial growth, presenting significant opportunities.
- By Target: Metallic utilities currently hold a larger market share compared to non-metallic utilities due to the higher risk associated with damaging metallic lines.
- By Technique: Ground Penetrating Radar (GPR) is widely adopted, while electromagnetic field techniques are also significant, with both showing significant projected growth. Other techniques are also covered.
- By Application: The Oil & Gas and Electricity sectors are leading application segments, showing consistent high demand for accurate utility location services.
- By Offering: The equipment segment holds a significant market share, with services also experiencing substantial growth.
Key Drivers:
- Increased Infrastructure Investment: Government spending on infrastructure projects drives demand for utility location services.
- Stringent Safety Regulations: Regulations mandating accurate utility location before excavation fuel market growth.
- Technological Advancements: Development of improved detection technologies and data analytics boosts market demand.
Utility Locator Industry Product Innovations
Recent innovations include advanced Ground Penetrating Radar (GPR) systems with enhanced resolution and depth penetration, integrating GPS/GNSS for precise location data, and sophisticated software for data management and visualization. These innovations deliver increased accuracy, efficiency, and safety for utility location projects.
Propelling Factors for Utility Locator Industry Growth
The Utility Locator Industry’s growth is propelled by several factors, including stringent safety regulations, increased infrastructure development in various sectors like oil & gas, electricity, and telecommunications, the growing adoption of technologically advanced equipment and software, and the increasing need for efficient underground utility management.
Obstacles in the Utility Locator Industry Market
The market faces challenges such as the high initial investment costs of advanced equipment, the complexity of integrating different technologies, and potential supply chain disruptions affecting equipment availability. Furthermore, intense competition among established and emerging players can put pressure on profit margins.
Future Opportunities in Utility Locator Industry
Future opportunities include the expansion into emerging markets, the development of integrated and comprehensive data management platforms incorporating AI and machine learning, and the integration of utility location data with other infrastructure management systems.
Major Players in the Utility Locator Industry Ecosystem
- ProStar Geocorp
- Vivax-Metrotech
- Leica Geosystems
- Ridge Tool Company
- Guideline Geo
- Irth Solutions
- Sensors & Software Inc
- Subsite Electronics (Charles Machine Works)
- Emerson Electric
- Geophysical Survey Systems Inc
- Radiodetection Ltd
- Honeywell International Inc
Key Developments in Utility Locator Industry Industry
- September 2022: 2M partnered with Prostar Holdings Inc. to adopt Prostar's PointMan mobile application solution, enhancing their utility mapping operations significantly.
- July 2022: Honeywell launched extended smart energy offerings, including underground utility locating and data-capturing services using GNSS data, creating digital maps for improved efficiency.
- February 2022: Irth Solutions collaborated with Lightbox to improve location awareness, accuracy, and reduce ticket management costs for the underground utility industry.
Strategic Utility Locator Industry Market Forecast
The Utility Locator Industry is poised for significant growth, driven by technological advancements, increasing infrastructure investments, and stringent safety regulations. The market is projected to witness considerable expansion across various regions, with North America maintaining its leading position while other regions experience significant growth. The adoption of innovative technologies like AI and machine learning will further enhance efficiency and accuracy, driving continued expansion and shaping a safer and more efficient future for underground infrastructure management.
Utility Locator Industry Segmentation
-
1. Offering
- 1.1. Equipment
- 1.2. Services
-
2. Target
- 2.1. Metallic Utilities
- 2.2. Non-Metallic Utilities
-
3. Technique
- 3.1. Electromagnetic Field
- 3.2. Ground Penetrating Radar
- 3.3. Other Techniques
-
4. Application
- 4.1. Oil & Gas
- 4.2. Electricity
- 4.3. Transportation
- 4.4. Water and Sewage
- 4.5. Telecommunications
- 4.6. Other Applications
Utility Locator Industry Segmentation By Geography
- 1. North America
- 2. Europe
- 3. Asia
- 4. Australia and New Zealand
- 5. Latin America
- 6. Middle East and Africa
Utility Locator Industry Regional Market Share
Geographic Coverage of Utility Locator Industry
Utility Locator Industry REPORT HIGHLIGHTS
| Aspects | Details |
|---|---|
| Study Period | 2020-2034 |
| Base Year | 2025 |
| Estimated Year | 2026 |
| Forecast Period | 2026-2034 |
| Historical Period | 2020-2025 |
| Growth Rate | CAGR of 6.28% from 2020-2034 |
| Segmentation |
|
Table of Contents
- 1. Introduction
- 1.1. Research Scope
- 1.2. Market Segmentation
- 1.3. Research Objective
- 1.4. Definitions and Assumptions
- 2. Executive Summary
- 2.1. Market Snapshot
- 3. Market Dynamics
- 3.1. Market Drivers
- 3.2. Market Restrains
- 3.3. Market Trends
- 3.4. Market Opportunities
- 4. Market Factor Analysis
- 4.1. Porters Five Forces
- 4.1.1. Bargaining Power of Suppliers
- 4.1.2. Bargaining Power of Buyers
- 4.1.3. Threat of New Entrants
- 4.1.4. Threat of Substitutes
- 4.1.5. Competitive Rivalry
- 4.2. PESTEL analysis
- 4.3. BCG Analysis
- 4.3.1. Stars (High Growth, High Market Share)
- 4.3.2. Cash Cows (Low Growth, High Market Share)
- 4.3.3. Question Mark (High Growth, Low Market Share)
- 4.3.4. Dogs (Low Growth, Low Market Share)
- 4.4. Ansoff Matrix Analysis
- 4.5. Supply Chain Analysis
- 4.6. Regulatory Landscape
- 4.7. Current Market Potential and Opportunity Assessment (TAM–SAM–SOM Framework)
- 4.8. DMV Analyst Note
- 4.1. Porters Five Forces
- 5. Market Analysis, Insights and Forecast 2021-2033
- 5.1. Market Analysis, Insights and Forecast - by Offering
- 5.1.1. Equipment
- 5.1.2. Services
- 5.2. Market Analysis, Insights and Forecast - by Target
- 5.2.1. Metallic Utilities
- 5.2.2. Non-Metallic Utilities
- 5.3. Market Analysis, Insights and Forecast - by Technique
- 5.3.1. Electromagnetic Field
- 5.3.2. Ground Penetrating Radar
- 5.3.3. Other Techniques
- 5.4. Market Analysis, Insights and Forecast - by Application
- 5.4.1. Oil & Gas
- 5.4.2. Electricity
- 5.4.3. Transportation
- 5.4.4. Water and Sewage
- 5.4.5. Telecommunications
- 5.4.6. Other Applications
- 5.5. Market Analysis, Insights and Forecast - by Region
- 5.5.1. North America
- 5.5.2. Europe
- 5.5.3. Asia
- 5.5.4. Australia and New Zealand
- 5.5.5. Latin America
- 5.5.6. Middle East and Africa
- 5.1. Market Analysis, Insights and Forecast - by Offering
- 6. Global Utility Locator Industry Analysis, Insights and Forecast, 2021-2033
- 6.1. Market Analysis, Insights and Forecast - by Offering
- 6.1.1. Equipment
- 6.1.2. Services
- 6.2. Market Analysis, Insights and Forecast - by Target
- 6.2.1. Metallic Utilities
- 6.2.2. Non-Metallic Utilities
- 6.3. Market Analysis, Insights and Forecast - by Technique
- 6.3.1. Electromagnetic Field
- 6.3.2. Ground Penetrating Radar
- 6.3.3. Other Techniques
- 6.4. Market Analysis, Insights and Forecast - by Application
- 6.4.1. Oil & Gas
- 6.4.2. Electricity
- 6.4.3. Transportation
- 6.4.4. Water and Sewage
- 6.4.5. Telecommunications
- 6.4.6. Other Applications
- 6.1. Market Analysis, Insights and Forecast - by Offering
- 7. North America Utility Locator Industry Analysis, Insights and Forecast, 2020-2032
- 7.1. Market Analysis, Insights and Forecast - by Offering
- 7.1.1. Equipment
- 7.1.2. Services
- 7.2. Market Analysis, Insights and Forecast - by Target
- 7.2.1. Metallic Utilities
- 7.2.2. Non-Metallic Utilities
- 7.3. Market Analysis, Insights and Forecast - by Technique
- 7.3.1. Electromagnetic Field
- 7.3.2. Ground Penetrating Radar
- 7.3.3. Other Techniques
- 7.4. Market Analysis, Insights and Forecast - by Application
- 7.4.1. Oil & Gas
- 7.4.2. Electricity
- 7.4.3. Transportation
- 7.4.4. Water and Sewage
- 7.4.5. Telecommunications
- 7.4.6. Other Applications
- 7.1. Market Analysis, Insights and Forecast - by Offering
- 8. Europe Utility Locator Industry Analysis, Insights and Forecast, 2020-2032
- 8.1. Market Analysis, Insights and Forecast - by Offering
- 8.1.1. Equipment
- 8.1.2. Services
- 8.2. Market Analysis, Insights and Forecast - by Target
- 8.2.1. Metallic Utilities
- 8.2.2. Non-Metallic Utilities
- 8.3. Market Analysis, Insights and Forecast - by Technique
- 8.3.1. Electromagnetic Field
- 8.3.2. Ground Penetrating Radar
- 8.3.3. Other Techniques
- 8.4. Market Analysis, Insights and Forecast - by Application
- 8.4.1. Oil & Gas
- 8.4.2. Electricity
- 8.4.3. Transportation
- 8.4.4. Water and Sewage
- 8.4.5. Telecommunications
- 8.4.6. Other Applications
- 8.1. Market Analysis, Insights and Forecast - by Offering
- 9. Asia Utility Locator Industry Analysis, Insights and Forecast, 2020-2032
- 9.1. Market Analysis, Insights and Forecast - by Offering
- 9.1.1. Equipment
- 9.1.2. Services
- 9.2. Market Analysis, Insights and Forecast - by Target
- 9.2.1. Metallic Utilities
- 9.2.2. Non-Metallic Utilities
- 9.3. Market Analysis, Insights and Forecast - by Technique
- 9.3.1. Electromagnetic Field
- 9.3.2. Ground Penetrating Radar
- 9.3.3. Other Techniques
- 9.4. Market Analysis, Insights and Forecast - by Application
- 9.4.1. Oil & Gas
- 9.4.2. Electricity
- 9.4.3. Transportation
- 9.4.4. Water and Sewage
- 9.4.5. Telecommunications
- 9.4.6. Other Applications
- 9.1. Market Analysis, Insights and Forecast - by Offering
- 10. Australia and New Zealand Utility Locator Industry Analysis, Insights and Forecast, 2020-2032
- 10.1. Market Analysis, Insights and Forecast - by Offering
- 10.1.1. Equipment
- 10.1.2. Services
- 10.2. Market Analysis, Insights and Forecast - by Target
- 10.2.1. Metallic Utilities
- 10.2.2. Non-Metallic Utilities
- 10.3. Market Analysis, Insights and Forecast - by Technique
- 10.3.1. Electromagnetic Field
- 10.3.2. Ground Penetrating Radar
- 10.3.3. Other Techniques
- 10.4. Market Analysis, Insights and Forecast - by Application
- 10.4.1. Oil & Gas
- 10.4.2. Electricity
- 10.4.3. Transportation
- 10.4.4. Water and Sewage
- 10.4.5. Telecommunications
- 10.4.6. Other Applications
- 10.1. Market Analysis, Insights and Forecast - by Offering
- 11. Latin America Utility Locator Industry Analysis, Insights and Forecast, 2020-2032
- 11.1. Market Analysis, Insights and Forecast - by Offering
- 11.1.1. Equipment
- 11.1.2. Services
- 11.2. Market Analysis, Insights and Forecast - by Target
- 11.2.1. Metallic Utilities
- 11.2.2. Non-Metallic Utilities
- 11.3. Market Analysis, Insights and Forecast - by Technique
- 11.3.1. Electromagnetic Field
- 11.3.2. Ground Penetrating Radar
- 11.3.3. Other Techniques
- 11.4. Market Analysis, Insights and Forecast - by Application
- 11.4.1. Oil & Gas
- 11.4.2. Electricity
- 11.4.3. Transportation
- 11.4.4. Water and Sewage
- 11.4.5. Telecommunications
- 11.4.6. Other Applications
- 11.1. Market Analysis, Insights and Forecast - by Offering
- 12. Middle East and Africa Utility Locator Industry Analysis, Insights and Forecast, 2020-2032
- 12.1. Market Analysis, Insights and Forecast - by Offering
- 12.1.1. Equipment
- 12.1.2. Services
- 12.2. Market Analysis, Insights and Forecast - by Target
- 12.2.1. Metallic Utilities
- 12.2.2. Non-Metallic Utilities
- 12.3. Market Analysis, Insights and Forecast - by Technique
- 12.3.1. Electromagnetic Field
- 12.3.2. Ground Penetrating Radar
- 12.3.3. Other Techniques
- 12.4. Market Analysis, Insights and Forecast - by Application
- 12.4.1. Oil & Gas
- 12.4.2. Electricity
- 12.4.3. Transportation
- 12.4.4. Water and Sewage
- 12.4.5. Telecommunications
- 12.4.6. Other Applications
- 12.1. Market Analysis, Insights and Forecast - by Offering
- 13. Competitive Analysis
- 13.1. Company Profiles
- 13.1.1 ProStar Geocorp
- 13.1.1.1. Company Overview
- 13.1.1.2. Products
- 13.1.1.3. Company Financials
- 13.1.1.4. SWOT Analysis
- 13.1.2 Vivax-Metrotech
- 13.1.2.1. Company Overview
- 13.1.2.2. Products
- 13.1.2.3. Company Financials
- 13.1.2.4. SWOT Analysis
- 13.1.3 Leica Geosystem
- 13.1.3.1. Company Overview
- 13.1.3.2. Products
- 13.1.3.3. Company Financials
- 13.1.3.4. SWOT Analysis
- 13.1.4 Ridge Tool Company
- 13.1.4.1. Company Overview
- 13.1.4.2. Products
- 13.1.4.3. Company Financials
- 13.1.4.4. SWOT Analysis
- 13.1.5 Guideline Geo
- 13.1.5.1. Company Overview
- 13.1.5.2. Products
- 13.1.5.3. Company Financials
- 13.1.5.4. SWOT Analysis
- 13.1.6 Irth Solutions
- 13.1.6.1. Company Overview
- 13.1.6.2. Products
- 13.1.6.3. Company Financials
- 13.1.6.4. SWOT Analysis
- 13.1.7 Sensors & Software Inc
- 13.1.7.1. Company Overview
- 13.1.7.2. Products
- 13.1.7.3. Company Financials
- 13.1.7.4. SWOT Analysis
- 13.1.8 Subsite Electronics (Charles Machine Works)
- 13.1.8.1. Company Overview
- 13.1.8.2. Products
- 13.1.8.3. Company Financials
- 13.1.8.4. SWOT Analysis
- 13.1.9 Emerson Electric
- 13.1.9.1. Company Overview
- 13.1.9.2. Products
- 13.1.9.3. Company Financials
- 13.1.9.4. SWOT Analysis
- 13.1.10 Geophysical Survey Systems Inc
- 13.1.10.1. Company Overview
- 13.1.10.2. Products
- 13.1.10.3. Company Financials
- 13.1.10.4. SWOT Analysis
- 13.1.11 Radiodetection Ltd
- 13.1.11.1. Company Overview
- 13.1.11.2. Products
- 13.1.11.3. Company Financials
- 13.1.11.4. SWOT Analysis
- 13.1.12 Honeywell International Inc *List Not Exhaustive
- 13.1.12.1. Company Overview
- 13.1.12.2. Products
- 13.1.12.3. Company Financials
- 13.1.12.4. SWOT Analysis
- 13.1.1 ProStar Geocorp
- 13.2. Market Entropy
- 13.2.1 Company's Key Areas Served
- 13.2.2 Recent Developments
- 13.3. Company Market Share Analysis 2025
- 13.3.1 Top 5 Companies Market Share Analysis
- 13.3.2 Top 3 Companies Market Share Analysis
- 13.4. List of Potential Customers
- 14. Research Methodology
List of Figures
- Figure 1: Global Utility Locator Industry Revenue Breakdown (million, %) by Region 2025 & 2033
- Figure 2: North America Utility Locator Industry Revenue (million), by Offering 2025 & 2033
- Figure 3: North America Utility Locator Industry Revenue Share (%), by Offering 2025 & 2033
- Figure 4: North America Utility Locator Industry Revenue (million), by Target 2025 & 2033
- Figure 5: North America Utility Locator Industry Revenue Share (%), by Target 2025 & 2033
- Figure 6: North America Utility Locator Industry Revenue (million), by Technique 2025 & 2033
- Figure 7: North America Utility Locator Industry Revenue Share (%), by Technique 2025 & 2033
- Figure 8: North America Utility Locator Industry Revenue (million), by Application 2025 & 2033
- Figure 9: North America Utility Locator Industry Revenue Share (%), by Application 2025 & 2033
- Figure 10: North America Utility Locator Industry Revenue (million), by Country 2025 & 2033
- Figure 11: North America Utility Locator Industry Revenue Share (%), by Country 2025 & 2033
- Figure 12: Europe Utility Locator Industry Revenue (million), by Offering 2025 & 2033
- Figure 13: Europe Utility Locator Industry Revenue Share (%), by Offering 2025 & 2033
- Figure 14: Europe Utility Locator Industry Revenue (million), by Target 2025 & 2033
- Figure 15: Europe Utility Locator Industry Revenue Share (%), by Target 2025 & 2033
- Figure 16: Europe Utility Locator Industry Revenue (million), by Technique 2025 & 2033
- Figure 17: Europe Utility Locator Industry Revenue Share (%), by Technique 2025 & 2033
- Figure 18: Europe Utility Locator Industry Revenue (million), by Application 2025 & 2033
- Figure 19: Europe Utility Locator Industry Revenue Share (%), by Application 2025 & 2033
- Figure 20: Europe Utility Locator Industry Revenue (million), by Country 2025 & 2033
- Figure 21: Europe Utility Locator Industry Revenue Share (%), by Country 2025 & 2033
- Figure 22: Asia Utility Locator Industry Revenue (million), by Offering 2025 & 2033
- Figure 23: Asia Utility Locator Industry Revenue Share (%), by Offering 2025 & 2033
- Figure 24: Asia Utility Locator Industry Revenue (million), by Target 2025 & 2033
- Figure 25: Asia Utility Locator Industry Revenue Share (%), by Target 2025 & 2033
- Figure 26: Asia Utility Locator Industry Revenue (million), by Technique 2025 & 2033
- Figure 27: Asia Utility Locator Industry Revenue Share (%), by Technique 2025 & 2033
- Figure 28: Asia Utility Locator Industry Revenue (million), by Application 2025 & 2033
- Figure 29: Asia Utility Locator Industry Revenue Share (%), by Application 2025 & 2033
- Figure 30: Asia Utility Locator Industry Revenue (million), by Country 2025 & 2033
- Figure 31: Asia Utility Locator Industry Revenue Share (%), by Country 2025 & 2033
- Figure 32: Australia and New Zealand Utility Locator Industry Revenue (million), by Offering 2025 & 2033
- Figure 33: Australia and New Zealand Utility Locator Industry Revenue Share (%), by Offering 2025 & 2033
- Figure 34: Australia and New Zealand Utility Locator Industry Revenue (million), by Target 2025 & 2033
- Figure 35: Australia and New Zealand Utility Locator Industry Revenue Share (%), by Target 2025 & 2033
- Figure 36: Australia and New Zealand Utility Locator Industry Revenue (million), by Technique 2025 & 2033
- Figure 37: Australia and New Zealand Utility Locator Industry Revenue Share (%), by Technique 2025 & 2033
- Figure 38: Australia and New Zealand Utility Locator Industry Revenue (million), by Application 2025 & 2033
- Figure 39: Australia and New Zealand Utility Locator Industry Revenue Share (%), by Application 2025 & 2033
- Figure 40: Australia and New Zealand Utility Locator Industry Revenue (million), by Country 2025 & 2033
- Figure 41: Australia and New Zealand Utility Locator Industry Revenue Share (%), by Country 2025 & 2033
- Figure 42: Latin America Utility Locator Industry Revenue (million), by Offering 2025 & 2033
- Figure 43: Latin America Utility Locator Industry Revenue Share (%), by Offering 2025 & 2033
- Figure 44: Latin America Utility Locator Industry Revenue (million), by Target 2025 & 2033
- Figure 45: Latin America Utility Locator Industry Revenue Share (%), by Target 2025 & 2033
- Figure 46: Latin America Utility Locator Industry Revenue (million), by Technique 2025 & 2033
- Figure 47: Latin America Utility Locator Industry Revenue Share (%), by Technique 2025 & 2033
- Figure 48: Latin America Utility Locator Industry Revenue (million), by Application 2025 & 2033
- Figure 49: Latin America Utility Locator Industry Revenue Share (%), by Application 2025 & 2033
- Figure 50: Latin America Utility Locator Industry Revenue (million), by Country 2025 & 2033
- Figure 51: Latin America Utility Locator Industry Revenue Share (%), by Country 2025 & 2033
- Figure 52: Middle East and Africa Utility Locator Industry Revenue (million), by Offering 2025 & 2033
- Figure 53: Middle East and Africa Utility Locator Industry Revenue Share (%), by Offering 2025 & 2033
- Figure 54: Middle East and Africa Utility Locator Industry Revenue (million), by Target 2025 & 2033
- Figure 55: Middle East and Africa Utility Locator Industry Revenue Share (%), by Target 2025 & 2033
- Figure 56: Middle East and Africa Utility Locator Industry Revenue (million), by Technique 2025 & 2033
- Figure 57: Middle East and Africa Utility Locator Industry Revenue Share (%), by Technique 2025 & 2033
- Figure 58: Middle East and Africa Utility Locator Industry Revenue (million), by Application 2025 & 2033
- Figure 59: Middle East and Africa Utility Locator Industry Revenue Share (%), by Application 2025 & 2033
- Figure 60: Middle East and Africa Utility Locator Industry Revenue (million), by Country 2025 & 2033
- Figure 61: Middle East and Africa Utility Locator Industry Revenue Share (%), by Country 2025 & 2033
List of Tables
- Table 1: Global Utility Locator Industry Revenue million Forecast, by Offering 2020 & 2033
- Table 2: Global Utility Locator Industry Revenue million Forecast, by Target 2020 & 2033
- Table 3: Global Utility Locator Industry Revenue million Forecast, by Technique 2020 & 2033
- Table 4: Global Utility Locator Industry Revenue million Forecast, by Application 2020 & 2033
- Table 5: Global Utility Locator Industry Revenue million Forecast, by Region 2020 & 2033
- Table 6: Global Utility Locator Industry Revenue million Forecast, by Offering 2020 & 2033
- Table 7: Global Utility Locator Industry Revenue million Forecast, by Target 2020 & 2033
- Table 8: Global Utility Locator Industry Revenue million Forecast, by Technique 2020 & 2033
- Table 9: Global Utility Locator Industry Revenue million Forecast, by Application 2020 & 2033
- Table 10: Global Utility Locator Industry Revenue million Forecast, by Country 2020 & 2033
- Table 11: Global Utility Locator Industry Revenue million Forecast, by Offering 2020 & 2033
- Table 12: Global Utility Locator Industry Revenue million Forecast, by Target 2020 & 2033
- Table 13: Global Utility Locator Industry Revenue million Forecast, by Technique 2020 & 2033
- Table 14: Global Utility Locator Industry Revenue million Forecast, by Application 2020 & 2033
- Table 15: Global Utility Locator Industry Revenue million Forecast, by Country 2020 & 2033
- Table 16: Global Utility Locator Industry Revenue million Forecast, by Offering 2020 & 2033
- Table 17: Global Utility Locator Industry Revenue million Forecast, by Target 2020 & 2033
- Table 18: Global Utility Locator Industry Revenue million Forecast, by Technique 2020 & 2033
- Table 19: Global Utility Locator Industry Revenue million Forecast, by Application 2020 & 2033
- Table 20: Global Utility Locator Industry Revenue million Forecast, by Country 2020 & 2033
- Table 21: Global Utility Locator Industry Revenue million Forecast, by Offering 2020 & 2033
- Table 22: Global Utility Locator Industry Revenue million Forecast, by Target 2020 & 2033
- Table 23: Global Utility Locator Industry Revenue million Forecast, by Technique 2020 & 2033
- Table 24: Global Utility Locator Industry Revenue million Forecast, by Application 2020 & 2033
- Table 25: Global Utility Locator Industry Revenue million Forecast, by Country 2020 & 2033
- Table 26: Global Utility Locator Industry Revenue million Forecast, by Offering 2020 & 2033
- Table 27: Global Utility Locator Industry Revenue million Forecast, by Target 2020 & 2033
- Table 28: Global Utility Locator Industry Revenue million Forecast, by Technique 2020 & 2033
- Table 29: Global Utility Locator Industry Revenue million Forecast, by Application 2020 & 2033
- Table 30: Global Utility Locator Industry Revenue million Forecast, by Country 2020 & 2033
- Table 31: Global Utility Locator Industry Revenue million Forecast, by Offering 2020 & 2033
- Table 32: Global Utility Locator Industry Revenue million Forecast, by Target 2020 & 2033
- Table 33: Global Utility Locator Industry Revenue million Forecast, by Technique 2020 & 2033
- Table 34: Global Utility Locator Industry Revenue million Forecast, by Application 2020 & 2033
- Table 35: Global Utility Locator Industry Revenue million Forecast, by Country 2020 & 2033
Frequently Asked Questions
1. What is the projected Compound Annual Growth Rate (CAGR) of the Utility Locator Industry?
The projected CAGR is approximately 6.28%.
2. Which companies are prominent players in the Utility Locator Industry?
Key companies in the market include ProStar Geocorp, Vivax-Metrotech, Leica Geosystem, Ridge Tool Company, Guideline Geo, Irth Solutions, Sensors & Software Inc, Subsite Electronics (Charles Machine Works), Emerson Electric, Geophysical Survey Systems Inc, Radiodetection Ltd, Honeywell International Inc *List Not Exhaustive.
3. What are the main segments of the Utility Locator Industry?
The market segments include Offering, Target, Technique, Application.
4. Can you provide details about the market size?
The market size is estimated to be USD 913.78 million as of 2022.
5. What are some drivers contributing to market growth?
Rising Demand for Real-Time Detection Tools for Underground Utilities; Increase Investment for Inspection of Deteriorating Infrastructure.
6. What are the notable trends driving market growth?
Transportation Sector to Hold Significant Market Share.
7. Are there any restraints impacting market growth?
Combining Data from Multiple Data Sources.
8. Can you provide examples of recent developments in the market?
September 2022: 2M partnered with Prostar Holdings Inc. to adopt Prostar's PointMan mobile application solution to enhance their utility mapping operations. Realizing lives depended on knowing where utilities are buried, 2M is committed to finding utilities with attention to detail on every project. PointMan proved to be a key differentiator in the market and continues to help companies like 2M provide value-added services to their clients.
9. What pricing options are available for accessing the report?
Pricing options include single-user, multi-user, and enterprise licenses priced at USD 4750, USD 5250, and USD 8750 respectively.
10. Is the market size provided in terms of value or volume?
The market size is provided in terms of value, measured in million.
11. Are there any specific market keywords associated with the report?
Yes, the market keyword associated with the report is "Utility Locator Industry," which aids in identifying and referencing the specific market segment covered.
12. How do I determine which pricing option suits my needs best?
The pricing options vary based on user requirements and access needs. Individual users may opt for single-user licenses, while businesses requiring broader access may choose multi-user or enterprise licenses for cost-effective access to the report.
13. Are there any additional resources or data provided in the Utility Locator Industry report?
While the report offers comprehensive insights, it's advisable to review the specific contents or supplementary materials provided to ascertain if additional resources or data are available.
14. How can I stay updated on further developments or reports in the Utility Locator Industry?
To stay informed about further developments, trends, and reports in the Utility Locator Industry, consider subscribing to industry newsletters, following relevant companies and organizations, or regularly checking reputable industry news sources and publications.
Methodology
Step 1 - Identification of Relevant Samples Size from Population Database


Step 2 - Approaches for Defining Global Market Size (Value, Volume* & Price*)

Note*: In applicable scenarios
Step 3 - Data Sources
Primary Research
- Web Analytics
- Survey Reports
- Research Institute
- Latest Research Reports
- Opinion Leaders
Secondary Research
- Annual Reports
- White Paper
- Latest Press Release
- Industry Association
- Paid Database
- Investor Presentations

Step 4 - Data Triangulation
Involves using different sources of information in order to increase the validity of a study
These sources are likely to be stakeholders in a program - participants, other researchers, program staff, other community members, and so on.
Then we put all data in single framework & apply various statistical tools to find out the dynamic on the market.
During the analysis stage, feedback from the stakeholder groups would be compared to determine areas of agreement as well as areas of divergence