

Key Insights
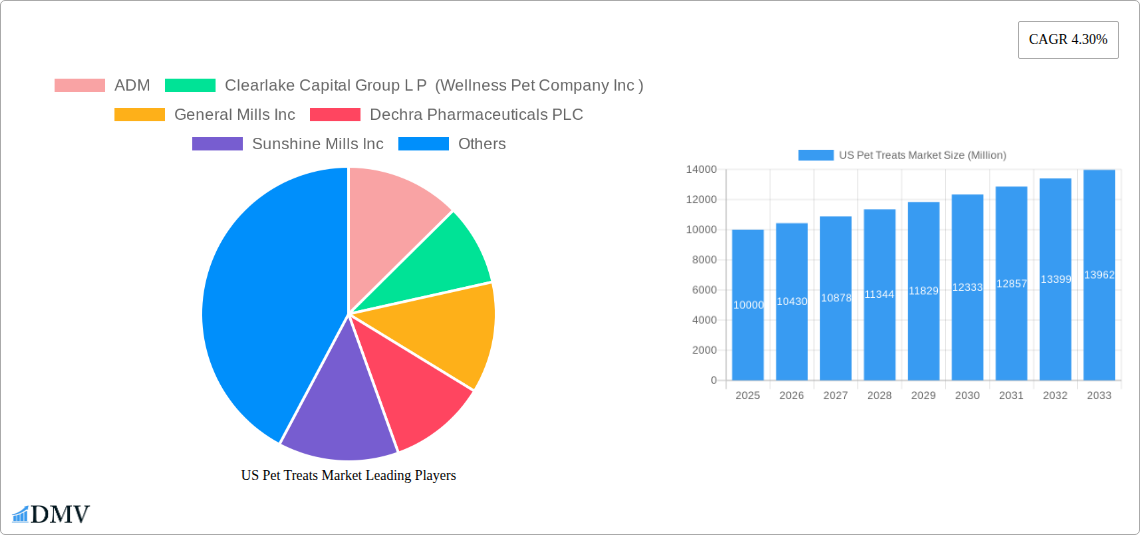
The US pet treats market, valued at $5.1 billion in 2025, is poised for significant expansion, projected to grow at a Compound Annual Growth Rate (CAGR) of 4.8% from 2025 to 2033. This growth is propelled by the increasing humanization of pets and rising pet ownership, driving demand for premium, specialized, and health-conscious treats. Consumers are prioritizing natural, functional options aligned with human wellness trends. The market is segmented by distribution channel (convenience stores, online, specialty, supermarkets/hypermarkets), product type (crunchy, dental, freeze-dried/jerky, soft & chewy), and pet type (dogs, cats). Dogs and cats dominate pet ownership, with dog treats holding a larger market share. Online channels are rapidly expanding due to convenience and e-commerce reach. Key industry players, including ADM, General Mills, Nestle Purina, and Mars Incorporated, are actively pursuing innovation and market expansion.
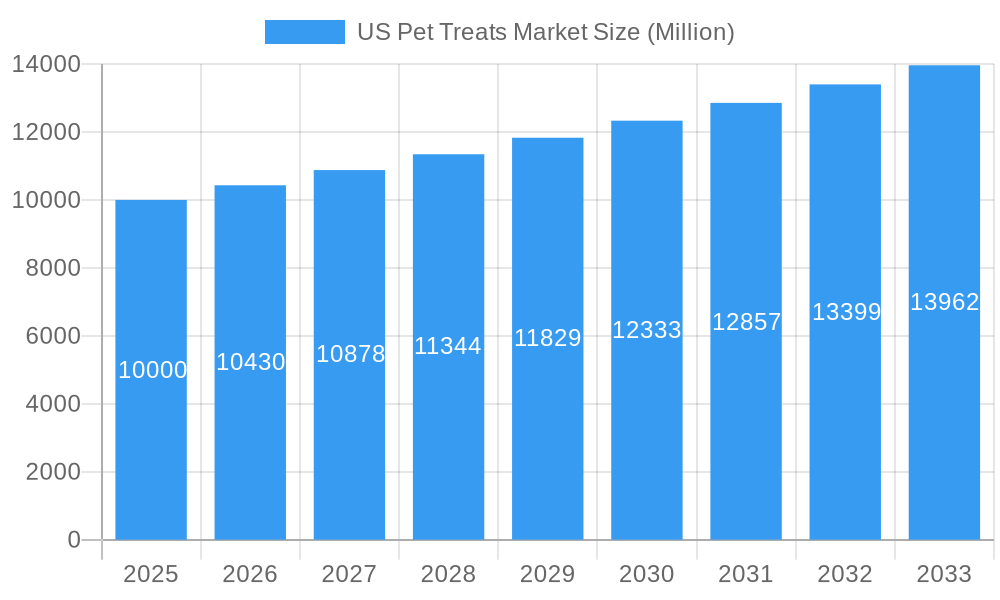
US Pet Treats Market Market Size (In Billion)
Regional market dynamics within the US vary, with the Northeast and West Coast likely representing larger segments due to higher disposable incomes and pet ownership rates compared to the Midwest and South. The competitive landscape features a blend of large corporations and niche brands, fostering product diversification. Market restraints include fluctuating raw material costs and evolving pet food safety regulations. Nevertheless, the overall outlook is positive, driven by consumer spending on premium pet products and the strong human-animal bond. The forecast anticipates substantial market growth beyond 2033, making the US pet treats market an attractive sector for both established companies and new entrants.
US Pet Treats Market Company Market Share
This report offers a comprehensive analysis of the US pet treats market, detailing its current status, future projections, and key participants. Covering a study period from 2019-2033, with a base year of 2025, this research is an essential resource for stakeholders aiming to understand and leverage opportunities within this dynamic market. The market size is estimated at $5.1 billion in 2025 and is projected to exceed $7.5 billion by 2033, reflecting a robust CAGR.
US Pet Treats Market Composition & Trends
This section delves into the intricate structure of the US pet treats market, analyzing key aspects that shape its evolution. We dissect market concentration, revealing the dominance of major players like Mars Incorporated and Nestle (Purina), and explore the innovative forces driving product development. The report also examines the regulatory landscape, identifying potential hurdles and opportunities, and analyzes substitute products impacting market share. Finally, we provide a detailed account of mergers and acquisitions (M&A) activity, highlighting significant deals and their implications for market consolidation.
- Market Concentration: The US pet treats market is moderately concentrated, with a few dominant players holding significant market share. The top 5 players collectively hold approximately xx% of the market.
- Innovation Catalysts: Growing consumer demand for premium, functional treats (e.g., dental treats, freeze-dried options) fuels innovation. Natural, organic, and grain-free options are gaining traction.
- Regulatory Landscape: The FDA's role in regulating pet food and treat safety is paramount. Compliance with regulations is crucial for manufacturers.
- Substitute Products: Human-grade snacks pose a competitive threat, particularly for premium segments.
- End-User Profiles: The report profiles key consumer segments based on pet ownership, spending habits, and preferences (e.g., millennials, pet owners with multiple pets).
- M&A Activity: Recent M&A activity, such as Nestle SA's acquisition of Red Collar Pet Foods in February 2023 (estimated value: xx Million), points towards market consolidation and expansion strategies. The total M&A deal value in the last 5 years is estimated at xx Million.
US Pet Treats Market Industry Evolution
This section meticulously traces the historical evolution of the US pet treats market (2019-2024) and projects its future growth (2025-2033). We analyze the impact of technological advancements such as improved manufacturing processes and packaging, and we assess shifting consumer demands, such as increased preference for natural and functional ingredients. The report incorporates growth rates based on historical and projected data, providing actionable insights for informed decision-making. The market's trajectory reflects a growing trend of pet humanization and increased pet ownership. Growth is driven by a combination of factors, including rising disposable incomes, increased pet adoption, and the growing availability of convenient online channels for purchasing pet treats. Technological innovations in treat formulations and packaging also contribute to the growth, alongside the increasing demand for premium treats. Specific data points on growth rates are detailed throughout the report, incorporating adoption metrics for new product types, such as freeze-dried treats, which show significant year-on-year growth in the range of xx%.
Leading Regions, Countries, or Segments in US Pet Treats Market
This section identifies the dominant regions, countries, and segments within the US pet treats market. Key drivers of dominance, such as investment trends, regulatory support, and consumer preferences, are analyzed using a combination of in-depth paragraphs and concise bullet points.
- Distribution Channels: Supermarkets/Hypermarkets currently dominate the distribution channels, followed by specialty stores and the rapidly growing online channel.
- Sub-Products: Soft & Chewy treats hold the largest market share, with Crunchy and Dental treats also showing significant growth. Freeze-dried and Jerky treats represent a premium, fast-growing segment.
- Pets: Dogs account for the majority of the market, followed by cats. The "other pets" segment is experiencing slower but steady growth.
Key Drivers (Examples):
- Supermarkets/Hypermarkets: High consumer traffic, established distribution networks, and convenient location drive dominance.
- Soft & Chewy Treats: Palatability and ease of consumption for pets of all ages contribute to this segment's large market share.
- Online Channel: Growing e-commerce penetration, convenience, and broader product variety fuel rapid growth in this segment.
US Pet Treats Market Product Innovations
Recent innovations in the US pet treats market are focused on enhancing palatability, improving nutritional value, and addressing specific health needs. New product formulations incorporate natural ingredients, functional additives (e.g., probiotics, joint support supplements), and innovative textures and shapes. Unique selling propositions leverage these characteristics to attract discerning pet owners. Technological advancements in manufacturing processes have enabled better quality control and more efficient production.
Propelling Factors for US Pet Treats Market Growth
Several factors are driving growth in the US pet treats market. The increasing humanization of pets is a major factor, with pet owners viewing their animals as family members and thus willing to spend more on premium treats. Rising disposable incomes enable pet owners to afford higher-priced treats, and innovative product offerings such as functional treats and natural, organic options are fueling market expansion. Favorable regulatory environments also support the market’s growth.
Obstacles in the US Pet Treats Market Market
The US pet treats market faces challenges such as fluctuating raw material prices, leading to increased production costs and potential price hikes. Supply chain disruptions can impact product availability and lead to inventory shortages. Intense competition among established players and the emergence of new brands add pressure on profit margins. Maintaining compliance with ever-evolving regulatory standards also presents an ongoing challenge.
Future Opportunities in US Pet Treats Market
Future opportunities reside in the expansion of functional treats targeting specific health needs (e.g., weight management, dental health), the growing demand for sustainable and eco-friendly treats, and the rise of personalized nutrition tailored to individual pets' needs. Technological advancements in manufacturing and packaging can improve efficiency and reduce costs.
Major Players in the US Pet Treats Market Ecosystem
- ADM
- Clearlake Capital Group L P (Wellness Pet Company Inc)
- General Mills Inc
- Dechra Pharmaceuticals PLC
- Sunshine Mills Inc
- Mars Incorporated
- Nestle (Purina)
- Colgate-Palmolive Company (Hill's Pet Nutrition Inc)
- Virba
- The J M Smucker Company
Key Developments in US Pet Treats Market Industry
- February 2023: Nestle SA acquired the US pet treats factory from investor-backed local supplier Red Collar Pet Foods, aiming to expand its pet food business in North America.
- March 2023: Temptations (Mars Incorporated) launched Temptation Tender Fills treats and two new flavors of Temptations Creamy Purrrr-ee treats.
- May 2023: Nestle Purina launched new Friskies Playfuls cat treats in chicken & liver and salmon & shrimp flavors.
Strategic US Pet Treats Market Market Forecast
The US pet treats market is poised for continued growth, driven by the increasing humanization of pets, the rising demand for premium and functional treats, and the expansion of e-commerce channels. Innovation in product formulations and the development of sustainable and eco-friendly options will play a vital role in shaping the market's future trajectory. The market's potential for expansion is significant, with opportunities for both established players and new entrants.
US Pet Treats Market Segmentation
-
1. Sub Product
- 1.1. Crunchy Treats
- 1.2. Dental Treats
- 1.3. Freeze-dried and Jerky Treats
- 1.4. Soft & Chewy Treats
- 1.5. Other Treats
-
2. Pets
- 2.1. Cats
- 2.2. Dogs
- 2.3. Other Pets
-
3. Distribution Channel
- 3.1. Convenience Stores
- 3.2. Online Channel
- 3.3. Specialty Stores
- 3.4. Supermarkets/Hypermarkets
- 3.5. Other Channels
US Pet Treats Market Segmentation By Geography
-
1. North America
- 1.1. United States
- 1.2. Canada
- 1.3. Mexico
-
2. South America
- 2.1. Brazil
- 2.2. Argentina
- 2.3. Rest of South America
-
3. Europe
- 3.1. United Kingdom
- 3.2. Germany
- 3.3. France
- 3.4. Italy
- 3.5. Spain
- 3.6. Russia
- 3.7. Benelux
- 3.8. Nordics
- 3.9. Rest of Europe
-
4. Middle East & Africa
- 4.1. Turkey
- 4.2. Israel
- 4.3. GCC
- 4.4. North Africa
- 4.5. South Africa
- 4.6. Rest of Middle East & Africa
-
5. Asia Pacific
- 5.1. China
- 5.2. India
- 5.3. Japan
- 5.4. South Korea
- 5.5. ASEAN
- 5.6. Oceania
- 5.7. Rest of Asia Pacific
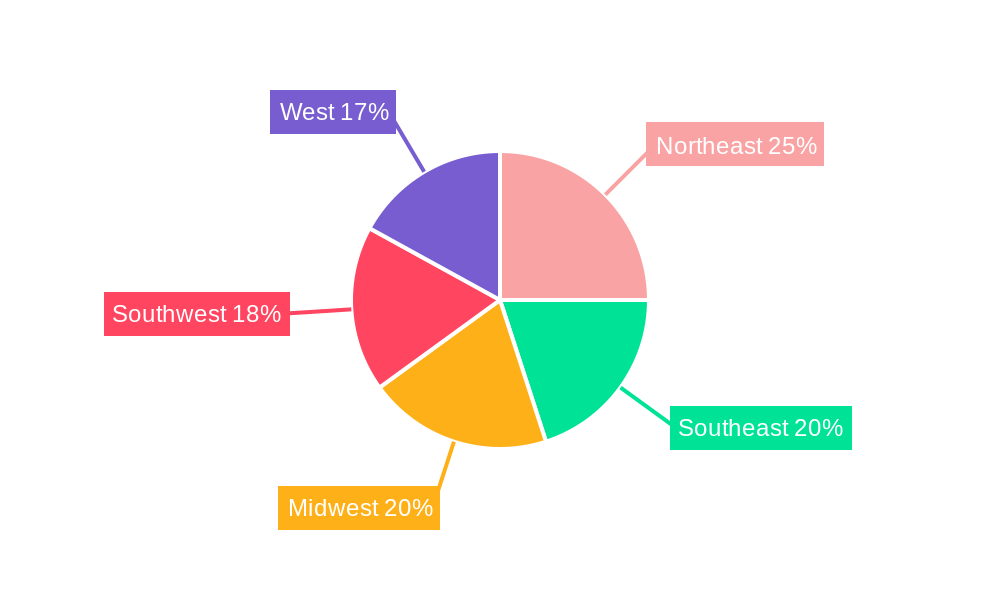
US Pet Treats Market Regional Market Share
Geographic Coverage of US Pet Treats Market
US Pet Treats Market REPORT HIGHLIGHTS
| Aspects | Details |
|---|---|
| Study Period | 2020-2034 |
| Base Year | 2025 |
| Estimated Year | 2026 |
| Forecast Period | 2026-2034 |
| Historical Period | 2020-2025 |
| Growth Rate | CAGR of 4.8% from 2020-2034 |
| Segmentation |
|
Table of Contents
- 1. Introduction
- 1.1. Research Scope
- 1.2. Market Segmentation
- 1.3. Research Objective
- 1.4. Definitions and Assumptions
- 2. Executive Summary
- 2.1. Market Snapshot
- 3. Market Dynamics
- 3.1. Market Drivers
- 3.2. Market Restrains
- 3.3. Market Trends
- 3.4. Market Opportunities
- 4. Market Factor Analysis
- 4.1. Porters Five Forces
- 4.1.1. Bargaining Power of Suppliers
- 4.1.2. Bargaining Power of Buyers
- 4.1.3. Threat of New Entrants
- 4.1.4. Threat of Substitutes
- 4.1.5. Competitive Rivalry
- 4.2. PESTEL analysis
- 4.3. BCG Analysis
- 4.3.1. Stars (High Growth, High Market Share)
- 4.3.2. Cash Cows (Low Growth, High Market Share)
- 4.3.3. Question Mark (High Growth, Low Market Share)
- 4.3.4. Dogs (Low Growth, Low Market Share)
- 4.4. Ansoff Matrix Analysis
- 4.5. Supply Chain Analysis
- 4.6. Regulatory Landscape
- 4.7. Current Market Potential and Opportunity Assessment (TAM–SAM–SOM Framework)
- 4.8. DMV Analyst Note
- 4.1. Porters Five Forces
- 5. Market Analysis, Insights and Forecast 2021-2033
- 5.1. Market Analysis, Insights and Forecast - by Sub Product
- 5.1.1. Crunchy Treats
- 5.1.2. Dental Treats
- 5.1.3. Freeze-dried and Jerky Treats
- 5.1.4. Soft & Chewy Treats
- 5.1.5. Other Treats
- 5.2. Market Analysis, Insights and Forecast - by Pets
- 5.2.1. Cats
- 5.2.2. Dogs
- 5.2.3. Other Pets
- 5.3. Market Analysis, Insights and Forecast - by Distribution Channel
- 5.3.1. Convenience Stores
- 5.3.2. Online Channel
- 5.3.3. Specialty Stores
- 5.3.4. Supermarkets/Hypermarkets
- 5.3.5. Other Channels
- 5.4. Market Analysis, Insights and Forecast - by Region
- 5.4.1. North America
- 5.4.2. South America
- 5.4.3. Europe
- 5.4.4. Middle East & Africa
- 5.4.5. Asia Pacific
- 5.1. Market Analysis, Insights and Forecast - by Sub Product
- 6. Global US Pet Treats Market Analysis, Insights and Forecast, 2021-2033
- 6.1. Market Analysis, Insights and Forecast - by Sub Product
- 6.1.1. Crunchy Treats
- 6.1.2. Dental Treats
- 6.1.3. Freeze-dried and Jerky Treats
- 6.1.4. Soft & Chewy Treats
- 6.1.5. Other Treats
- 6.2. Market Analysis, Insights and Forecast - by Pets
- 6.2.1. Cats
- 6.2.2. Dogs
- 6.2.3. Other Pets
- 6.3. Market Analysis, Insights and Forecast - by Distribution Channel
- 6.3.1. Convenience Stores
- 6.3.2. Online Channel
- 6.3.3. Specialty Stores
- 6.3.4. Supermarkets/Hypermarkets
- 6.3.5. Other Channels
- 6.1. Market Analysis, Insights and Forecast - by Sub Product
- 7. North America US Pet Treats Market Analysis, Insights and Forecast, 2020-2032
- 7.1. Market Analysis, Insights and Forecast - by Sub Product
- 7.1.1. Crunchy Treats
- 7.1.2. Dental Treats
- 7.1.3. Freeze-dried and Jerky Treats
- 7.1.4. Soft & Chewy Treats
- 7.1.5. Other Treats
- 7.2. Market Analysis, Insights and Forecast - by Pets
- 7.2.1. Cats
- 7.2.2. Dogs
- 7.2.3. Other Pets
- 7.3. Market Analysis, Insights and Forecast - by Distribution Channel
- 7.3.1. Convenience Stores
- 7.3.2. Online Channel
- 7.3.3. Specialty Stores
- 7.3.4. Supermarkets/Hypermarkets
- 7.3.5. Other Channels
- 7.1. Market Analysis, Insights and Forecast - by Sub Product
- 8. South America US Pet Treats Market Analysis, Insights and Forecast, 2020-2032
- 8.1. Market Analysis, Insights and Forecast - by Sub Product
- 8.1.1. Crunchy Treats
- 8.1.2. Dental Treats
- 8.1.3. Freeze-dried and Jerky Treats
- 8.1.4. Soft & Chewy Treats
- 8.1.5. Other Treats
- 8.2. Market Analysis, Insights and Forecast - by Pets
- 8.2.1. Cats
- 8.2.2. Dogs
- 8.2.3. Other Pets
- 8.3. Market Analysis, Insights and Forecast - by Distribution Channel
- 8.3.1. Convenience Stores
- 8.3.2. Online Channel
- 8.3.3. Specialty Stores
- 8.3.4. Supermarkets/Hypermarkets
- 8.3.5. Other Channels
- 8.1. Market Analysis, Insights and Forecast - by Sub Product
- 9. Europe US Pet Treats Market Analysis, Insights and Forecast, 2020-2032
- 9.1. Market Analysis, Insights and Forecast - by Sub Product
- 9.1.1. Crunchy Treats
- 9.1.2. Dental Treats
- 9.1.3. Freeze-dried and Jerky Treats
- 9.1.4. Soft & Chewy Treats
- 9.1.5. Other Treats
- 9.2. Market Analysis, Insights and Forecast - by Pets
- 9.2.1. Cats
- 9.2.2. Dogs
- 9.2.3. Other Pets
- 9.3. Market Analysis, Insights and Forecast - by Distribution Channel
- 9.3.1. Convenience Stores
- 9.3.2. Online Channel
- 9.3.3. Specialty Stores
- 9.3.4. Supermarkets/Hypermarkets
- 9.3.5. Other Channels
- 9.1. Market Analysis, Insights and Forecast - by Sub Product
- 10. Middle East & Africa US Pet Treats Market Analysis, Insights and Forecast, 2020-2032
- 10.1. Market Analysis, Insights and Forecast - by Sub Product
- 10.1.1. Crunchy Treats
- 10.1.2. Dental Treats
- 10.1.3. Freeze-dried and Jerky Treats
- 10.1.4. Soft & Chewy Treats
- 10.1.5. Other Treats
- 10.2. Market Analysis, Insights and Forecast - by Pets
- 10.2.1. Cats
- 10.2.2. Dogs
- 10.2.3. Other Pets
- 10.3. Market Analysis, Insights and Forecast - by Distribution Channel
- 10.3.1. Convenience Stores
- 10.3.2. Online Channel
- 10.3.3. Specialty Stores
- 10.3.4. Supermarkets/Hypermarkets
- 10.3.5. Other Channels
- 10.1. Market Analysis, Insights and Forecast - by Sub Product
- 11. Asia Pacific US Pet Treats Market Analysis, Insights and Forecast, 2020-2032
- 11.1. Market Analysis, Insights and Forecast - by Sub Product
- 11.1.1. Crunchy Treats
- 11.1.2. Dental Treats
- 11.1.3. Freeze-dried and Jerky Treats
- 11.1.4. Soft & Chewy Treats
- 11.1.5. Other Treats
- 11.2. Market Analysis, Insights and Forecast - by Pets
- 11.2.1. Cats
- 11.2.2. Dogs
- 11.2.3. Other Pets
- 11.3. Market Analysis, Insights and Forecast - by Distribution Channel
- 11.3.1. Convenience Stores
- 11.3.2. Online Channel
- 11.3.3. Specialty Stores
- 11.3.4. Supermarkets/Hypermarkets
- 11.3.5. Other Channels
- 11.1. Market Analysis, Insights and Forecast - by Sub Product
- 12. Competitive Analysis
- 12.1. Company Profiles
- 12.1.1 ADM
- 12.1.1.1. Company Overview
- 12.1.1.2. Products
- 12.1.1.3. Company Financials
- 12.1.1.4. SWOT Analysis
- 12.1.2 Clearlake Capital Group L P (Wellness Pet Company Inc )
- 12.1.2.1. Company Overview
- 12.1.2.2. Products
- 12.1.2.3. Company Financials
- 12.1.2.4. SWOT Analysis
- 12.1.3 General Mills Inc
- 12.1.3.1. Company Overview
- 12.1.3.2. Products
- 12.1.3.3. Company Financials
- 12.1.3.4. SWOT Analysis
- 12.1.4 Dechra Pharmaceuticals PLC
- 12.1.4.1. Company Overview
- 12.1.4.2. Products
- 12.1.4.3. Company Financials
- 12.1.4.4. SWOT Analysis
- 12.1.5 Sunshine Mills Inc
- 12.1.5.1. Company Overview
- 12.1.5.2. Products
- 12.1.5.3. Company Financials
- 12.1.5.4. SWOT Analysis
- 12.1.6 Mars Incorporated
- 12.1.6.1. Company Overview
- 12.1.6.2. Products
- 12.1.6.3. Company Financials
- 12.1.6.4. SWOT Analysis
- 12.1.7 Nestle (Purina)
- 12.1.7.1. Company Overview
- 12.1.7.2. Products
- 12.1.7.3. Company Financials
- 12.1.7.4. SWOT Analysis
- 12.1.8 Colgate-Palmolive Company (Hill's Pet Nutrition Inc )
- 12.1.8.1. Company Overview
- 12.1.8.2. Products
- 12.1.8.3. Company Financials
- 12.1.8.4. SWOT Analysis
- 12.1.9 Virba
- 12.1.9.1. Company Overview
- 12.1.9.2. Products
- 12.1.9.3. Company Financials
- 12.1.9.4. SWOT Analysis
- 12.1.10 The J M Smucker Company
- 12.1.10.1. Company Overview
- 12.1.10.2. Products
- 12.1.10.3. Company Financials
- 12.1.10.4. SWOT Analysis
- 12.1.1 ADM
- 12.2. Market Entropy
- 12.2.1 Company's Key Areas Served
- 12.2.2 Recent Developments
- 12.3. Company Market Share Analysis 2025
- 12.3.1 Top 5 Companies Market Share Analysis
- 12.3.2 Top 3 Companies Market Share Analysis
- 12.4. List of Potential Customers
- 13. Research Methodology
List of Figures
- Figure 1: Global US Pet Treats Market Revenue Breakdown (billion, %) by Region 2025 & 2033
- Figure 2: North America US Pet Treats Market Revenue (billion), by Sub Product 2025 & 2033
- Figure 3: North America US Pet Treats Market Revenue Share (%), by Sub Product 2025 & 2033
- Figure 4: North America US Pet Treats Market Revenue (billion), by Pets 2025 & 2033
- Figure 5: North America US Pet Treats Market Revenue Share (%), by Pets 2025 & 2033
- Figure 6: North America US Pet Treats Market Revenue (billion), by Distribution Channel 2025 & 2033
- Figure 7: North America US Pet Treats Market Revenue Share (%), by Distribution Channel 2025 & 2033
- Figure 8: North America US Pet Treats Market Revenue (billion), by Country 2025 & 2033
- Figure 9: North America US Pet Treats Market Revenue Share (%), by Country 2025 & 2033
- Figure 10: South America US Pet Treats Market Revenue (billion), by Sub Product 2025 & 2033
- Figure 11: South America US Pet Treats Market Revenue Share (%), by Sub Product 2025 & 2033
- Figure 12: South America US Pet Treats Market Revenue (billion), by Pets 2025 & 2033
- Figure 13: South America US Pet Treats Market Revenue Share (%), by Pets 2025 & 2033
- Figure 14: South America US Pet Treats Market Revenue (billion), by Distribution Channel 2025 & 2033
- Figure 15: South America US Pet Treats Market Revenue Share (%), by Distribution Channel 2025 & 2033
- Figure 16: South America US Pet Treats Market Revenue (billion), by Country 2025 & 2033
- Figure 17: South America US Pet Treats Market Revenue Share (%), by Country 2025 & 2033
- Figure 18: Europe US Pet Treats Market Revenue (billion), by Sub Product 2025 & 2033
- Figure 19: Europe US Pet Treats Market Revenue Share (%), by Sub Product 2025 & 2033
- Figure 20: Europe US Pet Treats Market Revenue (billion), by Pets 2025 & 2033
- Figure 21: Europe US Pet Treats Market Revenue Share (%), by Pets 2025 & 2033
- Figure 22: Europe US Pet Treats Market Revenue (billion), by Distribution Channel 2025 & 2033
- Figure 23: Europe US Pet Treats Market Revenue Share (%), by Distribution Channel 2025 & 2033
- Figure 24: Europe US Pet Treats Market Revenue (billion), by Country 2025 & 2033
- Figure 25: Europe US Pet Treats Market Revenue Share (%), by Country 2025 & 2033
- Figure 26: Middle East & Africa US Pet Treats Market Revenue (billion), by Sub Product 2025 & 2033
- Figure 27: Middle East & Africa US Pet Treats Market Revenue Share (%), by Sub Product 2025 & 2033
- Figure 28: Middle East & Africa US Pet Treats Market Revenue (billion), by Pets 2025 & 2033
- Figure 29: Middle East & Africa US Pet Treats Market Revenue Share (%), by Pets 2025 & 2033
- Figure 30: Middle East & Africa US Pet Treats Market Revenue (billion), by Distribution Channel 2025 & 2033
- Figure 31: Middle East & Africa US Pet Treats Market Revenue Share (%), by Distribution Channel 2025 & 2033
- Figure 32: Middle East & Africa US Pet Treats Market Revenue (billion), by Country 2025 & 2033
- Figure 33: Middle East & Africa US Pet Treats Market Revenue Share (%), by Country 2025 & 2033
- Figure 34: Asia Pacific US Pet Treats Market Revenue (billion), by Sub Product 2025 & 2033
- Figure 35: Asia Pacific US Pet Treats Market Revenue Share (%), by Sub Product 2025 & 2033
- Figure 36: Asia Pacific US Pet Treats Market Revenue (billion), by Pets 2025 & 2033
- Figure 37: Asia Pacific US Pet Treats Market Revenue Share (%), by Pets 2025 & 2033
- Figure 38: Asia Pacific US Pet Treats Market Revenue (billion), by Distribution Channel 2025 & 2033
- Figure 39: Asia Pacific US Pet Treats Market Revenue Share (%), by Distribution Channel 2025 & 2033
- Figure 40: Asia Pacific US Pet Treats Market Revenue (billion), by Country 2025 & 2033
- Figure 41: Asia Pacific US Pet Treats Market Revenue Share (%), by Country 2025 & 2033
List of Tables
- Table 1: Global US Pet Treats Market Revenue billion Forecast, by Sub Product 2020 & 2033
- Table 2: Global US Pet Treats Market Revenue billion Forecast, by Pets 2020 & 2033
- Table 3: Global US Pet Treats Market Revenue billion Forecast, by Distribution Channel 2020 & 2033
- Table 4: Global US Pet Treats Market Revenue billion Forecast, by Region 2020 & 2033
- Table 5: Global US Pet Treats Market Revenue billion Forecast, by Sub Product 2020 & 2033
- Table 6: Global US Pet Treats Market Revenue billion Forecast, by Pets 2020 & 2033
- Table 7: Global US Pet Treats Market Revenue billion Forecast, by Distribution Channel 2020 & 2033
- Table 8: Global US Pet Treats Market Revenue billion Forecast, by Country 2020 & 2033
- Table 9: United States US Pet Treats Market Revenue (billion) Forecast, by Application 2020 & 2033
- Table 10: Canada US Pet Treats Market Revenue (billion) Forecast, by Application 2020 & 2033
- Table 11: Mexico US Pet Treats Market Revenue (billion) Forecast, by Application 2020 & 2033
- Table 12: Global US Pet Treats Market Revenue billion Forecast, by Sub Product 2020 & 2033
- Table 13: Global US Pet Treats Market Revenue billion Forecast, by Pets 2020 & 2033
- Table 14: Global US Pet Treats Market Revenue billion Forecast, by Distribution Channel 2020 & 2033
- Table 15: Global US Pet Treats Market Revenue billion Forecast, by Country 2020 & 2033
- Table 16: Brazil US Pet Treats Market Revenue (billion) Forecast, by Application 2020 & 2033
- Table 17: Argentina US Pet Treats Market Revenue (billion) Forecast, by Application 2020 & 2033
- Table 18: Rest of South America US Pet Treats Market Revenue (billion) Forecast, by Application 2020 & 2033
- Table 19: Global US Pet Treats Market Revenue billion Forecast, by Sub Product 2020 & 2033
- Table 20: Global US Pet Treats Market Revenue billion Forecast, by Pets 2020 & 2033
- Table 21: Global US Pet Treats Market Revenue billion Forecast, by Distribution Channel 2020 & 2033
- Table 22: Global US Pet Treats Market Revenue billion Forecast, by Country 2020 & 2033
- Table 23: United Kingdom US Pet Treats Market Revenue (billion) Forecast, by Application 2020 & 2033
- Table 24: Germany US Pet Treats Market Revenue (billion) Forecast, by Application 2020 & 2033
- Table 25: France US Pet Treats Market Revenue (billion) Forecast, by Application 2020 & 2033
- Table 26: Italy US Pet Treats Market Revenue (billion) Forecast, by Application 2020 & 2033
- Table 27: Spain US Pet Treats Market Revenue (billion) Forecast, by Application 2020 & 2033
- Table 28: Russia US Pet Treats Market Revenue (billion) Forecast, by Application 2020 & 2033
- Table 29: Benelux US Pet Treats Market Revenue (billion) Forecast, by Application 2020 & 2033
- Table 30: Nordics US Pet Treats Market Revenue (billion) Forecast, by Application 2020 & 2033
- Table 31: Rest of Europe US Pet Treats Market Revenue (billion) Forecast, by Application 2020 & 2033
- Table 32: Global US Pet Treats Market Revenue billion Forecast, by Sub Product 2020 & 2033
- Table 33: Global US Pet Treats Market Revenue billion Forecast, by Pets 2020 & 2033
- Table 34: Global US Pet Treats Market Revenue billion Forecast, by Distribution Channel 2020 & 2033
- Table 35: Global US Pet Treats Market Revenue billion Forecast, by Country 2020 & 2033
- Table 36: Turkey US Pet Treats Market Revenue (billion) Forecast, by Application 2020 & 2033
- Table 37: Israel US Pet Treats Market Revenue (billion) Forecast, by Application 2020 & 2033
- Table 38: GCC US Pet Treats Market Revenue (billion) Forecast, by Application 2020 & 2033
- Table 39: North Africa US Pet Treats Market Revenue (billion) Forecast, by Application 2020 & 2033
- Table 40: South Africa US Pet Treats Market Revenue (billion) Forecast, by Application 2020 & 2033
- Table 41: Rest of Middle East & Africa US Pet Treats Market Revenue (billion) Forecast, by Application 2020 & 2033
- Table 42: Global US Pet Treats Market Revenue billion Forecast, by Sub Product 2020 & 2033
- Table 43: Global US Pet Treats Market Revenue billion Forecast, by Pets 2020 & 2033
- Table 44: Global US Pet Treats Market Revenue billion Forecast, by Distribution Channel 2020 & 2033
- Table 45: Global US Pet Treats Market Revenue billion Forecast, by Country 2020 & 2033
- Table 46: China US Pet Treats Market Revenue (billion) Forecast, by Application 2020 & 2033
- Table 47: India US Pet Treats Market Revenue (billion) Forecast, by Application 2020 & 2033
- Table 48: Japan US Pet Treats Market Revenue (billion) Forecast, by Application 2020 & 2033
- Table 49: South Korea US Pet Treats Market Revenue (billion) Forecast, by Application 2020 & 2033
- Table 50: ASEAN US Pet Treats Market Revenue (billion) Forecast, by Application 2020 & 2033
- Table 51: Oceania US Pet Treats Market Revenue (billion) Forecast, by Application 2020 & 2033
- Table 52: Rest of Asia Pacific US Pet Treats Market Revenue (billion) Forecast, by Application 2020 & 2033
Frequently Asked Questions
1. What is the projected Compound Annual Growth Rate (CAGR) of the US Pet Treats Market?
The projected CAGR is approximately 4.8%.
2. Which companies are prominent players in the US Pet Treats Market?
Key companies in the market include ADM, Clearlake Capital Group L P (Wellness Pet Company Inc ), General Mills Inc, Dechra Pharmaceuticals PLC, Sunshine Mills Inc, Mars Incorporated, Nestle (Purina), Colgate-Palmolive Company (Hill's Pet Nutrition Inc ), Virba, The J M Smucker Company.
3. What are the main segments of the US Pet Treats Market?
The market segments include Sub Product, Pets, Distribution Channel.
4. Can you provide details about the market size?
The market size is estimated to be USD 5.1 billion as of 2022.
5. What are some drivers contributing to market growth?
Increased Demand for Meat; Initiatives By the Key Players; Focus on Animal nutrition and Health.
6. What are the notable trends driving market growth?
OTHER KEY INDUSTRY TRENDS COVERED IN THE REPORT.
7. Are there any restraints impacting market growth?
Shift Toward Vegan- Based Diet; Changing Raw Material Prices and Strict Government Rules to Restrict Market Growth.
8. Can you provide examples of recent developments in the market?
May 2023: Nestle Purina launched new cat treats under the Friskies "Friskies Playfuls - treats" brand. These treats are round in shape and are available in chicken and liver and salmon and shrimp flavors for adult cats.March 2023: Temptations, a brand under Mars Incorporated, expanded its treats offerings with a new product called Temptation Tender Fills treats and two new flavors of its Temptations Creamy Purrrr-ee treats.February 2023: Nestle SA acquired the US pet treats factory from investor-backed local supplier Red Collar Pet Foods. The company aims to expand its pet food business in North America.
9. What pricing options are available for accessing the report?
Pricing options include single-user, multi-user, and enterprise licenses priced at USD 3800, USD 4500, and USD 5800 respectively.
10. Is the market size provided in terms of value or volume?
The market size is provided in terms of value, measured in billion.
11. Are there any specific market keywords associated with the report?
Yes, the market keyword associated with the report is "US Pet Treats Market," which aids in identifying and referencing the specific market segment covered.
12. How do I determine which pricing option suits my needs best?
The pricing options vary based on user requirements and access needs. Individual users may opt for single-user licenses, while businesses requiring broader access may choose multi-user or enterprise licenses for cost-effective access to the report.
13. Are there any additional resources or data provided in the US Pet Treats Market report?
While the report offers comprehensive insights, it's advisable to review the specific contents or supplementary materials provided to ascertain if additional resources or data are available.
14. How can I stay updated on further developments or reports in the US Pet Treats Market?
To stay informed about further developments, trends, and reports in the US Pet Treats Market, consider subscribing to industry newsletters, following relevant companies and organizations, or regularly checking reputable industry news sources and publications.
Methodology
Step 1 - Identification of Relevant Samples Size from Population Database


Step 2 - Approaches for Defining Global Market Size (Value, Volume* & Price*)

Note*: In applicable scenarios
Step 3 - Data Sources
Primary Research
- Web Analytics
- Survey Reports
- Research Institute
- Latest Research Reports
- Opinion Leaders
Secondary Research
- Annual Reports
- White Paper
- Latest Press Release
- Industry Association
- Paid Database
- Investor Presentations

Step 4 - Data Triangulation
Involves using different sources of information in order to increase the validity of a study
These sources are likely to be stakeholders in a program - participants, other researchers, program staff, other community members, and so on.
Then we put all data in single framework & apply various statistical tools to find out the dynamic on the market.
During the analysis stage, feedback from the stakeholder groups would be compared to determine areas of agreement as well as areas of divergence