

Key Insights
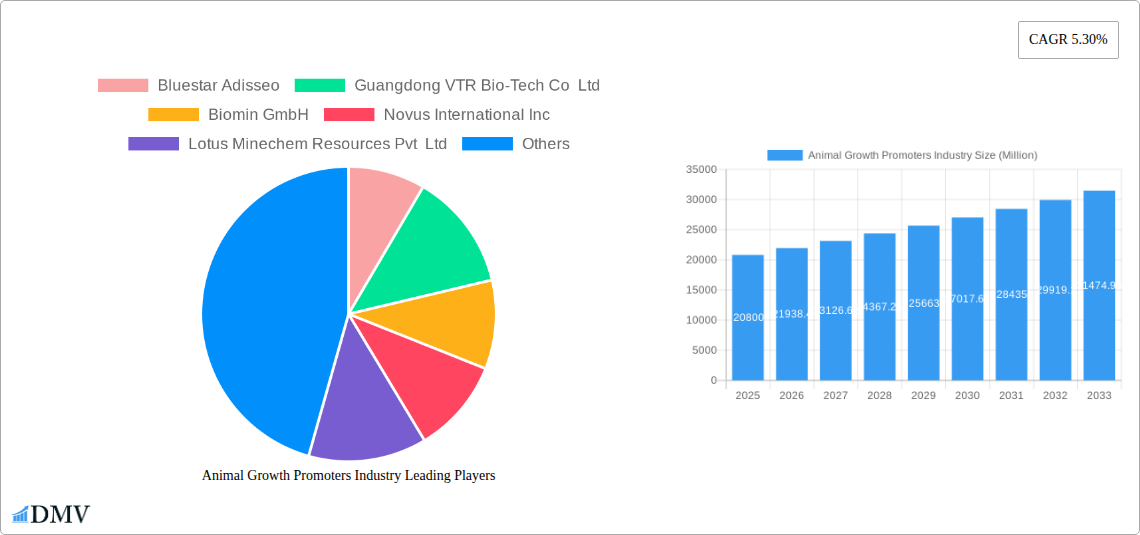
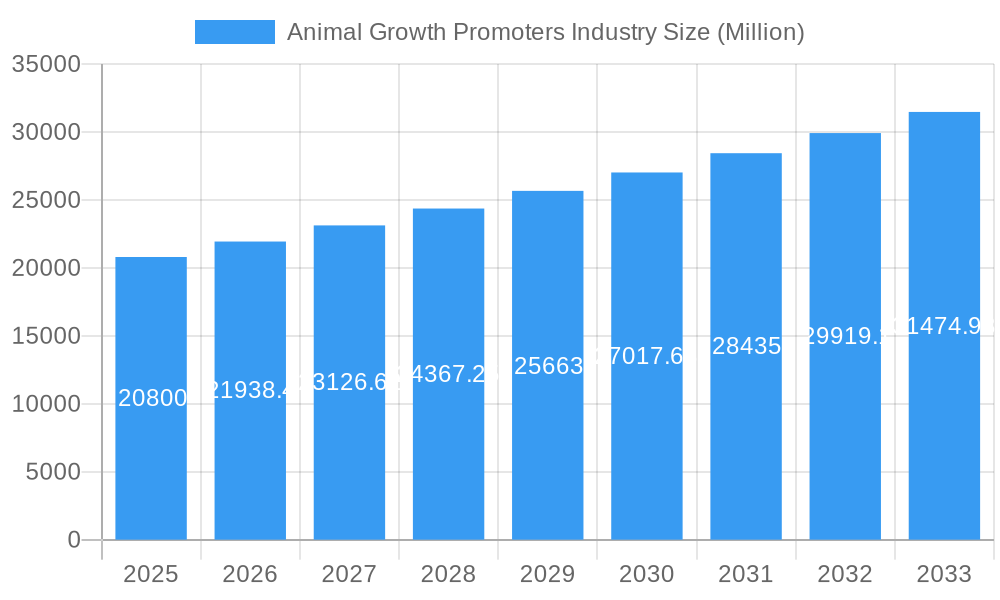
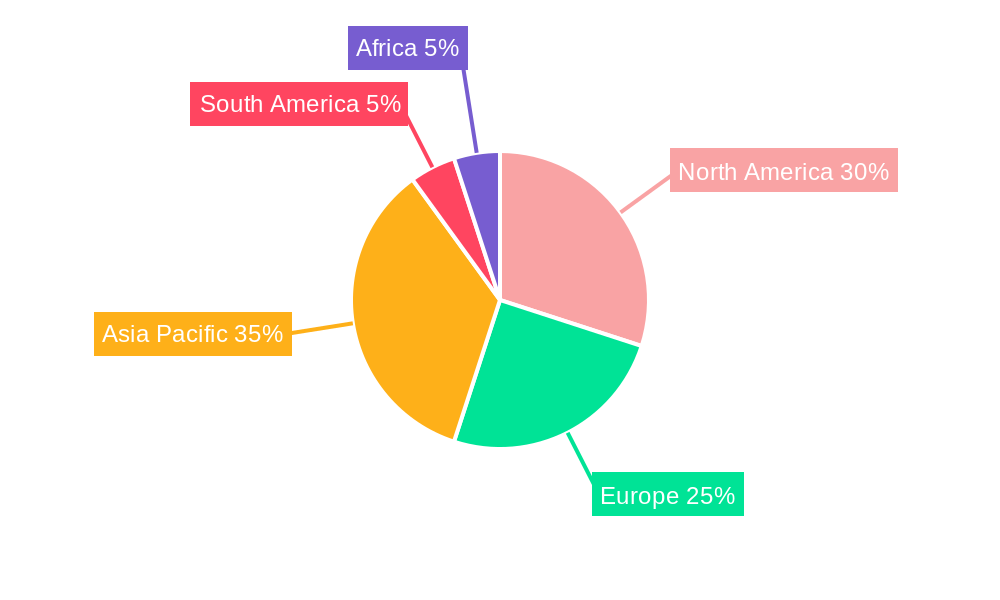
The global animal growth promoters market, valued at $20.80 billion in 2025, is projected to experience robust growth, driven by increasing demand for animal protein, advancements in animal feed formulations, and a rising focus on improving feed efficiency and animal health. The market's Compound Annual Growth Rate (CAGR) of 5.30% from 2025 to 2033 reflects a consistent expansion fueled by several key factors. The increasing global population necessitates higher animal protein production, pushing the demand for growth promoters that enhance feed conversion ratios and accelerate growth rates. Furthermore, the incorporation of advanced technologies in animal farming and the growing awareness of sustainable farming practices are contributing to the adoption of high-performance growth promoters. Stringent regulations regarding antibiotic use in animal feed are also driving the transition to alternative growth promoters like probiotics, prebiotics, and phytogenics, creating new opportunities for market growth. Competition among key players like Bluestar Adisseo, Biomin GmbH, and Cargill Inc. is further intensifying innovation and driving product development. However, price fluctuations in raw materials and potential regulatory hurdles in certain regions pose challenges to the market's continued expansion. Segmentation analysis reveals significant contributions from the ruminant and poultry segments, indicating a strong focus on livestock and poultry farming. Probiotics and prebiotics, owing to their health benefits and environmental friendliness, are gaining significant traction within the 'Type' segment. Geographical analysis shows strong growth in Asia Pacific and North America, fueled by the high concentration of animal production facilities and growing consumer demand.
Animal Growth Promoters Industry Market Size (In Billion)
The market's expansion is anticipated to continue throughout the forecast period (2025-2033). The rising adoption of precision livestock farming and the integration of data analytics in animal husbandry are poised to further enhance productivity and efficiency. Furthermore, the growing research and development in novel growth promoters with enhanced efficacy and reduced environmental impact will further fuel market growth. However, maintaining consistent growth requires addressing challenges such as the fluctuating prices of raw materials and ensuring the sustainability and safety of animal growth promoters. Strategies focusing on developing cost-effective and environmentally friendly growth promoters will be crucial for sustained market success in the long term. The ongoing shift towards sustainable and environmentally responsible animal farming practices will necessitate innovative solutions that balance productivity with environmental concerns.
Animal Growth Promoters Industry Company Market Share
Animal Growth Promoters Market Report: 2019-2033
This comprehensive report provides an in-depth analysis of the global Animal Growth Promoters industry, offering valuable insights for stakeholders seeking to understand market dynamics, future trends, and strategic opportunities. The report covers the period from 2019 to 2033, with a focus on the forecast period from 2025 to 2033 and a base year of 2025. The market is segmented by animal type (ruminant, poultry, swine, aquaculture, other) and product type (probiotics, prebiotics, phytogenics, acidifiers, other), providing a granular view of this dynamic sector. Key players analyzed include Bluestar Adisseo, Guangdong VTR Bio-Tech Co Ltd, Biomin GmbH, Novus International Inc, Lotus Minechem Resources Pvt Ltd, Kemin Industries, Chr. Hansen A/S, BASF SE, DSM, Alltech Inc, DuPont de Nemours Inc, Cargill Inc, Novozymes A/S, Elanco Animal Health Incorporated, and Zoetis Inc. The total market size is estimated to reach xx Million by 2033.
Animal Growth Promoters Industry Market Composition & Trends
This section analyzes the competitive landscape, innovation drivers, regulatory frameworks, and market dynamics within the Animal Growth Promoters industry. We delve into market concentration, examining the market share distribution amongst leading players and identifying key trends influencing market evolution. The report also explores mergers and acquisitions (M&A) activities, analyzing deal values and their impact on market consolidation. The evolving regulatory landscape is meticulously examined, accounting for its influence on product development and market access. Substitute products and their competitive pressures are evaluated, alongside detailed end-user profiles to understand consumption patterns and preferences.
- Market Concentration: The market shows a moderately concentrated structure, with the top 5 players holding approximately xx% of the market share in 2024.
- Innovation Catalysts: Increasing consumer demand for sustainable and efficient animal protein production is driving innovation in the development of novel animal growth promoters.
- Regulatory Landscape: Stringent regulations regarding the use of antibiotics as growth promoters are reshaping the market, encouraging the adoption of alternative solutions.
- Substitute Products: Competition from traditional feed additives and emerging technologies presents challenges to market growth.
- End-User Profiles: The report profiles major end-users, including large-scale commercial farms, smaller livestock operations, and aquaculture facilities.
- M&A Activities: The industry has witnessed significant M&A activity in recent years, with deal values totaling xx Million between 2019 and 2024.
Animal Growth Promoters Industry Industry Evolution
This section charts the historical and projected trajectory of the Animal Growth Promoters market. We examine market growth rates, technological advancements that are transforming production and application, and the evolving demands from consumers for higher-quality, sustainably produced animal products. Specific data points on growth rates and adoption of new technologies are provided, offering valuable insights into market dynamics. The impact of consumer preferences, particularly concerning animal welfare and environmental sustainability, on the industry's evolution is also addressed. The shift towards natural and organic animal growth promoters is analyzed. The section also examines the influence of technological advancements, such as precision feeding and data analytics, on improving efficiency and reducing costs in animal production.
Leading Regions, Countries, or Segments in Animal Growth Promoters Industry
This section pinpoints the leading regions, countries, and segments within the Animal Growth Promoters market. We explore factors driving dominance, including investment trends, regulatory support, and market size. A detailed analysis of the leading segments—both by animal type and product type—is provided.
Dominant Segments:
- Animal Type: Poultry remains the dominant segment due to its large-scale production and high demand.
- Product Type: Probiotics and prebiotics are leading product types owing to their effectiveness and consumer preference for natural solutions.
Key Drivers of Dominance:
- High Investment: Significant investments in research and development are fueling innovation and expansion in the poultry and probiotics segments.
- Regulatory Support: Government incentives and favorable regulatory environments are promoting the growth of specific segments in key regions.
- Market Size: The substantial market size in certain regions and countries contributes significantly to their dominance.
In-depth Analysis: The dominance of poultry is primarily driven by the high volume of poultry production globally. The preference for probiotics and prebiotics reflects the growing consumer awareness of the importance of gut health and natural feed additives.
Animal Growth Promoters Industry Product Innovations
Recent years have seen the introduction of innovative animal growth promoters, focusing on improved efficacy, enhanced sustainability, and reduced environmental impact. These innovations include advanced probiotic formulations, novel prebiotic compounds, and phytogenic feed additives with enhanced bioavailability. The integration of precision feeding technologies and data analytics is improving the accuracy and efficiency of application. These advancements offer enhanced animal health and improved performance metrics, leading to a reduction in overall production costs. Unique selling propositions (USPs) are highlighted across different product categories.
Propelling Factors for Animal Growth Promoters Industry Growth
Several factors contribute to the projected growth of the Animal Growth Promoters industry. Technological advancements in areas such as precision feeding and data analytics offer significant opportunities for increased efficiency and productivity in animal agriculture. Economic factors like rising global demand for animal protein are also driving growth. Furthermore, stringent regulations on antibiotic use are creating a strong impetus for the adoption of alternative growth promoters. The rising consumer awareness of animal welfare and sustainable practices further fuels the demand for these innovative products.
Obstacles in the Animal Growth Promoters Industry Market
Despite the positive outlook, the Animal Growth Promoters market faces challenges. Regulatory hurdles and variations in approval processes across different regions create complexities for market entry and expansion. Supply chain disruptions, especially those caused by geopolitical factors or unexpected events, can significantly impact the availability and cost of raw materials. Intense competition amongst established players and emerging firms also presents an ongoing obstacle. These factors create uncertainties impacting growth predictions.
Future Opportunities in Animal Growth Promoters Industry
The Animal Growth Promoters industry presents significant opportunities for growth. The expansion into emerging markets with growing livestock populations offers substantial potential. The development of novel products with improved efficacy and sustainability profiles presents exciting avenues for innovation. Moreover, integrating advanced technologies such as artificial intelligence and machine learning into the value chain promises to optimize animal production systems and improve profitability.
Major Players in the Animal Growth Promoters Industry Ecosystem
- Bluestar Adisseo
- Guangdong VTR Bio-Tech Co Ltd
- Biomin GmbH
- Novus International Inc
- Lotus Minechem Resources Pvt Ltd
- Kemin Industries
- Chr. Hansen A/S
- BASF SE
- DSM
- Alltech Inc
- DuPont de Nemours Inc
- Cargill Inc
- Novozymes A/S
- Elanco Animal Health Incorporated
- Zoetis Inc
Key Developments in Animal Growth Promoters Industry Industry
- January 2023: Company X launched a new line of sustainable probiotics for poultry.
- April 2022: Company Y acquired Company Z, expanding its market share in the swine segment.
- October 2021: A new regulatory framework for animal growth promoters was implemented in Region A. (Specific details would be included in the full report)
Strategic Animal Growth Promoters Industry Market Forecast
The Animal Growth Promoters market is poised for robust growth driven by increasing demand for animal protein, heightened focus on sustainable agriculture, and ongoing innovations in product development. The adoption of advanced technologies, coupled with favorable regulatory environments in key markets, is further expected to boost market expansion. The market's future trajectory is optimistic, promising significant opportunities for both established players and new entrants.
Animal Growth Promoters Industry Segmentation
-
1. Type
- 1.1. Probiotics
- 1.2. Prebiotics
- 1.3. Phytogenics
- 1.4. Acidifiers
- 1.5. Other Types
-
2. Animal Type
- 2.1. Ruminant
- 2.2. Poultry
- 2.3. Swine
- 2.4. Aquaculture
- 2.5. Other Animal Types
Animal Growth Promoters Industry Segmentation By Geography
-
1. North America
- 1.1. United States
- 1.2. Canada
- 1.3. Mexico
- 1.4. Rest of North America
-
2. Europe
- 2.1. Germany
- 2.2. United Kingdom
- 2.3. France
- 2.4. Russia
- 2.5. Spain
- 2.6. Rest of Europe
-
3. Asia Pacific
- 3.1. China
- 3.2. Japan
- 3.3. India
- 3.4. Australia
- 3.5. Rest of Asia Pacific
-
4. South America
- 4.1. Brazil
- 4.2. Argentina
- 4.3. Rest of South America
-
5. Africa
- 5.1. South Africa
- 5.2. Rest of Africa
Animal Growth Promoters Industry Regional Market Share
Geographic Coverage of Animal Growth Promoters Industry
Animal Growth Promoters Industry REPORT HIGHLIGHTS
| Aspects | Details |
|---|---|
| Study Period | 2020-2034 |
| Base Year | 2025 |
| Estimated Year | 2026 |
| Forecast Period | 2026-2034 |
| Historical Period | 2020-2025 |
| Growth Rate | CAGR of 5.30% from 2020-2034 |
| Segmentation |
|
Table of Contents
- 1. Introduction
- 1.1. Research Scope
- 1.2. Market Segmentation
- 1.3. Research Objective
- 1.4. Definitions and Assumptions
- 2. Executive Summary
- 2.1. Market Snapshot
- 3. Market Dynamics
- 3.1. Market Drivers
- 3.2. Market Restrains
- 3.3. Market Trends
- 3.4. Market Opportunities
- 4. Market Factor Analysis
- 4.1. Porters Five Forces
- 4.1.1. Bargaining Power of Suppliers
- 4.1.2. Bargaining Power of Buyers
- 4.1.3. Threat of New Entrants
- 4.1.4. Threat of Substitutes
- 4.1.5. Competitive Rivalry
- 4.2. PESTEL analysis
- 4.3. BCG Analysis
- 4.3.1. Stars (High Growth, High Market Share)
- 4.3.2. Cash Cows (Low Growth, High Market Share)
- 4.3.3. Question Mark (High Growth, Low Market Share)
- 4.3.4. Dogs (Low Growth, Low Market Share)
- 4.4. Ansoff Matrix Analysis
- 4.5. Supply Chain Analysis
- 4.6. Regulatory Landscape
- 4.7. Current Market Potential and Opportunity Assessment (TAM–SAM–SOM Framework)
- 4.8. DMV Analyst Note
- 4.1. Porters Five Forces
- 5. Market Analysis, Insights and Forecast 2021-2033
- 5.1. Market Analysis, Insights and Forecast - by Type
- 5.1.1. Probiotics
- 5.1.2. Prebiotics
- 5.1.3. Phytogenics
- 5.1.4. Acidifiers
- 5.1.5. Other Types
- 5.2. Market Analysis, Insights and Forecast - by Animal Type
- 5.2.1. Ruminant
- 5.2.2. Poultry
- 5.2.3. Swine
- 5.2.4. Aquaculture
- 5.2.5. Other Animal Types
- 5.3. Market Analysis, Insights and Forecast - by Region
- 5.3.1. North America
- 5.3.2. Europe
- 5.3.3. Asia Pacific
- 5.3.4. South America
- 5.3.5. Africa
- 5.1. Market Analysis, Insights and Forecast - by Type
- 6. Global Animal Growth Promoters Industry Analysis, Insights and Forecast, 2021-2033
- 6.1. Market Analysis, Insights and Forecast - by Type
- 6.1.1. Probiotics
- 6.1.2. Prebiotics
- 6.1.3. Phytogenics
- 6.1.4. Acidifiers
- 6.1.5. Other Types
- 6.2. Market Analysis, Insights and Forecast - by Animal Type
- 6.2.1. Ruminant
- 6.2.2. Poultry
- 6.2.3. Swine
- 6.2.4. Aquaculture
- 6.2.5. Other Animal Types
- 6.1. Market Analysis, Insights and Forecast - by Type
- 7. North America Animal Growth Promoters Industry Analysis, Insights and Forecast, 2020-2032
- 7.1. Market Analysis, Insights and Forecast - by Type
- 7.1.1. Probiotics
- 7.1.2. Prebiotics
- 7.1.3. Phytogenics
- 7.1.4. Acidifiers
- 7.1.5. Other Types
- 7.2. Market Analysis, Insights and Forecast - by Animal Type
- 7.2.1. Ruminant
- 7.2.2. Poultry
- 7.2.3. Swine
- 7.2.4. Aquaculture
- 7.2.5. Other Animal Types
- 7.1. Market Analysis, Insights and Forecast - by Type
- 8. Europe Animal Growth Promoters Industry Analysis, Insights and Forecast, 2020-2032
- 8.1. Market Analysis, Insights and Forecast - by Type
- 8.1.1. Probiotics
- 8.1.2. Prebiotics
- 8.1.3. Phytogenics
- 8.1.4. Acidifiers
- 8.1.5. Other Types
- 8.2. Market Analysis, Insights and Forecast - by Animal Type
- 8.2.1. Ruminant
- 8.2.2. Poultry
- 8.2.3. Swine
- 8.2.4. Aquaculture
- 8.2.5. Other Animal Types
- 8.1. Market Analysis, Insights and Forecast - by Type
- 9. Asia Pacific Animal Growth Promoters Industry Analysis, Insights and Forecast, 2020-2032
- 9.1. Market Analysis, Insights and Forecast - by Type
- 9.1.1. Probiotics
- 9.1.2. Prebiotics
- 9.1.3. Phytogenics
- 9.1.4. Acidifiers
- 9.1.5. Other Types
- 9.2. Market Analysis, Insights and Forecast - by Animal Type
- 9.2.1. Ruminant
- 9.2.2. Poultry
- 9.2.3. Swine
- 9.2.4. Aquaculture
- 9.2.5. Other Animal Types
- 9.1. Market Analysis, Insights and Forecast - by Type
- 10. South America Animal Growth Promoters Industry Analysis, Insights and Forecast, 2020-2032
- 10.1. Market Analysis, Insights and Forecast - by Type
- 10.1.1. Probiotics
- 10.1.2. Prebiotics
- 10.1.3. Phytogenics
- 10.1.4. Acidifiers
- 10.1.5. Other Types
- 10.2. Market Analysis, Insights and Forecast - by Animal Type
- 10.2.1. Ruminant
- 10.2.2. Poultry
- 10.2.3. Swine
- 10.2.4. Aquaculture
- 10.2.5. Other Animal Types
- 10.1. Market Analysis, Insights and Forecast - by Type
- 11. Africa Animal Growth Promoters Industry Analysis, Insights and Forecast, 2020-2032
- 11.1. Market Analysis, Insights and Forecast - by Type
- 11.1.1. Probiotics
- 11.1.2. Prebiotics
- 11.1.3. Phytogenics
- 11.1.4. Acidifiers
- 11.1.5. Other Types
- 11.2. Market Analysis, Insights and Forecast - by Animal Type
- 11.2.1. Ruminant
- 11.2.2. Poultry
- 11.2.3. Swine
- 11.2.4. Aquaculture
- 11.2.5. Other Animal Types
- 11.1. Market Analysis, Insights and Forecast - by Type
- 12. Competitive Analysis
- 12.1. Company Profiles
- 12.1.1 Bluestar Adisseo
- 12.1.1.1. Company Overview
- 12.1.1.2. Products
- 12.1.1.3. Company Financials
- 12.1.1.4. SWOT Analysis
- 12.1.2 Guangdong VTR Bio-Tech Co Ltd
- 12.1.2.1. Company Overview
- 12.1.2.2. Products
- 12.1.2.3. Company Financials
- 12.1.2.4. SWOT Analysis
- 12.1.3 Biomin GmbH
- 12.1.3.1. Company Overview
- 12.1.3.2. Products
- 12.1.3.3. Company Financials
- 12.1.3.4. SWOT Analysis
- 12.1.4 Novus International Inc
- 12.1.4.1. Company Overview
- 12.1.4.2. Products
- 12.1.4.3. Company Financials
- 12.1.4.4. SWOT Analysis
- 12.1.5 Lotus Minechem Resources Pvt Ltd
- 12.1.5.1. Company Overview
- 12.1.5.2. Products
- 12.1.5.3. Company Financials
- 12.1.5.4. SWOT Analysis
- 12.1.6 Kemin Industries
- 12.1.6.1. Company Overview
- 12.1.6.2. Products
- 12.1.6.3. Company Financials
- 12.1.6.4. SWOT Analysis
- 12.1.7 Chr Hansen A/
- 12.1.7.1. Company Overview
- 12.1.7.2. Products
- 12.1.7.3. Company Financials
- 12.1.7.4. SWOT Analysis
- 12.1.8 BASF SE
- 12.1.8.1. Company Overview
- 12.1.8.2. Products
- 12.1.8.3. Company Financials
- 12.1.8.4. SWOT Analysis
- 12.1.9 DSM
- 12.1.9.1. Company Overview
- 12.1.9.2. Products
- 12.1.9.3. Company Financials
- 12.1.9.4. SWOT Analysis
- 12.1.10 Alltech Inc
- 12.1.10.1. Company Overview
- 12.1.10.2. Products
- 12.1.10.3. Company Financials
- 12.1.10.4. SWOT Analysis
- 12.1.11 Dupont De Nemours Inc
- 12.1.11.1. Company Overview
- 12.1.11.2. Products
- 12.1.11.3. Company Financials
- 12.1.11.4. SWOT Analysis
- 12.1.12 Cargill Inc
- 12.1.12.1. Company Overview
- 12.1.12.2. Products
- 12.1.12.3. Company Financials
- 12.1.12.4. SWOT Analysis
- 12.1.13 Novozymes A/S
- 12.1.13.1. Company Overview
- 12.1.13.2. Products
- 12.1.13.3. Company Financials
- 12.1.13.4. SWOT Analysis
- 12.1.14 Elanco Animal Health Incorporated
- 12.1.14.1. Company Overview
- 12.1.14.2. Products
- 12.1.14.3. Company Financials
- 12.1.14.4. SWOT Analysis
- 12.1.15 Zoetis Inc
- 12.1.15.1. Company Overview
- 12.1.15.2. Products
- 12.1.15.3. Company Financials
- 12.1.15.4. SWOT Analysis
- 12.1.1 Bluestar Adisseo
- 12.2. Market Entropy
- 12.2.1 Company's Key Areas Served
- 12.2.2 Recent Developments
- 12.3. Company Market Share Analysis 2025
- 12.3.1 Top 5 Companies Market Share Analysis
- 12.3.2 Top 3 Companies Market Share Analysis
- 12.4. List of Potential Customers
- 13. Research Methodology
List of Figures
- Figure 1: Global Animal Growth Promoters Industry Revenue Breakdown (Million, %) by Region 2025 & 2033
- Figure 2: North America Animal Growth Promoters Industry Revenue (Million), by Type 2025 & 2033
- Figure 3: North America Animal Growth Promoters Industry Revenue Share (%), by Type 2025 & 2033
- Figure 4: North America Animal Growth Promoters Industry Revenue (Million), by Animal Type 2025 & 2033
- Figure 5: North America Animal Growth Promoters Industry Revenue Share (%), by Animal Type 2025 & 2033
- Figure 6: North America Animal Growth Promoters Industry Revenue (Million), by Country 2025 & 2033
- Figure 7: North America Animal Growth Promoters Industry Revenue Share (%), by Country 2025 & 2033
- Figure 8: Europe Animal Growth Promoters Industry Revenue (Million), by Type 2025 & 2033
- Figure 9: Europe Animal Growth Promoters Industry Revenue Share (%), by Type 2025 & 2033
- Figure 10: Europe Animal Growth Promoters Industry Revenue (Million), by Animal Type 2025 & 2033
- Figure 11: Europe Animal Growth Promoters Industry Revenue Share (%), by Animal Type 2025 & 2033
- Figure 12: Europe Animal Growth Promoters Industry Revenue (Million), by Country 2025 & 2033
- Figure 13: Europe Animal Growth Promoters Industry Revenue Share (%), by Country 2025 & 2033
- Figure 14: Asia Pacific Animal Growth Promoters Industry Revenue (Million), by Type 2025 & 2033
- Figure 15: Asia Pacific Animal Growth Promoters Industry Revenue Share (%), by Type 2025 & 2033
- Figure 16: Asia Pacific Animal Growth Promoters Industry Revenue (Million), by Animal Type 2025 & 2033
- Figure 17: Asia Pacific Animal Growth Promoters Industry Revenue Share (%), by Animal Type 2025 & 2033
- Figure 18: Asia Pacific Animal Growth Promoters Industry Revenue (Million), by Country 2025 & 2033
- Figure 19: Asia Pacific Animal Growth Promoters Industry Revenue Share (%), by Country 2025 & 2033
- Figure 20: South America Animal Growth Promoters Industry Revenue (Million), by Type 2025 & 2033
- Figure 21: South America Animal Growth Promoters Industry Revenue Share (%), by Type 2025 & 2033
- Figure 22: South America Animal Growth Promoters Industry Revenue (Million), by Animal Type 2025 & 2033
- Figure 23: South America Animal Growth Promoters Industry Revenue Share (%), by Animal Type 2025 & 2033
- Figure 24: South America Animal Growth Promoters Industry Revenue (Million), by Country 2025 & 2033
- Figure 25: South America Animal Growth Promoters Industry Revenue Share (%), by Country 2025 & 2033
- Figure 26: Africa Animal Growth Promoters Industry Revenue (Million), by Type 2025 & 2033
- Figure 27: Africa Animal Growth Promoters Industry Revenue Share (%), by Type 2025 & 2033
- Figure 28: Africa Animal Growth Promoters Industry Revenue (Million), by Animal Type 2025 & 2033
- Figure 29: Africa Animal Growth Promoters Industry Revenue Share (%), by Animal Type 2025 & 2033
- Figure 30: Africa Animal Growth Promoters Industry Revenue (Million), by Country 2025 & 2033
- Figure 31: Africa Animal Growth Promoters Industry Revenue Share (%), by Country 2025 & 2033
List of Tables
- Table 1: Global Animal Growth Promoters Industry Revenue Million Forecast, by Type 2020 & 2033
- Table 2: Global Animal Growth Promoters Industry Revenue Million Forecast, by Animal Type 2020 & 2033
- Table 3: Global Animal Growth Promoters Industry Revenue Million Forecast, by Region 2020 & 2033
- Table 4: Global Animal Growth Promoters Industry Revenue Million Forecast, by Type 2020 & 2033
- Table 5: Global Animal Growth Promoters Industry Revenue Million Forecast, by Animal Type 2020 & 2033
- Table 6: Global Animal Growth Promoters Industry Revenue Million Forecast, by Country 2020 & 2033
- Table 7: United States Animal Growth Promoters Industry Revenue (Million) Forecast, by Application 2020 & 2033
- Table 8: Canada Animal Growth Promoters Industry Revenue (Million) Forecast, by Application 2020 & 2033
- Table 9: Mexico Animal Growth Promoters Industry Revenue (Million) Forecast, by Application 2020 & 2033
- Table 10: Rest of North America Animal Growth Promoters Industry Revenue (Million) Forecast, by Application 2020 & 2033
- Table 11: Global Animal Growth Promoters Industry Revenue Million Forecast, by Type 2020 & 2033
- Table 12: Global Animal Growth Promoters Industry Revenue Million Forecast, by Animal Type 2020 & 2033
- Table 13: Global Animal Growth Promoters Industry Revenue Million Forecast, by Country 2020 & 2033
- Table 14: Germany Animal Growth Promoters Industry Revenue (Million) Forecast, by Application 2020 & 2033
- Table 15: United Kingdom Animal Growth Promoters Industry Revenue (Million) Forecast, by Application 2020 & 2033
- Table 16: France Animal Growth Promoters Industry Revenue (Million) Forecast, by Application 2020 & 2033
- Table 17: Russia Animal Growth Promoters Industry Revenue (Million) Forecast, by Application 2020 & 2033
- Table 18: Spain Animal Growth Promoters Industry Revenue (Million) Forecast, by Application 2020 & 2033
- Table 19: Rest of Europe Animal Growth Promoters Industry Revenue (Million) Forecast, by Application 2020 & 2033
- Table 20: Global Animal Growth Promoters Industry Revenue Million Forecast, by Type 2020 & 2033
- Table 21: Global Animal Growth Promoters Industry Revenue Million Forecast, by Animal Type 2020 & 2033
- Table 22: Global Animal Growth Promoters Industry Revenue Million Forecast, by Country 2020 & 2033
- Table 23: China Animal Growth Promoters Industry Revenue (Million) Forecast, by Application 2020 & 2033
- Table 24: Japan Animal Growth Promoters Industry Revenue (Million) Forecast, by Application 2020 & 2033
- Table 25: India Animal Growth Promoters Industry Revenue (Million) Forecast, by Application 2020 & 2033
- Table 26: Australia Animal Growth Promoters Industry Revenue (Million) Forecast, by Application 2020 & 2033
- Table 27: Rest of Asia Pacific Animal Growth Promoters Industry Revenue (Million) Forecast, by Application 2020 & 2033
- Table 28: Global Animal Growth Promoters Industry Revenue Million Forecast, by Type 2020 & 2033
- Table 29: Global Animal Growth Promoters Industry Revenue Million Forecast, by Animal Type 2020 & 2033
- Table 30: Global Animal Growth Promoters Industry Revenue Million Forecast, by Country 2020 & 2033
- Table 31: Brazil Animal Growth Promoters Industry Revenue (Million) Forecast, by Application 2020 & 2033
- Table 32: Argentina Animal Growth Promoters Industry Revenue (Million) Forecast, by Application 2020 & 2033
- Table 33: Rest of South America Animal Growth Promoters Industry Revenue (Million) Forecast, by Application 2020 & 2033
- Table 34: Global Animal Growth Promoters Industry Revenue Million Forecast, by Type 2020 & 2033
- Table 35: Global Animal Growth Promoters Industry Revenue Million Forecast, by Animal Type 2020 & 2033
- Table 36: Global Animal Growth Promoters Industry Revenue Million Forecast, by Country 2020 & 2033
- Table 37: South Africa Animal Growth Promoters Industry Revenue (Million) Forecast, by Application 2020 & 2033
- Table 38: Rest of Africa Animal Growth Promoters Industry Revenue (Million) Forecast, by Application 2020 & 2033
Frequently Asked Questions
1. What is the projected Compound Annual Growth Rate (CAGR) of the Animal Growth Promoters Industry?
The projected CAGR is approximately 5.30%.
2. Which companies are prominent players in the Animal Growth Promoters Industry?
Key companies in the market include Bluestar Adisseo, Guangdong VTR Bio-Tech Co Ltd, Biomin GmbH, Novus International Inc, Lotus Minechem Resources Pvt Ltd, Kemin Industries, Chr Hansen A/, BASF SE, DSM, Alltech Inc, Dupont De Nemours Inc, Cargill Inc, Novozymes A/S, Elanco Animal Health Incorporated, Zoetis Inc.
3. What are the main segments of the Animal Growth Promoters Industry?
The market segments include Type, Animal Type.
4. Can you provide details about the market size?
The market size is estimated to be USD 20.80 Million as of 2022.
5. What are some drivers contributing to market growth?
Increased Demand for Meat; Initiatives By the Key Players; Focus on Animal nutrition and Health.
6. What are the notable trends driving market growth?
The Rise in Demand for Meat Boosting the Market.
7. Are there any restraints impacting market growth?
Shift Toward Vegan- Based Diet; Changing Raw Material Prices and Strict Government Rules to Restrict Market Growth.
8. Can you provide examples of recent developments in the market?
N/A
9. What pricing options are available for accessing the report?
Pricing options include single-user, multi-user, and enterprise licenses priced at USD 4750, USD 5250, and USD 8750 respectively.
10. Is the market size provided in terms of value or volume?
The market size is provided in terms of value, measured in Million.
11. Are there any specific market keywords associated with the report?
Yes, the market keyword associated with the report is "Animal Growth Promoters Industry," which aids in identifying and referencing the specific market segment covered.
12. How do I determine which pricing option suits my needs best?
The pricing options vary based on user requirements and access needs. Individual users may opt for single-user licenses, while businesses requiring broader access may choose multi-user or enterprise licenses for cost-effective access to the report.
13. Are there any additional resources or data provided in the Animal Growth Promoters Industry report?
While the report offers comprehensive insights, it's advisable to review the specific contents or supplementary materials provided to ascertain if additional resources or data are available.
14. How can I stay updated on further developments or reports in the Animal Growth Promoters Industry?
To stay informed about further developments, trends, and reports in the Animal Growth Promoters Industry, consider subscribing to industry newsletters, following relevant companies and organizations, or regularly checking reputable industry news sources and publications.
Methodology
Step 1 - Identification of Relevant Samples Size from Population Database


Step 2 - Approaches for Defining Global Market Size (Value, Volume* & Price*)

Note*: In applicable scenarios
Step 3 - Data Sources
Primary Research
- Web Analytics
- Survey Reports
- Research Institute
- Latest Research Reports
- Opinion Leaders
Secondary Research
- Annual Reports
- White Paper
- Latest Press Release
- Industry Association
- Paid Database
- Investor Presentations

Step 4 - Data Triangulation
Involves using different sources of information in order to increase the validity of a study
These sources are likely to be stakeholders in a program - participants, other researchers, program staff, other community members, and so on.
Then we put all data in single framework & apply various statistical tools to find out the dynamic on the market.
During the analysis stage, feedback from the stakeholder groups would be compared to determine areas of agreement as well as areas of divergence