

Key Insights
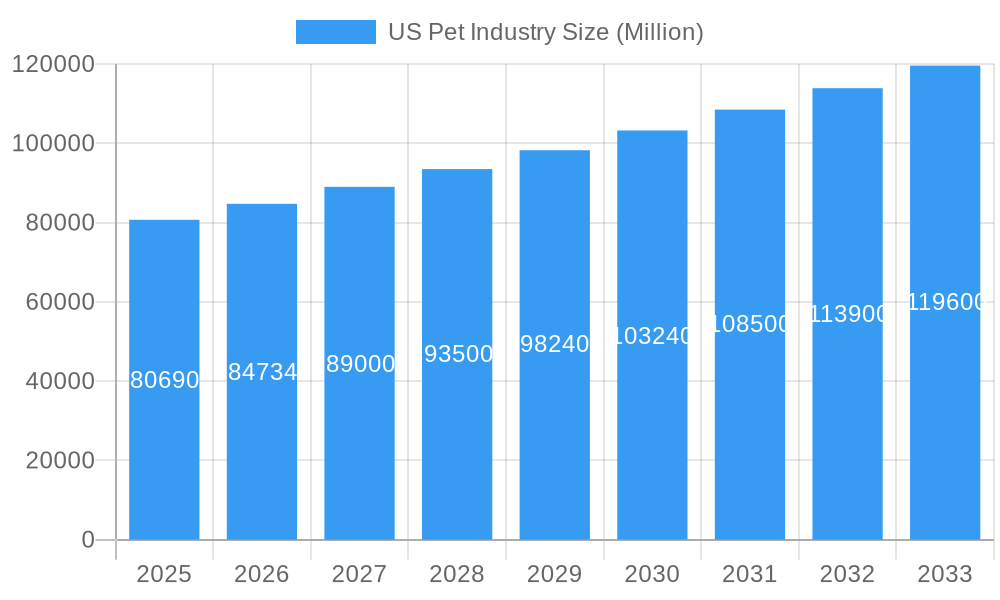
The US pet industry, a robust and expanding market, is projected to reach \$80.69 billion in 2025 and maintain a compound annual growth rate (CAGR) of 5.06% from 2025 to 2033. This growth is fueled by several key factors. Increasing pet ownership, particularly among millennials and Gen Z, contributes significantly to the expanding market. A rising trend of pet humanization, where pets are treated as family members, leads to increased spending on premium pet food, healthcare, and accessories. The growing awareness of pet health and wellness further drives demand for high-quality pet food and veterinary services. E-commerce platforms also play a crucial role, offering convenience and a wider selection of products, thereby boosting online retail sales within the sector. The market is segmented by pet type (dogs, cats, birds, fish, others), product type (food, supplies/OTC medicine, others), and distribution channel (supermarkets, specialty stores, online retailers, others). Competitive dynamics are shaped by major players like Nestlé Purina, Mars Inc., and Hill's Pet Nutrition, alongside smaller, specialized brands focusing on natural and organic products. Regional variations exist, with potentially higher market penetration in states with higher pet ownership rates and disposable incomes. Geographic analysis across the US, covering Northeast, Southeast, Midwest, Southwest, and West regions, reveals varying market dynamics influenced by factors like population density, income levels, and cultural preferences related to pet ownership.
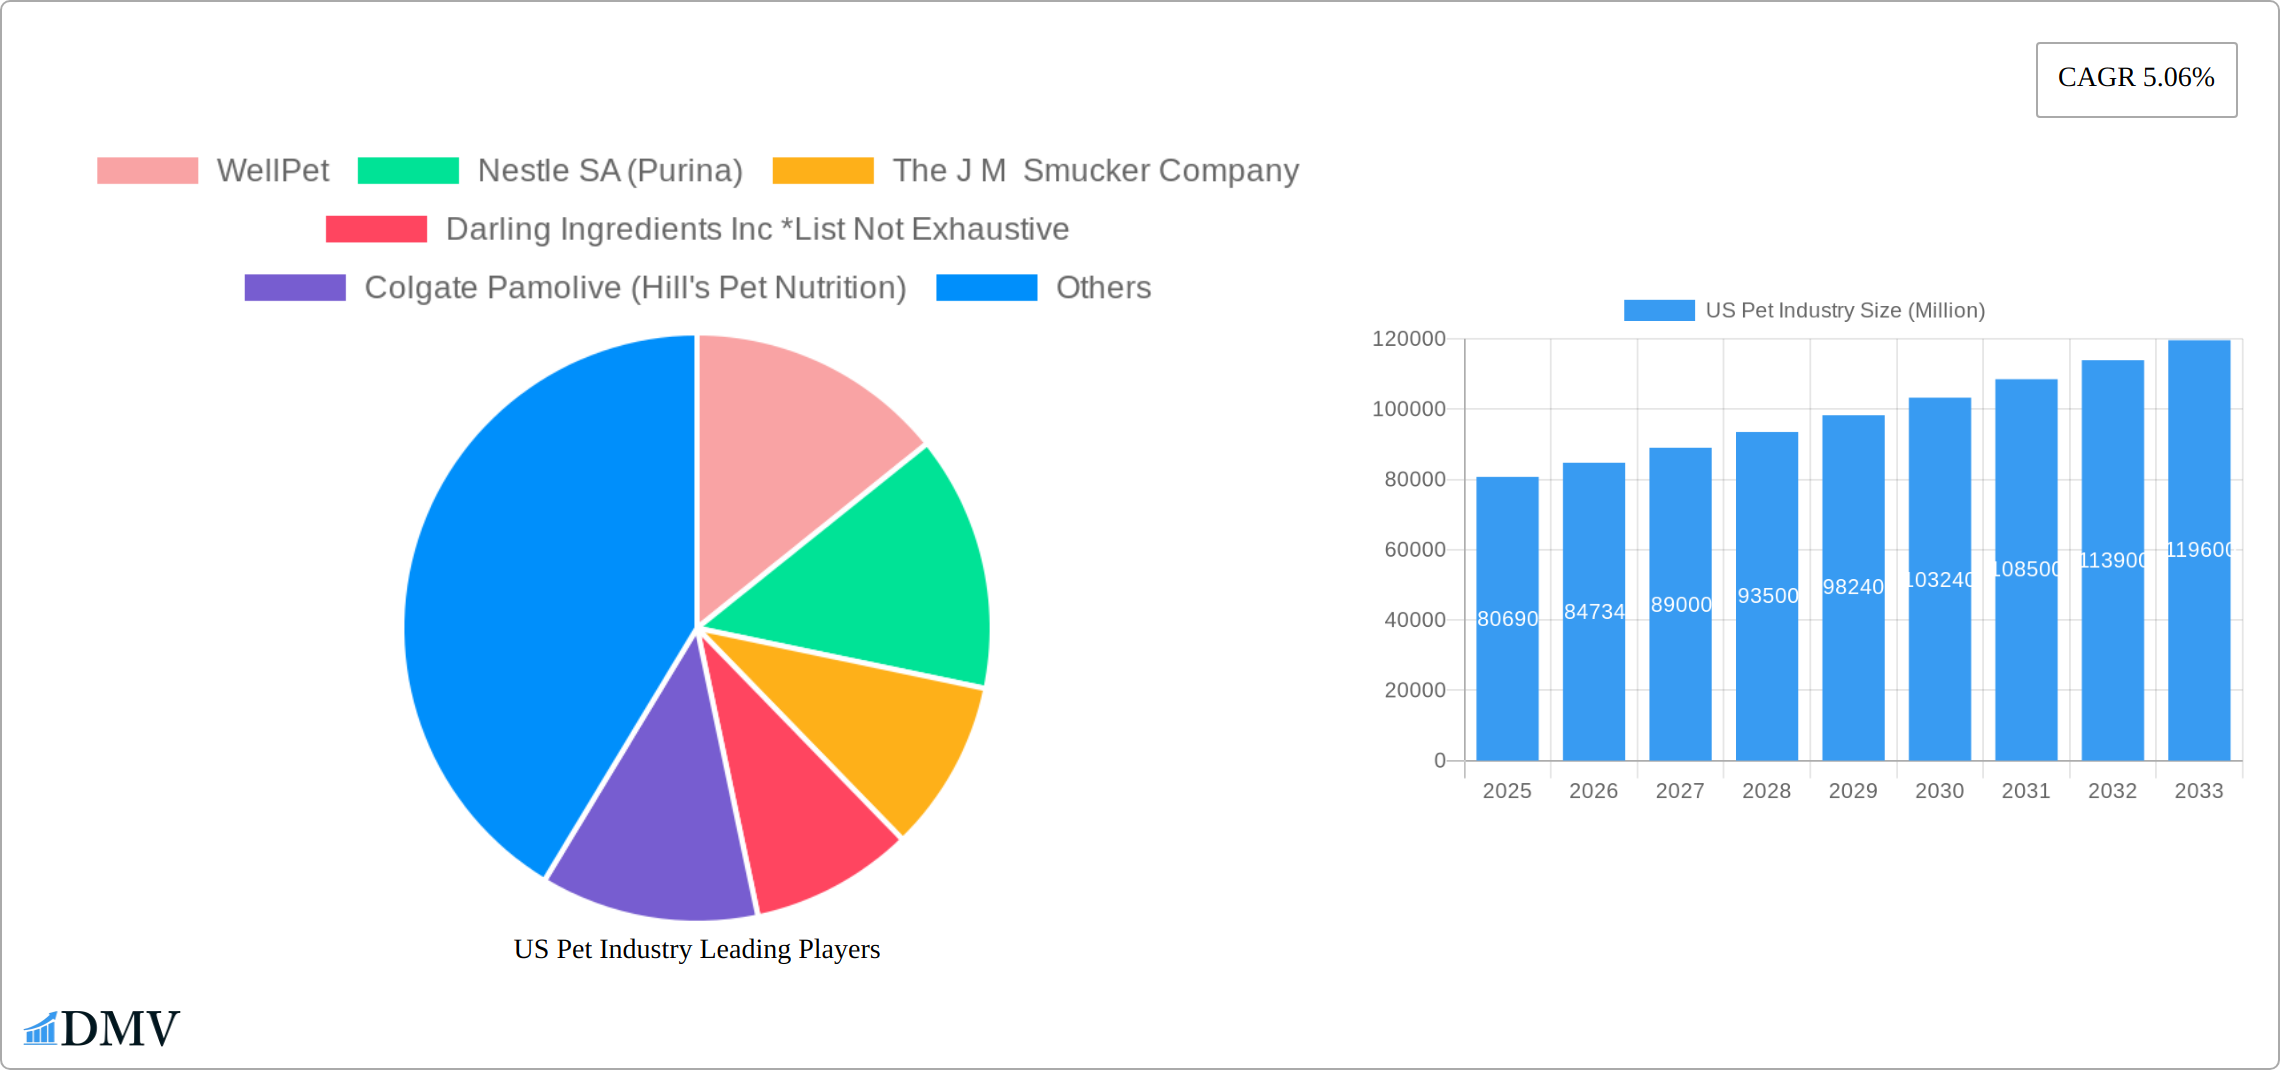
US Pet Industry Market Size (In Billion)
Continued growth in the US pet industry is anticipated due to several factors. Innovation in pet food and pet care products, including functional foods and technologically advanced gadgets, is expected to fuel demand. The increasing availability of pet insurance and veterinary care services also contributes to the market's expansion. Furthermore, the rise of pet-related services like pet sitting, dog walking, and pet grooming further enhances market growth. However, economic downturns could potentially impact consumer spending on discretionary pet products, presenting a challenge to the sector's sustained growth. The industry will need to adapt to these potential challenges through competitive pricing, product diversification, and a focus on value-added services to maintain its robust growth trajectory. The continued focus on premiumization and pet health, along with technological advancements in pet care, should allow the industry to weather economic uncertainties.
US Pet Industry Company Market Share
US Pet Industry Market Report: 2019-2033 Forecast
This comprehensive report provides an in-depth analysis of the US pet industry, offering invaluable insights for stakeholders seeking to navigate this dynamic and rapidly evolving market. With a study period spanning 2019-2033, a base year of 2025, and a forecast period of 2025-2033, this report delivers crucial data and projections to inform strategic decision-making. The US pet industry, valued at xx Million in 2025, is poised for significant growth, driven by key trends and technological advancements.
US Pet Industry Market Composition & Trends
The US pet industry exhibits a moderately concentrated market structure, with key players like Nestle SA (Purina), Mars Inc, and Colgate Palmolive (Hill's Pet Nutrition) holding significant market share. However, smaller players and niche brands continue to emerge, fueled by innovation in pet food formulations (e.g., grain-free, organic options) and pet supplies. The regulatory landscape, particularly concerning pet food safety and labeling, plays a significant role in shaping market dynamics. Substitute products, such as homemade pet food, present a competitive challenge, while the increasing humanization of pets drives demand for premium products and services. The industry is characterized by significant M&A activity, with deal values exceeding xx Million in recent years, indicating ongoing consolidation and expansion efforts.
- Market Share Distribution (2025): Nestle SA (Purina): xx%; Mars Inc: xx%; Colgate Palmolive (Hill's): xx%; Others: xx%
- M&A Deal Value (2019-2024): xx Million
- Key Innovation Catalysts: Growing consumer demand for premium, specialized pet food; technological advancements in pet health monitoring; increased focus on sustainable and ethical sourcing.
- End-User Profiles: Millennials and Gen Z are increasingly adopting pets and driving demand for premium products and services.
US Pet Industry Industry Evolution
The US pet industry has demonstrated remarkable and consistent growth throughout the historical period (2019-2024), achieving a robust Compound Annual Growth Rate (CAGR) of xx%. This upward trajectory is firmly projected to continue through the forecast period (2025-2033), propelled by a confluence of powerful drivers. Technological advancements are revolutionizing pet care; innovations such as smart pet feeders, interactive toys, and sophisticated activity trackers are not only enhancing the well-being and engagement of pets but also significantly contributing to market expansion. Concurrently, a profound shift in consumer behavior is evident, marked by a strong move towards premiumization. Pet owners are increasingly demonstrating a willingness to invest more in high-quality, specialized pet food, advanced veterinary care, and luxury pet products. This growing awareness of pet health and wellness is a key catalyst, further fueling demand for premium and specialized offerings and steering the industry towards a more holistic and comprehensive approach to pet care. The increasing adoption rates of pet insurance and the utilization of veterinary services underscore a heightened focus on preventative care and a commitment to ensuring longer, healthier lifespans for our animal companions. Furthermore, the ever-growing popularity of pet adoption continues to bolster the growth of this dynamic industry segment. Specific, granular data points on growth rates and adoption metrics are comprehensively detailed within the full report.
Leading Regions, Countries, or Segments in US Pet Industry
While the US pet industry exhibits varied growth patterns and market compositions across its vast landscape, a definitive analysis of regionally specific trends is often abstracted due to the pervasive nationwide distribution networks and the emergence of largely homogenous consumer preferences. However, key segments consistently drive the market:
By Pet Type: Dogs and cats remain the dominant segments, collectively representing over xx Million in total market value, reflecting their enduring popularity as cherished family members.
By Product Type: Pet food stands as the undisputed leader in market share, closely followed by essential supplies and over-the-counter medicines. The "other product types" category is increasingly significant, encompassing vital services such as pet insurance, professional grooming, and a diverse array of ancillary products designed to enhance pet life.
By Distribution Channel: Supermarkets/hypermarkets and dedicated specialty pet stores continue to be major pillars of distribution. However, online retail is experiencing explosive growth, offering unparalleled convenience, competitive pricing, and an expansive product selection that is reshaping consumer purchasing habits.
Key Drivers (Dog Segment): The enduring strength of the dog segment is attributed to persistently high pet ownership rates, rising disposable incomes, and an unwavering consumer preference for premium and health-conscious dog food brands.
Key Drivers (Online Retail): The remarkable ascent of online retail is fundamentally driven by its inherent convenience, attractive competitive pricing strategies, and the vast breadth of product selection available to consumers.
US Pet Industry Product Innovations
The US pet industry is a hotbed of innovation, with recent advancements significantly enhancing pet well-being and owner convenience. A major breakthrough is the development of personalized nutrition plans, expertly crafted through the integration of cutting-edge genomics and sophisticated data analytics. This highly individualized approach ensures that pets receive tailored dietary regimens that precisely address their unique needs and any existing health conditions. Beyond nutrition, the realm of advanced pet healthcare technology is rapidly expanding. Innovations such as discreet wearable sensors for continuous health monitoring and accessible telehealth platforms are revolutionizing how pet health is managed, facilitating earlier detection of potential issues and enabling proactive care. These transformative innovations collectively lead to heightened customer satisfaction, demonstrably improve pet welfare, and are powerful drivers of increased sales across the affected product categories.
Propelling Factors for US Pet Industry Growth
Several factors propel the growth of the US pet industry. Technological advancements in pet food and healthcare drive market expansion. The increasing humanization of pets, leading to higher spending on pet products and services, is a major driver. Favorable economic conditions, including rising disposable incomes, contribute significantly to increased pet ownership and spending. The expanding regulatory landscape, while imposing some challenges, ultimately fosters consumer confidence and drives demand for safe and high-quality products.
Obstacles in the US Pet Industry Market
The US pet industry faces several challenges, including supply chain disruptions, impacting product availability and pricing. Stringent regulatory requirements for pet food and medicine increase compliance costs for manufacturers and impact product launch timelines. Intense competition among established brands and new entrants creates price pressure and necessitates continuous innovation. Economic downturns can reduce consumer spending on non-essential pet products.
Future Opportunities in US Pet Industry
Future growth opportunities lie in personalized pet nutrition, leveraging big data and AI. Expansion into the functional food category offering products with health benefits represents significant potential. The growing demand for sustainable and ethically sourced pet food presents an opportunity for companies committed to responsible practices. The increasing adoption of pet insurance and related healthcare services shows potential for significant expansion.
Major Players in the US Pet Industry Ecosystem
- WellPet
- Nestle SA (Purina)
- The J M Smucker Company
- Darling Ingredients Inc
- Colgate Palmolive (Hill's Pet Nutrition)
- Pure and Natural Pet
- United Pet Group Inc
- Diamond Pet Foods
- Blue Buffalo Co Ltd
- Mars Inc
Key Developments in US Pet Industry Industry
- 2022 Q4: A prominent industry player unveiled an innovative new line of personalized pet food, catering to the growing demand for customized pet nutrition.
- 2023 Q1: A significant consolidation occurred with the acquisition of a smaller, specialized pet supply company by a large, established conglomerate, signaling continued market integration.
- 2023 Q3: A forward-thinking tech startup introduced groundbreaking new pet healthcare technology, poised to redefine how pet health is monitored and managed. (A more comprehensive compilation of detailed developments is available in the complete report)
Strategic US Pet Industry Market Forecast
The US pet industry is poised for a period of sustained and robust growth throughout the forecast period (2025-2033). This expansion will be fueled by consistently strong consumer spending patterns and the relentless pace of technological innovation. Significant opportunities are emerging in the personalized pet nutrition sector, the development and adoption of sustainable pet products, and the ongoing evolution of advanced pet healthcare solutions. The market is strategically positioned for continued expansion, with substantial growth potential anticipated across a diverse array of segments and distribution channels. The intensifying emphasis on pet wellness, coupled with the deepening human-animal bond, will continue to serve as powerful and enduring drivers of this promising industry growth.
US Pet Industry Segmentation
-
1. Pet Type
- 1.1. Dog
- 1.2. Cat
- 1.3. Bird
- 1.4. Fresh Water Fish
- 1.5. Other Pet Types
-
2. Product Type
- 2.1. Food
- 2.2. Supplies/OTC Medicine
- 2.3. Other Product Types
-
3. Distribution Channel
- 3.1. Supermarkets/Hypermarkets
- 3.2. Specialty Stores
- 3.3. Online Retail Stores
- 3.4. Other Distribution Channels
US Pet Industry Segmentation By Geography
-
1. North America
- 1.1. United States
- 1.2. Canada
- 1.3. Mexico
-
2. South America
- 2.1. Brazil
- 2.2. Argentina
- 2.3. Rest of South America
-
3. Europe
- 3.1. United Kingdom
- 3.2. Germany
- 3.3. France
- 3.4. Italy
- 3.5. Spain
- 3.6. Russia
- 3.7. Benelux
- 3.8. Nordics
- 3.9. Rest of Europe
-
4. Middle East & Africa
- 4.1. Turkey
- 4.2. Israel
- 4.3. GCC
- 4.4. North Africa
- 4.5. South Africa
- 4.6. Rest of Middle East & Africa
-
5. Asia Pacific
- 5.1. China
- 5.2. India
- 5.3. Japan
- 5.4. South Korea
- 5.5. ASEAN
- 5.6. Oceania
- 5.7. Rest of Asia Pacific
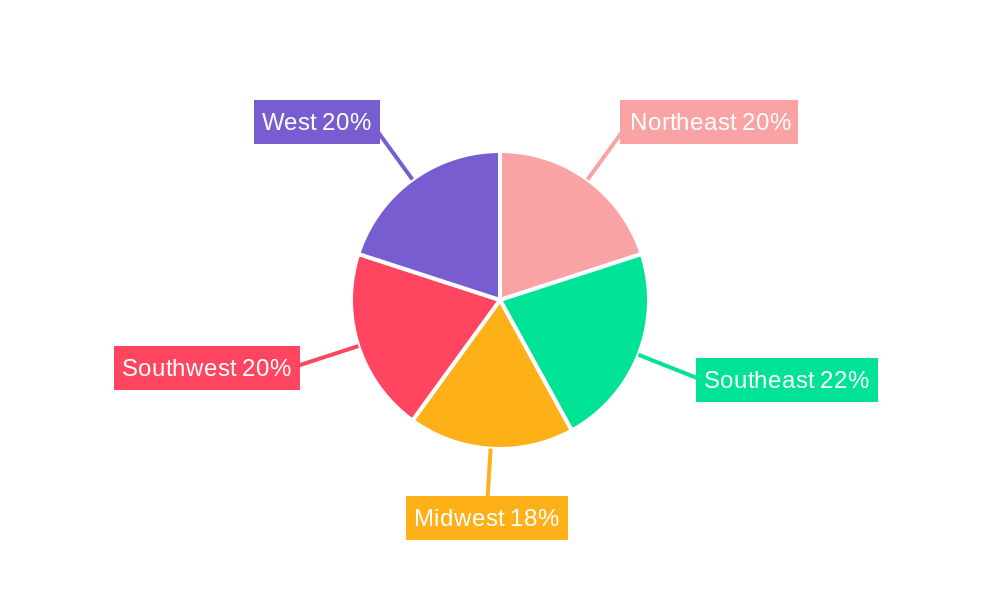
US Pet Industry Regional Market Share
Geographic Coverage of US Pet Industry
US Pet Industry REPORT HIGHLIGHTS
| Aspects | Details |
|---|---|
| Study Period | 2020-2034 |
| Base Year | 2025 |
| Estimated Year | 2026 |
| Forecast Period | 2026-2034 |
| Historical Period | 2020-2025 |
| Growth Rate | CAGR of 5.06% from 2020-2034 |
| Segmentation |
|
Table of Contents
- 1. Introduction
- 1.1. Research Scope
- 1.2. Market Segmentation
- 1.3. Research Methodology
- 1.4. Definitions and Assumptions
- 2. Executive Summary
- 2.1. Introduction
- 3. Market Dynamics
- 3.1. Introduction
- 3.2. Market Drivers
- 3.2.1. Increased Pet Humanization; Growing Trend of E-commerce
- 3.3. Market Restrains
- 3.3.1. Rising Cost of Raw Material Production; Growing Concern Over Environment and Pet Health
- 3.4. Market Trends
- 3.4.1. Increase in the Number of Pet Owners and Increased Expenditures on Pets
- 4. Market Factor Analysis
- 4.1. Porters Five Forces
- 4.2. Supply/Value Chain
- 4.3. PESTEL analysis
- 4.4. Market Entropy
- 4.5. Patent/Trademark Analysis
- 5. Global US Pet Industry Analysis, Insights and Forecast, 2020-2032
- 5.1. Market Analysis, Insights and Forecast - by Pet Type
- 5.1.1. Dog
- 5.1.2. Cat
- 5.1.3. Bird
- 5.1.4. Fresh Water Fish
- 5.1.5. Other Pet Types
- 5.2. Market Analysis, Insights and Forecast - by Product Type
- 5.2.1. Food
- 5.2.2. Supplies/OTC Medicine
- 5.2.3. Other Product Types
- 5.3. Market Analysis, Insights and Forecast - by Distribution Channel
- 5.3.1. Supermarkets/Hypermarkets
- 5.3.2. Specialty Stores
- 5.3.3. Online Retail Stores
- 5.3.4. Other Distribution Channels
- 5.4. Market Analysis, Insights and Forecast - by Region
- 5.4.1. North America
- 5.4.2. South America
- 5.4.3. Europe
- 5.4.4. Middle East & Africa
- 5.4.5. Asia Pacific
- 5.1. Market Analysis, Insights and Forecast - by Pet Type
- 6. North America US Pet Industry Analysis, Insights and Forecast, 2020-2032
- 6.1. Market Analysis, Insights and Forecast - by Pet Type
- 6.1.1. Dog
- 6.1.2. Cat
- 6.1.3. Bird
- 6.1.4. Fresh Water Fish
- 6.1.5. Other Pet Types
- 6.2. Market Analysis, Insights and Forecast - by Product Type
- 6.2.1. Food
- 6.2.2. Supplies/OTC Medicine
- 6.2.3. Other Product Types
- 6.3. Market Analysis, Insights and Forecast - by Distribution Channel
- 6.3.1. Supermarkets/Hypermarkets
- 6.3.2. Specialty Stores
- 6.3.3. Online Retail Stores
- 6.3.4. Other Distribution Channels
- 6.1. Market Analysis, Insights and Forecast - by Pet Type
- 7. South America US Pet Industry Analysis, Insights and Forecast, 2020-2032
- 7.1. Market Analysis, Insights and Forecast - by Pet Type
- 7.1.1. Dog
- 7.1.2. Cat
- 7.1.3. Bird
- 7.1.4. Fresh Water Fish
- 7.1.5. Other Pet Types
- 7.2. Market Analysis, Insights and Forecast - by Product Type
- 7.2.1. Food
- 7.2.2. Supplies/OTC Medicine
- 7.2.3. Other Product Types
- 7.3. Market Analysis, Insights and Forecast - by Distribution Channel
- 7.3.1. Supermarkets/Hypermarkets
- 7.3.2. Specialty Stores
- 7.3.3. Online Retail Stores
- 7.3.4. Other Distribution Channels
- 7.1. Market Analysis, Insights and Forecast - by Pet Type
- 8. Europe US Pet Industry Analysis, Insights and Forecast, 2020-2032
- 8.1. Market Analysis, Insights and Forecast - by Pet Type
- 8.1.1. Dog
- 8.1.2. Cat
- 8.1.3. Bird
- 8.1.4. Fresh Water Fish
- 8.1.5. Other Pet Types
- 8.2. Market Analysis, Insights and Forecast - by Product Type
- 8.2.1. Food
- 8.2.2. Supplies/OTC Medicine
- 8.2.3. Other Product Types
- 8.3. Market Analysis, Insights and Forecast - by Distribution Channel
- 8.3.1. Supermarkets/Hypermarkets
- 8.3.2. Specialty Stores
- 8.3.3. Online Retail Stores
- 8.3.4. Other Distribution Channels
- 8.1. Market Analysis, Insights and Forecast - by Pet Type
- 9. Middle East & Africa US Pet Industry Analysis, Insights and Forecast, 2020-2032
- 9.1. Market Analysis, Insights and Forecast - by Pet Type
- 9.1.1. Dog
- 9.1.2. Cat
- 9.1.3. Bird
- 9.1.4. Fresh Water Fish
- 9.1.5. Other Pet Types
- 9.2. Market Analysis, Insights and Forecast - by Product Type
- 9.2.1. Food
- 9.2.2. Supplies/OTC Medicine
- 9.2.3. Other Product Types
- 9.3. Market Analysis, Insights and Forecast - by Distribution Channel
- 9.3.1. Supermarkets/Hypermarkets
- 9.3.2. Specialty Stores
- 9.3.3. Online Retail Stores
- 9.3.4. Other Distribution Channels
- 9.1. Market Analysis, Insights and Forecast - by Pet Type
- 10. Asia Pacific US Pet Industry Analysis, Insights and Forecast, 2020-2032
- 10.1. Market Analysis, Insights and Forecast - by Pet Type
- 10.1.1. Dog
- 10.1.2. Cat
- 10.1.3. Bird
- 10.1.4. Fresh Water Fish
- 10.1.5. Other Pet Types
- 10.2. Market Analysis, Insights and Forecast - by Product Type
- 10.2.1. Food
- 10.2.2. Supplies/OTC Medicine
- 10.2.3. Other Product Types
- 10.3. Market Analysis, Insights and Forecast - by Distribution Channel
- 10.3.1. Supermarkets/Hypermarkets
- 10.3.2. Specialty Stores
- 10.3.3. Online Retail Stores
- 10.3.4. Other Distribution Channels
- 10.1. Market Analysis, Insights and Forecast - by Pet Type
- 11. Competitive Analysis
- 11.1. Global Market Share Analysis 2025
- 11.2. Company Profiles
- 11.2.1 WellPet
- 11.2.1.1. Overview
- 11.2.1.2. Products
- 11.2.1.3. SWOT Analysis
- 11.2.1.4. Recent Developments
- 11.2.1.5. Financials (Based on Availability)
- 11.2.2 Nestle SA (Purina)
- 11.2.2.1. Overview
- 11.2.2.2. Products
- 11.2.2.3. SWOT Analysis
- 11.2.2.4. Recent Developments
- 11.2.2.5. Financials (Based on Availability)
- 11.2.3 The J M Smucker Company
- 11.2.3.1. Overview
- 11.2.3.2. Products
- 11.2.3.3. SWOT Analysis
- 11.2.3.4. Recent Developments
- 11.2.3.5. Financials (Based on Availability)
- 11.2.4 Darling Ingredients Inc *List Not Exhaustive
- 11.2.4.1. Overview
- 11.2.4.2. Products
- 11.2.4.3. SWOT Analysis
- 11.2.4.4. Recent Developments
- 11.2.4.5. Financials (Based on Availability)
- 11.2.5 Colgate Pamolive (Hill's Pet Nutrition)
- 11.2.5.1. Overview
- 11.2.5.2. Products
- 11.2.5.3. SWOT Analysis
- 11.2.5.4. Recent Developments
- 11.2.5.5. Financials (Based on Availability)
- 11.2.6 Pure and Natural Pet
- 11.2.6.1. Overview
- 11.2.6.2. Products
- 11.2.6.3. SWOT Analysis
- 11.2.6.4. Recent Developments
- 11.2.6.5. Financials (Based on Availability)
- 11.2.7 United Pet Group Inc
- 11.2.7.1. Overview
- 11.2.7.2. Products
- 11.2.7.3. SWOT Analysis
- 11.2.7.4. Recent Developments
- 11.2.7.5. Financials (Based on Availability)
- 11.2.8 Diamond Pet Foods
- 11.2.8.1. Overview
- 11.2.8.2. Products
- 11.2.8.3. SWOT Analysis
- 11.2.8.4. Recent Developments
- 11.2.8.5. Financials (Based on Availability)
- 11.2.9 Blue Buffalo Co Ltd
- 11.2.9.1. Overview
- 11.2.9.2. Products
- 11.2.9.3. SWOT Analysis
- 11.2.9.4. Recent Developments
- 11.2.9.5. Financials (Based on Availability)
- 11.2.10 Mars Inc
- 11.2.10.1. Overview
- 11.2.10.2. Products
- 11.2.10.3. SWOT Analysis
- 11.2.10.4. Recent Developments
- 11.2.10.5. Financials (Based on Availability)
- 11.2.1 WellPet
List of Figures
- Figure 1: Global US Pet Industry Revenue Breakdown (Million, %) by Region 2025 & 2033
- Figure 2: North America US Pet Industry Revenue (Million), by Pet Type 2025 & 2033
- Figure 3: North America US Pet Industry Revenue Share (%), by Pet Type 2025 & 2033
- Figure 4: North America US Pet Industry Revenue (Million), by Product Type 2025 & 2033
- Figure 5: North America US Pet Industry Revenue Share (%), by Product Type 2025 & 2033
- Figure 6: North America US Pet Industry Revenue (Million), by Distribution Channel 2025 & 2033
- Figure 7: North America US Pet Industry Revenue Share (%), by Distribution Channel 2025 & 2033
- Figure 8: North America US Pet Industry Revenue (Million), by Country 2025 & 2033
- Figure 9: North America US Pet Industry Revenue Share (%), by Country 2025 & 2033
- Figure 10: South America US Pet Industry Revenue (Million), by Pet Type 2025 & 2033
- Figure 11: South America US Pet Industry Revenue Share (%), by Pet Type 2025 & 2033
- Figure 12: South America US Pet Industry Revenue (Million), by Product Type 2025 & 2033
- Figure 13: South America US Pet Industry Revenue Share (%), by Product Type 2025 & 2033
- Figure 14: South America US Pet Industry Revenue (Million), by Distribution Channel 2025 & 2033
- Figure 15: South America US Pet Industry Revenue Share (%), by Distribution Channel 2025 & 2033
- Figure 16: South America US Pet Industry Revenue (Million), by Country 2025 & 2033
- Figure 17: South America US Pet Industry Revenue Share (%), by Country 2025 & 2033
- Figure 18: Europe US Pet Industry Revenue (Million), by Pet Type 2025 & 2033
- Figure 19: Europe US Pet Industry Revenue Share (%), by Pet Type 2025 & 2033
- Figure 20: Europe US Pet Industry Revenue (Million), by Product Type 2025 & 2033
- Figure 21: Europe US Pet Industry Revenue Share (%), by Product Type 2025 & 2033
- Figure 22: Europe US Pet Industry Revenue (Million), by Distribution Channel 2025 & 2033
- Figure 23: Europe US Pet Industry Revenue Share (%), by Distribution Channel 2025 & 2033
- Figure 24: Europe US Pet Industry Revenue (Million), by Country 2025 & 2033
- Figure 25: Europe US Pet Industry Revenue Share (%), by Country 2025 & 2033
- Figure 26: Middle East & Africa US Pet Industry Revenue (Million), by Pet Type 2025 & 2033
- Figure 27: Middle East & Africa US Pet Industry Revenue Share (%), by Pet Type 2025 & 2033
- Figure 28: Middle East & Africa US Pet Industry Revenue (Million), by Product Type 2025 & 2033
- Figure 29: Middle East & Africa US Pet Industry Revenue Share (%), by Product Type 2025 & 2033
- Figure 30: Middle East & Africa US Pet Industry Revenue (Million), by Distribution Channel 2025 & 2033
- Figure 31: Middle East & Africa US Pet Industry Revenue Share (%), by Distribution Channel 2025 & 2033
- Figure 32: Middle East & Africa US Pet Industry Revenue (Million), by Country 2025 & 2033
- Figure 33: Middle East & Africa US Pet Industry Revenue Share (%), by Country 2025 & 2033
- Figure 34: Asia Pacific US Pet Industry Revenue (Million), by Pet Type 2025 & 2033
- Figure 35: Asia Pacific US Pet Industry Revenue Share (%), by Pet Type 2025 & 2033
- Figure 36: Asia Pacific US Pet Industry Revenue (Million), by Product Type 2025 & 2033
- Figure 37: Asia Pacific US Pet Industry Revenue Share (%), by Product Type 2025 & 2033
- Figure 38: Asia Pacific US Pet Industry Revenue (Million), by Distribution Channel 2025 & 2033
- Figure 39: Asia Pacific US Pet Industry Revenue Share (%), by Distribution Channel 2025 & 2033
- Figure 40: Asia Pacific US Pet Industry Revenue (Million), by Country 2025 & 2033
- Figure 41: Asia Pacific US Pet Industry Revenue Share (%), by Country 2025 & 2033
List of Tables
- Table 1: Global US Pet Industry Revenue Million Forecast, by Pet Type 2020 & 2033
- Table 2: Global US Pet Industry Revenue Million Forecast, by Product Type 2020 & 2033
- Table 3: Global US Pet Industry Revenue Million Forecast, by Distribution Channel 2020 & 2033
- Table 4: Global US Pet Industry Revenue Million Forecast, by Region 2020 & 2033
- Table 5: Global US Pet Industry Revenue Million Forecast, by Pet Type 2020 & 2033
- Table 6: Global US Pet Industry Revenue Million Forecast, by Product Type 2020 & 2033
- Table 7: Global US Pet Industry Revenue Million Forecast, by Distribution Channel 2020 & 2033
- Table 8: Global US Pet Industry Revenue Million Forecast, by Country 2020 & 2033
- Table 9: United States US Pet Industry Revenue (Million) Forecast, by Application 2020 & 2033
- Table 10: Canada US Pet Industry Revenue (Million) Forecast, by Application 2020 & 2033
- Table 11: Mexico US Pet Industry Revenue (Million) Forecast, by Application 2020 & 2033
- Table 12: Global US Pet Industry Revenue Million Forecast, by Pet Type 2020 & 2033
- Table 13: Global US Pet Industry Revenue Million Forecast, by Product Type 2020 & 2033
- Table 14: Global US Pet Industry Revenue Million Forecast, by Distribution Channel 2020 & 2033
- Table 15: Global US Pet Industry Revenue Million Forecast, by Country 2020 & 2033
- Table 16: Brazil US Pet Industry Revenue (Million) Forecast, by Application 2020 & 2033
- Table 17: Argentina US Pet Industry Revenue (Million) Forecast, by Application 2020 & 2033
- Table 18: Rest of South America US Pet Industry Revenue (Million) Forecast, by Application 2020 & 2033
- Table 19: Global US Pet Industry Revenue Million Forecast, by Pet Type 2020 & 2033
- Table 20: Global US Pet Industry Revenue Million Forecast, by Product Type 2020 & 2033
- Table 21: Global US Pet Industry Revenue Million Forecast, by Distribution Channel 2020 & 2033
- Table 22: Global US Pet Industry Revenue Million Forecast, by Country 2020 & 2033
- Table 23: United Kingdom US Pet Industry Revenue (Million) Forecast, by Application 2020 & 2033
- Table 24: Germany US Pet Industry Revenue (Million) Forecast, by Application 2020 & 2033
- Table 25: France US Pet Industry Revenue (Million) Forecast, by Application 2020 & 2033
- Table 26: Italy US Pet Industry Revenue (Million) Forecast, by Application 2020 & 2033
- Table 27: Spain US Pet Industry Revenue (Million) Forecast, by Application 2020 & 2033
- Table 28: Russia US Pet Industry Revenue (Million) Forecast, by Application 2020 & 2033
- Table 29: Benelux US Pet Industry Revenue (Million) Forecast, by Application 2020 & 2033
- Table 30: Nordics US Pet Industry Revenue (Million) Forecast, by Application 2020 & 2033
- Table 31: Rest of Europe US Pet Industry Revenue (Million) Forecast, by Application 2020 & 2033
- Table 32: Global US Pet Industry Revenue Million Forecast, by Pet Type 2020 & 2033
- Table 33: Global US Pet Industry Revenue Million Forecast, by Product Type 2020 & 2033
- Table 34: Global US Pet Industry Revenue Million Forecast, by Distribution Channel 2020 & 2033
- Table 35: Global US Pet Industry Revenue Million Forecast, by Country 2020 & 2033
- Table 36: Turkey US Pet Industry Revenue (Million) Forecast, by Application 2020 & 2033
- Table 37: Israel US Pet Industry Revenue (Million) Forecast, by Application 2020 & 2033
- Table 38: GCC US Pet Industry Revenue (Million) Forecast, by Application 2020 & 2033
- Table 39: North Africa US Pet Industry Revenue (Million) Forecast, by Application 2020 & 2033
- Table 40: South Africa US Pet Industry Revenue (Million) Forecast, by Application 2020 & 2033
- Table 41: Rest of Middle East & Africa US Pet Industry Revenue (Million) Forecast, by Application 2020 & 2033
- Table 42: Global US Pet Industry Revenue Million Forecast, by Pet Type 2020 & 2033
- Table 43: Global US Pet Industry Revenue Million Forecast, by Product Type 2020 & 2033
- Table 44: Global US Pet Industry Revenue Million Forecast, by Distribution Channel 2020 & 2033
- Table 45: Global US Pet Industry Revenue Million Forecast, by Country 2020 & 2033
- Table 46: China US Pet Industry Revenue (Million) Forecast, by Application 2020 & 2033
- Table 47: India US Pet Industry Revenue (Million) Forecast, by Application 2020 & 2033
- Table 48: Japan US Pet Industry Revenue (Million) Forecast, by Application 2020 & 2033
- Table 49: South Korea US Pet Industry Revenue (Million) Forecast, by Application 2020 & 2033
- Table 50: ASEAN US Pet Industry Revenue (Million) Forecast, by Application 2020 & 2033
- Table 51: Oceania US Pet Industry Revenue (Million) Forecast, by Application 2020 & 2033
- Table 52: Rest of Asia Pacific US Pet Industry Revenue (Million) Forecast, by Application 2020 & 2033
Frequently Asked Questions
1. What is the projected Compound Annual Growth Rate (CAGR) of the US Pet Industry?
The projected CAGR is approximately 5.06%.
2. Which companies are prominent players in the US Pet Industry?
Key companies in the market include WellPet, Nestle SA (Purina), The J M Smucker Company, Darling Ingredients Inc *List Not Exhaustive, Colgate Pamolive (Hill's Pet Nutrition), Pure and Natural Pet, United Pet Group Inc, Diamond Pet Foods, Blue Buffalo Co Ltd, Mars Inc.
3. What are the main segments of the US Pet Industry?
The market segments include Pet Type, Product Type, Distribution Channel.
4. Can you provide details about the market size?
The market size is estimated to be USD 80.69 Million as of 2022.
5. What are some drivers contributing to market growth?
Increased Pet Humanization; Growing Trend of E-commerce.
6. What are the notable trends driving market growth?
Increase in the Number of Pet Owners and Increased Expenditures on Pets.
7. Are there any restraints impacting market growth?
Rising Cost of Raw Material Production; Growing Concern Over Environment and Pet Health.
8. Can you provide examples of recent developments in the market?
N/A
9. What pricing options are available for accessing the report?
Pricing options include single-user, multi-user, and enterprise licenses priced at USD 3800, USD 4500, and USD 5800 respectively.
10. Is the market size provided in terms of value or volume?
The market size is provided in terms of value, measured in Million.
11. Are there any specific market keywords associated with the report?
Yes, the market keyword associated with the report is "US Pet Industry," which aids in identifying and referencing the specific market segment covered.
12. How do I determine which pricing option suits my needs best?
The pricing options vary based on user requirements and access needs. Individual users may opt for single-user licenses, while businesses requiring broader access may choose multi-user or enterprise licenses for cost-effective access to the report.
13. Are there any additional resources or data provided in the US Pet Industry report?
While the report offers comprehensive insights, it's advisable to review the specific contents or supplementary materials provided to ascertain if additional resources or data are available.
14. How can I stay updated on further developments or reports in the US Pet Industry?
To stay informed about further developments, trends, and reports in the US Pet Industry, consider subscribing to industry newsletters, following relevant companies and organizations, or regularly checking reputable industry news sources and publications.
Methodology
Step 1 - Identification of Relevant Samples Size from Population Database


Step 2 - Approaches for Defining Global Market Size (Value, Volume* & Price*)

Note*: In applicable scenarios
Step 3 - Data Sources
Primary Research
- Web Analytics
- Survey Reports
- Research Institute
- Latest Research Reports
- Opinion Leaders
Secondary Research
- Annual Reports
- White Paper
- Latest Press Release
- Industry Association
- Paid Database
- Investor Presentations

Step 4 - Data Triangulation
Involves using different sources of information in order to increase the validity of a study
These sources are likely to be stakeholders in a program - participants, other researchers, program staff, other community members, and so on.
Then we put all data in single framework & apply various statistical tools to find out the dynamic on the market.
During the analysis stage, feedback from the stakeholder groups would be compared to determine areas of agreement as well as areas of divergence