

Key Insights
The global Through Hole Passive Components market is poised for significant expansion, projected to reach an estimated $6,676 million by 2025, with a robust Compound Annual Growth Rate (CAGR) of 7.1% expected to continue through 2033. This upward trajectory is primarily fueled by the ever-increasing demand from the consumer electronics sector, where devices are becoming more sophisticated and require a higher density of reliable passive components. The automotive industry's rapid transition towards electric vehicles (EVs) and advanced driver-assistance systems (ADAS) is another major driver, necessitating durable and high-performance components for critical functions. Furthermore, the burgeoning growth in IT and telecommunication infrastructure, including 5G deployment and data center expansion, will continue to propel market growth. Industrial automation and the increasing adoption of smart grid technologies are also contributing factors, underscoring the pervasive need for these fundamental electronic building blocks across diverse applications.
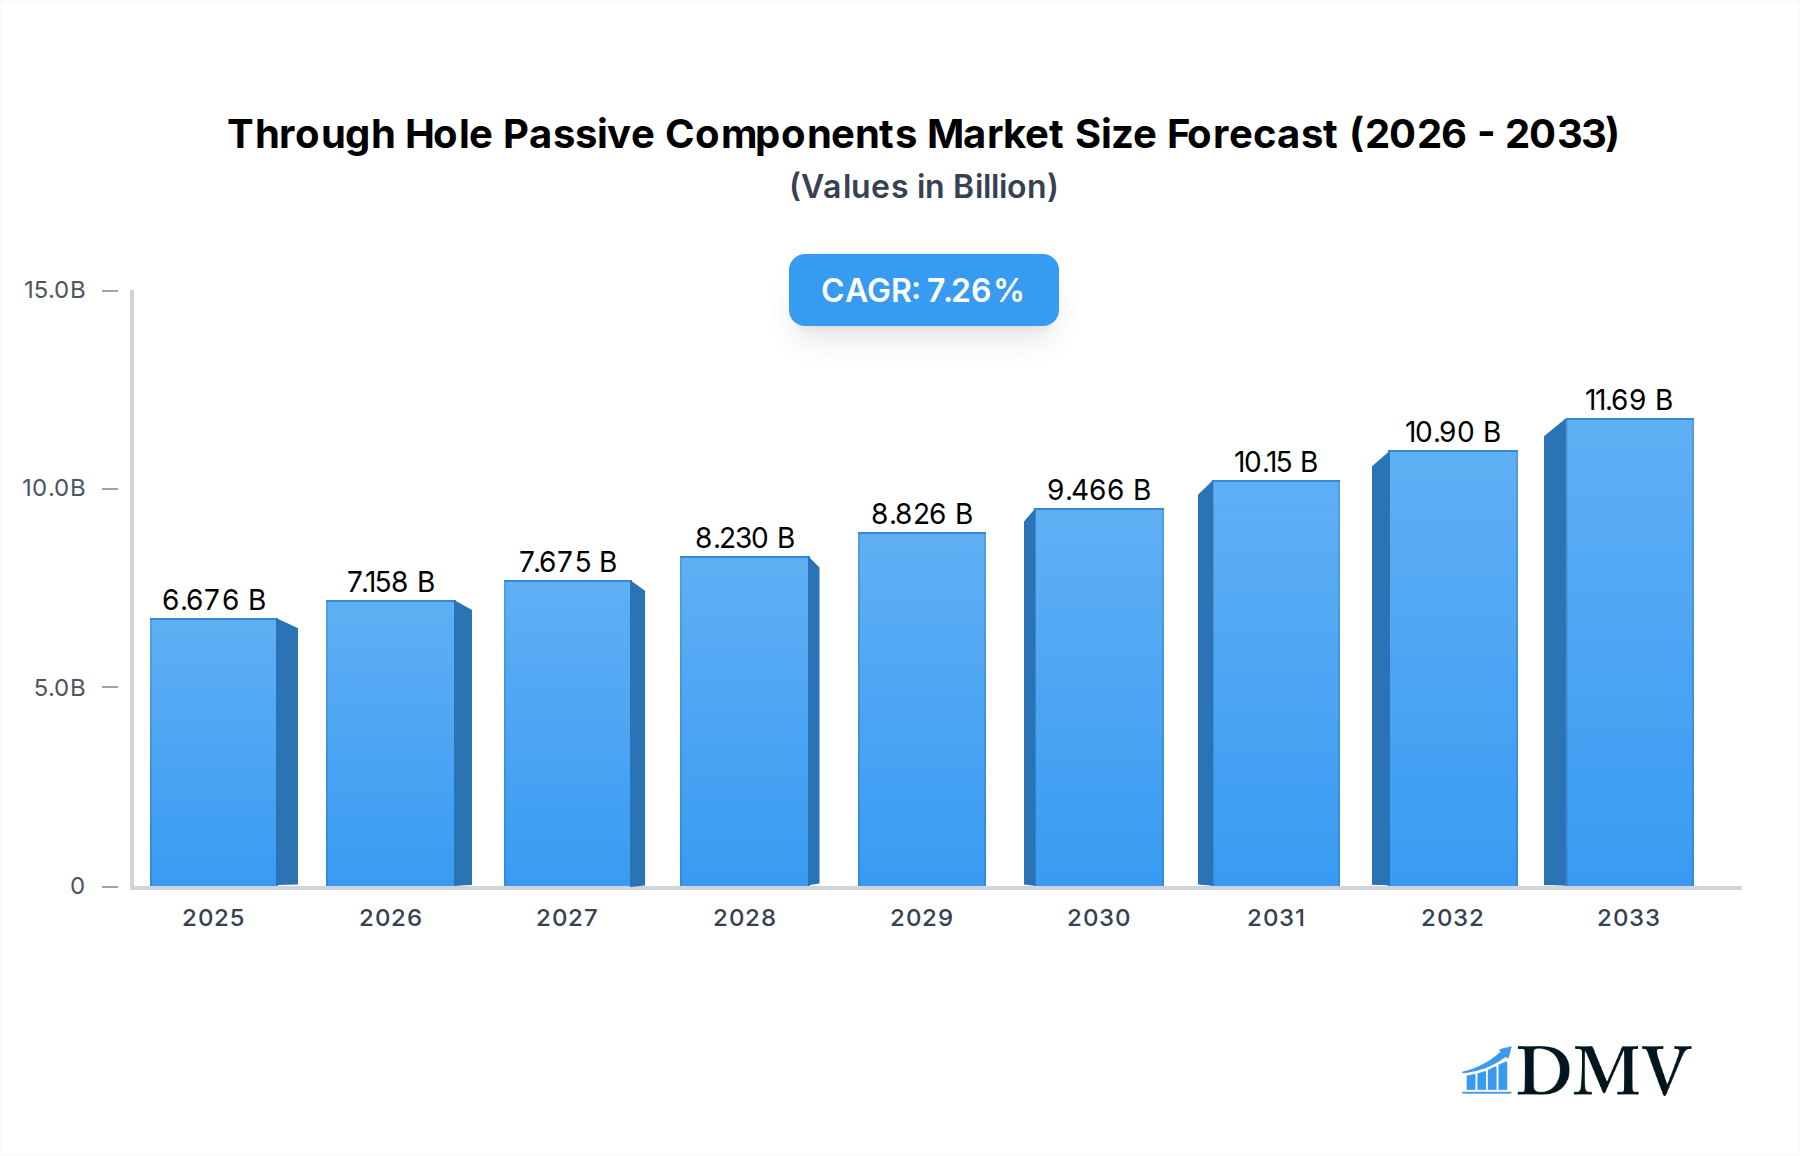
Through Hole Passive Components Market Size (In Billion)
The market's robust growth is further supported by ongoing technological advancements and an expanding range of applications for through-hole passive components. Innovations in material science and manufacturing processes are leading to enhanced performance, miniaturization, and cost-effectiveness, making them increasingly attractive for new product development. While the market benefits from strong demand, it also faces certain restraints. The increasing adoption of surface-mount technology (SMT) in certain high-volume, miniaturized applications presents a competitive challenge, particularly where space and weight are paramount. However, through-hole components retain their advantage in applications requiring greater robustness, higher power handling, and simpler assembly processes, especially in industrial and automotive environments. The market is characterized by a highly competitive landscape with key players like Murata Manufacturing, TDK Corporation, and YAGEO Group driving innovation and market share. The Asia Pacific region is expected to dominate the market, owing to its extensive manufacturing base and burgeoning consumer electronics and automotive industries.

Through Hole Passive Components Company Market Share
Through Hole Passive Components Market: Comprehensive Analysis and Future Outlook (2019–2033)
This in-depth market research report provides a thorough examination of the global through hole passive components market, analyzing its current state, historical trends, and projecting its trajectory through 2033. Covering critical aspects from market composition and technological evolution to regional dominance and strategic forecasting, this report is an indispensable resource for stakeholders seeking to understand and capitalize on opportunities within this vital sector of the electronics industry.
Through Hole Passive Components Market Composition & Trends
The through hole passive components market exhibits a moderate level of concentration, with leading manufacturers like Murata Manufacturing Co., Ltd, YAGEO Group, Panasonic Holdings Corporation, and KEMET Corporation holding significant market shares. Innovation catalysts are primarily driven by the escalating demand for miniaturization, higher power handling capabilities, and enhanced reliability across diverse applications. Regulatory landscapes, particularly concerning environmental compliance and component standards, continue to shape product development and manufacturing processes. Substitute products, while emerging in certain niches like surface-mount technology (SMT) components, have not entirely displaced through-hole solutions due to their inherent advantages in robustness and ease of assembly for specific applications. End-user profiles are diverse, ranging from high-volume consumer electronics manufacturers to specialized industrial and defense contractors. Mergers and acquisitions (M&A) activities, valued in the millions of dollars, are observed as companies seek to consolidate their market positions, acquire new technologies, and expand their product portfolios. For instance, recent M&A deals have aimed at integrating advanced material science capabilities and expanding geographic reach, contributing to an estimated market value of over $XXX million. The market share distribution among the top 10 players is estimated to be around 65%, with the remaining share fragmented across smaller, specialized manufacturers.
Through Hole Passive Components Industry Evolution
The through hole passive components industry has undergone significant evolution driven by relentless technological advancements and the dynamic demands of a rapidly digitizing world. From its historical roots in basic circuit building, the industry has seen a continuous push for enhanced performance characteristics, including higher capacitance, lower ESR (Equivalent Series Resistance), tighter tolerances, and improved thermal management. The historical period from 2019 to 2024 witnessed steady growth, fueled by the expansion of the Internet of Things (IoT), the proliferation of 5G infrastructure, and the increasing complexity of automotive electronics. During this time, the market value for through hole passive components is estimated to have grown from approximately $XXX million to $XXX million, reflecting an average annual growth rate of XX%. The base year, 2025, is projected to see the market value reach $XXX million, with an estimated growth rate of XX%. This growth is underpinned by several key technological breakthroughs. For example, advancements in material science have led to the development of new dielectric materials for capacitors, offering higher energy density and operating voltages. Similarly, innovations in manufacturing processes have allowed for the production of resistors with improved power dissipation capabilities and greater stability under harsh environmental conditions.
Consumer demand has also played a pivotal role in shaping the industry's evolution. The ever-growing appetite for more powerful, efficient, and feature-rich consumer electronics, such as smartphones, wearable devices, and advanced home entertainment systems, necessitates the use of robust and reliable passive components. The automotive sector’s transition towards electric vehicles (EVs) and autonomous driving technologies has further amplified the demand for high-performance through hole passive components capable of withstanding extreme temperatures and vibrations, and providing critical power management functions. The IT and telecommunication sector continues to be a major consumer, with the ongoing deployment of next-generation networks demanding high-frequency and high-power passives. The industrial sector's increasing adoption of automation and smart manufacturing solutions also contributes significantly to market growth. The forecast period from 2025 to 2033 anticipates a continued upward trajectory, with the market value projected to reach $XXX million by 2033, exhibiting a Compound Annual Growth Rate (CAGR) of approximately XX%. This sustained growth is expected to be driven by ongoing miniaturization trends, the increasing integration of advanced functionalities in electronic devices, and the sustained demand from emerging applications.
Leading Regions, Countries, or Segments in Through Hole Passive Components
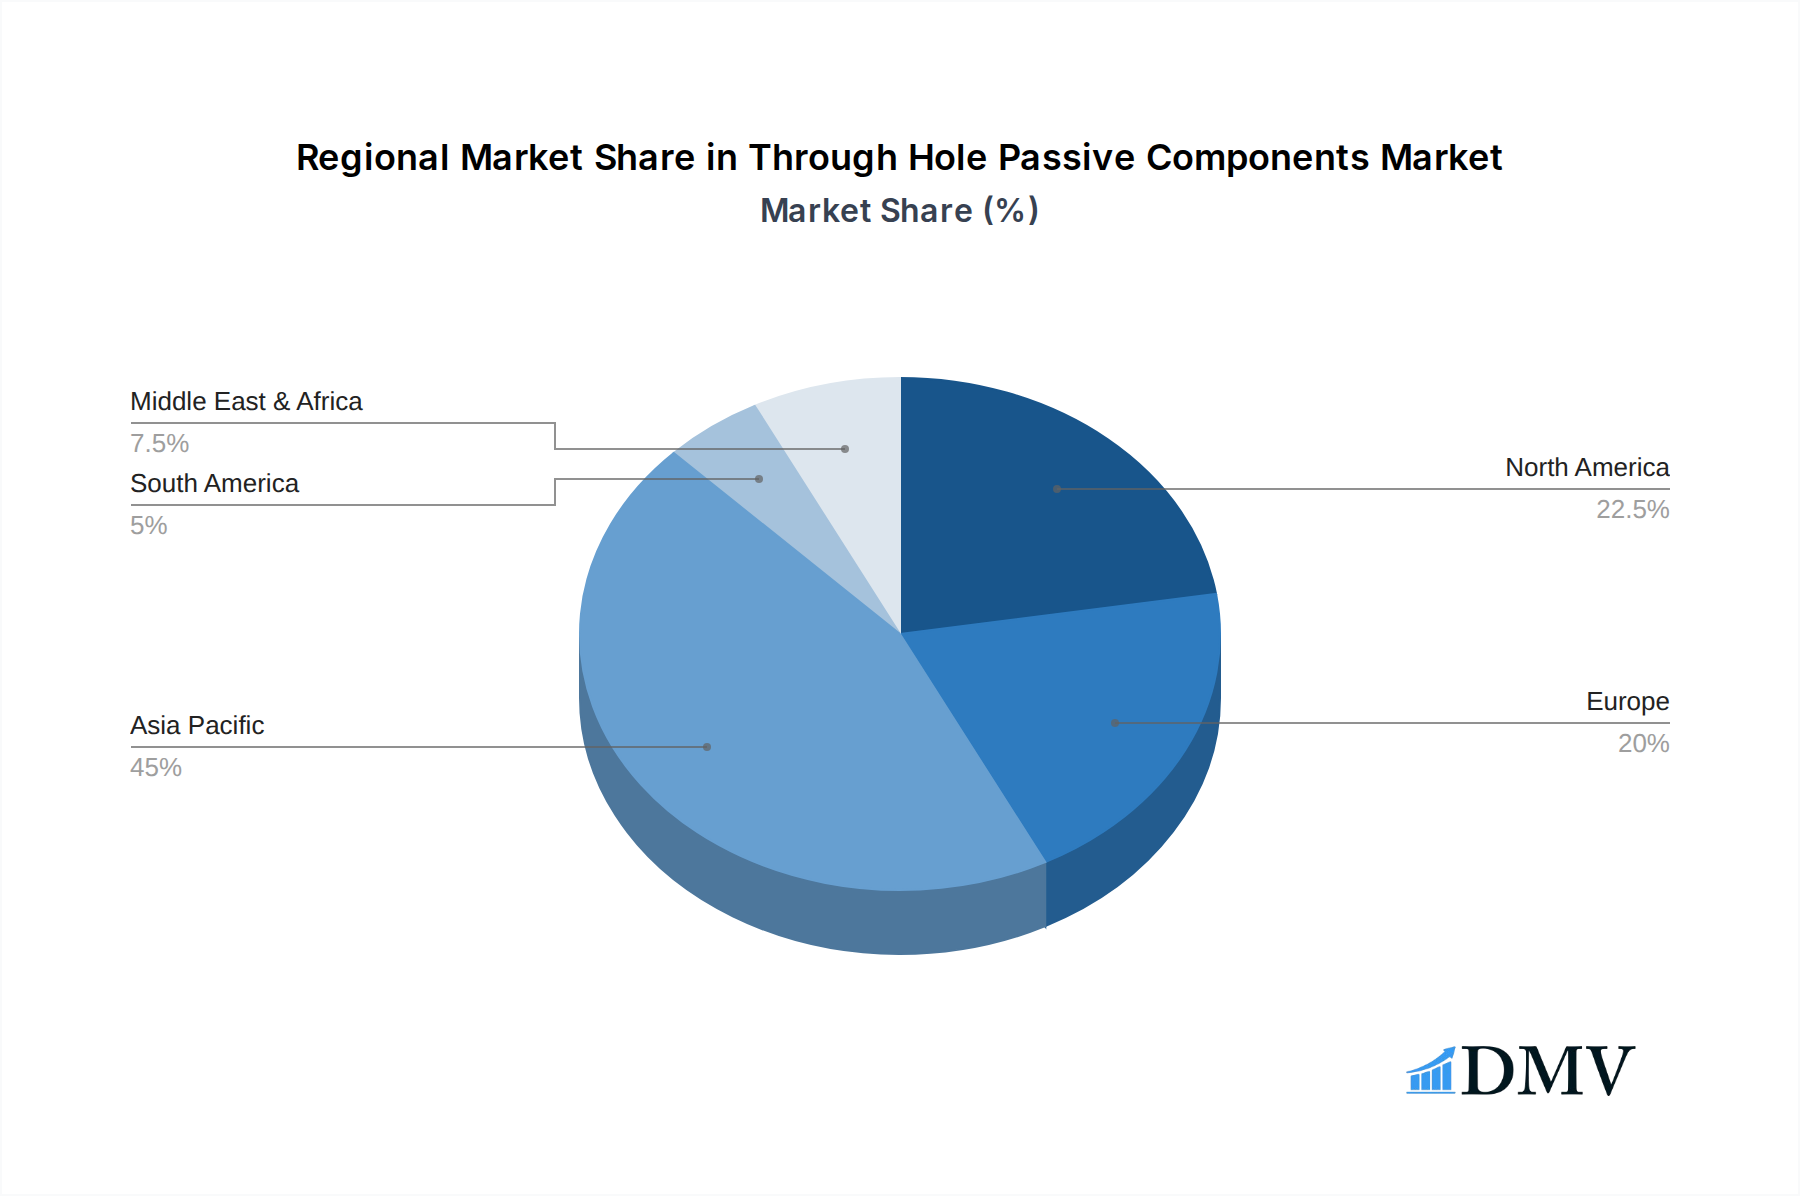
The global through hole passive components market is experiencing significant regional dominance, with Asia-Pacific emerging as the leading powerhouse. This dominance is driven by a confluence of factors including robust manufacturing capabilities, a rapidly expanding electronics industry, and substantial investments in research and development. Within the Asia-Pacific region, countries like China, South Korea, and Taiwan are at the forefront, leveraging their established electronic manufacturing ecosystems.
Key Drivers of Dominance in Asia-Pacific:
- Manufacturing Hub: Asia-Pacific serves as the global manufacturing hub for a vast array of electronic devices, creating an inherent and substantial demand for passive components. Companies like Murata Manufacturing Co., Ltd, YAGEO Group, and Samsung Electro-Mechanics have a strong presence and extensive manufacturing facilities in this region.
- Growing Domestic Consumption: The burgeoning middle class in countries like China and India fuels a massive domestic market for consumer electronics, further bolstering the demand for through hole passive components.
- Technological Advancement: Significant investments in R&D by regional players are leading to innovative product development, catering to the evolving needs of sectors like 5G, electric vehicles, and IoT.
- Government Support: Favorable government policies and incentives for the electronics manufacturing sector in several Asian countries have encouraged substantial investment and expansion.
While Asia-Pacific leads, North America and Europe also represent significant markets, primarily driven by their advanced industrial, automotive, and aerospace & defense sectors.
Dominant Segments by Application:
- Consumer Electronics: This segment consistently accounts for the largest share of the through hole passive components market. The constant innovation and high production volumes of devices like smartphones, televisions, and gaming consoles create an insatiable demand.
- Automotive: The rapid electrification and increasing sophistication of automotive electronics, including advanced driver-assistance systems (ADAS) and infotainment systems, are driving significant growth in this segment. The need for reliable and robust components capable of withstanding harsh automotive environments is paramount.
- Industrial: The growing adoption of automation, robotics, and smart manufacturing in industries worldwide is fueling demand for through hole passive components that offer high reliability and performance in demanding industrial settings.
Dominant Segments by Type:
- Axial Leads: While radial leads are gaining traction, axial lead components continue to hold a substantial market share, particularly in applications requiring robust mechanical integrity and ease of manual or automated insertion in traditional PCB layouts.
- Radial Leads: This segment is experiencing robust growth, driven by the increasing adoption of modern PCB designs and automated assembly processes that favor radial lead configurations.
The overall market value is estimated to be over $XXX million in 2025, with Asia-Pacific expected to contribute over 60% of this value. The consumer electronics segment alone is projected to be worth over $XXX million in 2025, while the automotive segment is expected to grow at a CAGR of XX% over the forecast period.
Through Hole Passive Components Product Innovations
Innovation in through hole passive components is focused on enhancing performance, reliability, and miniaturization while maintaining cost-effectiveness. Recent product developments include advanced multilayer ceramic capacitors (MLCCs) with higher capacitance values and improved voltage ratings, crucial for power-hungry applications in consumer electronics and automotive systems. Electrolytic capacitors are seeing advancements in electrolyte formulations and construction, leading to extended lifespan and higher ripple current capabilities, vital for industrial power supplies and telecommunications equipment. Resistors are benefiting from new resistive materials and termination technologies, offering greater precision, lower temperature coefficients, and higher power handling in compact packages. Inductors are being optimized for high-frequency applications with improved core materials and winding techniques, enabling smaller form factors and higher efficiency in wireless communication devices and power converters. These innovations are enabling smaller, more powerful, and more efficient electronic devices across all industry segments, with unique selling propositions including extended operational life and superior thermal stability.
Propelling Factors for Through Hole Passive Components Growth
The through hole passive components market is experiencing robust growth propelled by several key factors. The escalating demand from the rapidly expanding consumer electronics sector, driven by continuous product innovation and consumer appetite for advanced features, is a primary driver. The ongoing digital transformation across industries, including the widespread adoption of IoT devices, smart grids, and advanced computing, necessitates reliable and robust passive components. Furthermore, the substantial growth in the automotive industry, particularly with the transition towards electric vehicles (EVs) and autonomous driving technologies, requires high-performance passives capable of withstanding demanding environmental conditions. Government initiatives promoting domestic manufacturing and technological advancement in various countries, coupled with significant investments in infrastructure development for IT & Telecommunication, also contribute to market expansion. The inherent reliability and ease of assembly of through-hole components in specific industrial applications continue to ensure their sustained demand.
Obstacles in the Through Hole Passive Components Market
Despite the positive growth trajectory, the through hole passive components market faces several obstacles. Supply chain disruptions, exacerbated by geopolitical tensions and raw material price volatility, can lead to extended lead times and increased manufacturing costs, impacting product availability and profitability. Intensifying competition from alternative technologies, particularly surface-mount devices (SMTs), in certain applications poses a challenge, as SMTs often offer greater miniaturization and automated assembly benefits. Stringent environmental regulations and evolving RoHS (Restriction of Hazardous Substances) directives can necessitate costly product redesigns and compliance efforts. Furthermore, fluctuations in global economic conditions and potential slowdowns in key end-user industries can impact overall demand. The estimated impact of these disruptions on market growth can range from XX% to XX% annually.
Future Opportunities in Through Hole Passive Components
The through hole passive components market is ripe with future opportunities. The burgeoning 5G infrastructure deployment globally will drive substantial demand for high-frequency and high-power passive components. The increasing adoption of electrification in transportation beyond just passenger cars, including commercial vehicles and industrial equipment, presents a significant growth avenue. The continued expansion of the industrial automation sector and the development of Industry 4.0 solutions will require an increasing number of reliable passive components. Emerging markets in developing economies with growing electronics manufacturing capabilities and increasing consumer demand offer substantial untapped potential. Innovations in advanced materials and manufacturing techniques for through-hole components will unlock new performance capabilities, catering to evolving application requirements and creating opportunities for market differentiation.
Major Players in the Through Hole Passive Components Ecosystem
- Bourns, Inc.
- KYOCERA AVX Components Corporation
- Panasonic Holdings Corporation
- Microchip Technology Inc.
- Murata Manufacturing Co., Ltd
- TDK Corporation
- TE Connectivity
- Vishay Intertechnology, Inc
- YAGEO Group
- AVX Corporation
- KEMET Corporation
- Rubycon Corporation
- Nichicon Corporation
- Walsin Technology Corporation
- Taiyo Yuden Co., Ltd
- Samsung Electro-Mechanics
- EPCOS AG
- Nippon Chemi-Con Corporation
- Cornell Dubilier Electronics, Inc
- TT Electronics PLC
Key Developments in Through Hole Passive Components Industry
- 2023 (Q4): Murata Manufacturing Co., Ltd announces a new series of high-capacitance ceramic capacitors for automotive applications, offering enhanced thermal stability and reliability.
- 2024 (Q1): YAGEO Group expands its resistor portfolio with a new line of high-power thick film resistors designed for industrial power supply applications.
- 2024 (Q2): KEMET Corporation introduces advanced electrolytic capacitors with extended lifespan, targeting demanding industrial and aerospace applications.
- 2024 (Q3): Panasonic Holdings Corporation launches new multilayer ceramic capacitors (MLCCs) with improved impedance characteristics for next-generation wireless communication systems.
- 2025 (Q1 - Projected): TE Connectivity is expected to announce a strategic acquisition aimed at bolstering its passive component offerings for the automotive sector.
Strategic Through Hole Passive Components Market Forecast
The strategic outlook for the through hole passive components market remains highly positive, driven by sustained demand from key sectors and ongoing technological advancements. The convergence of 5G, AI, and IoT will continue to fuel the need for high-performance and reliable passive components. The automotive industry's relentless drive towards electrification and autonomous features will solidify its position as a major growth engine. Emerging economies present significant opportunities for market penetration and expansion. Companies that focus on innovation in advanced materials, miniaturization, and enhanced performance characteristics, while navigating supply chain complexities and regulatory landscapes effectively, are poised for substantial growth in the coming years. The market is projected to reach over $XXX million by 2033, indicating a strong and sustained growth trajectory.
Through Hole Passive Components Segmentation
-
1. Application
- 1.1. Consumer Electronics
- 1.2. IT & Telecommunication
- 1.3. Automotive
- 1.4. Industrial
- 1.5. Aerospace & Defense
- 1.6. Healthcare
- 1.7. Others
-
2. Type
- 2.1. by Axial Leads
- 2.2. by Radial Leads
Through Hole Passive Components Segmentation By Geography
-
1. North America
- 1.1. United States
- 1.2. Canada
- 1.3. Mexico
-
2. South America
- 2.1. Brazil
- 2.2. Argentina
- 2.3. Rest of South America
-
3. Europe
- 3.1. United Kingdom
- 3.2. Germany
- 3.3. France
- 3.4. Italy
- 3.5. Spain
- 3.6. Russia
- 3.7. Benelux
- 3.8. Nordics
- 3.9. Rest of Europe
-
4. Middle East & Africa
- 4.1. Turkey
- 4.2. Israel
- 4.3. GCC
- 4.4. North Africa
- 4.5. South Africa
- 4.6. Rest of Middle East & Africa
-
5. Asia Pacific
- 5.1. China
- 5.2. India
- 5.3. Japan
- 5.4. South Korea
- 5.5. ASEAN
- 5.6. Oceania
- 5.7. Rest of Asia Pacific
Through Hole Passive Components Regional Market Share
Geographic Coverage of Through Hole Passive Components
Through Hole Passive Components REPORT HIGHLIGHTS
| Aspects | Details |
|---|---|
| Study Period | 2020-2034 |
| Base Year | 2025 |
| Estimated Year | 2026 |
| Forecast Period | 2026-2034 |
| Historical Period | 2020-2025 |
| Growth Rate | CAGR of 7.1% from 2020-2034 |
| Segmentation |
|
Table of Contents
- 1. Introduction
- 1.1. Research Scope
- 1.2. Market Segmentation
- 1.3. Research Objective
- 1.4. Definitions and Assumptions
- 2. Executive Summary
- 2.1. Market Snapshot
- 3. Market Dynamics
- 3.1. Market Drivers
- 3.2. Market Restrains
- 3.3. Market Trends
- 3.4. Market Opportunities
- 4. Market Factor Analysis
- 4.1. Porters Five Forces
- 4.1.1. Bargaining Power of Suppliers
- 4.1.2. Bargaining Power of Buyers
- 4.1.3. Threat of New Entrants
- 4.1.4. Threat of Substitutes
- 4.1.5. Competitive Rivalry
- 4.2. PESTEL analysis
- 4.3. BCG Analysis
- 4.3.1. Stars (High Growth, High Market Share)
- 4.3.2. Cash Cows (Low Growth, High Market Share)
- 4.3.3. Question Mark (High Growth, Low Market Share)
- 4.3.4. Dogs (Low Growth, Low Market Share)
- 4.4. Ansoff Matrix Analysis
- 4.5. Supply Chain Analysis
- 4.6. Regulatory Landscape
- 4.7. Current Market Potential and Opportunity Assessment (TAM–SAM–SOM Framework)
- 4.8. DMV Analyst Note
- 4.1. Porters Five Forces
- 5. Market Analysis, Insights and Forecast 2021-2033
- 5.1. Market Analysis, Insights and Forecast - by Application
- 5.1.1. Consumer Electronics
- 5.1.2. IT & Telecommunication
- 5.1.3. Automotive
- 5.1.4. Industrial
- 5.1.5. Aerospace & Defense
- 5.1.6. Healthcare
- 5.1.7. Others
- 5.2. Market Analysis, Insights and Forecast - by Type
- 5.2.1. by Axial Leads
- 5.2.2. by Radial Leads
- 5.3. Market Analysis, Insights and Forecast - by Region
- 5.3.1. North America
- 5.3.2. South America
- 5.3.3. Europe
- 5.3.4. Middle East & Africa
- 5.3.5. Asia Pacific
- 5.1. Market Analysis, Insights and Forecast - by Application
- 6. Global Through Hole Passive Components Analysis, Insights and Forecast, 2021-2033
- 6.1. Market Analysis, Insights and Forecast - by Application
- 6.1.1. Consumer Electronics
- 6.1.2. IT & Telecommunication
- 6.1.3. Automotive
- 6.1.4. Industrial
- 6.1.5. Aerospace & Defense
- 6.1.6. Healthcare
- 6.1.7. Others
- 6.2. Market Analysis, Insights and Forecast - by Type
- 6.2.1. by Axial Leads
- 6.2.2. by Radial Leads
- 6.1. Market Analysis, Insights and Forecast - by Application
- 7. North America Through Hole Passive Components Analysis, Insights and Forecast, 2020-2032
- 7.1. Market Analysis, Insights and Forecast - by Application
- 7.1.1. Consumer Electronics
- 7.1.2. IT & Telecommunication
- 7.1.3. Automotive
- 7.1.4. Industrial
- 7.1.5. Aerospace & Defense
- 7.1.6. Healthcare
- 7.1.7. Others
- 7.2. Market Analysis, Insights and Forecast - by Type
- 7.2.1. by Axial Leads
- 7.2.2. by Radial Leads
- 7.1. Market Analysis, Insights and Forecast - by Application
- 8. South America Through Hole Passive Components Analysis, Insights and Forecast, 2020-2032
- 8.1. Market Analysis, Insights and Forecast - by Application
- 8.1.1. Consumer Electronics
- 8.1.2. IT & Telecommunication
- 8.1.3. Automotive
- 8.1.4. Industrial
- 8.1.5. Aerospace & Defense
- 8.1.6. Healthcare
- 8.1.7. Others
- 8.2. Market Analysis, Insights and Forecast - by Type
- 8.2.1. by Axial Leads
- 8.2.2. by Radial Leads
- 8.1. Market Analysis, Insights and Forecast - by Application
- 9. Europe Through Hole Passive Components Analysis, Insights and Forecast, 2020-2032
- 9.1. Market Analysis, Insights and Forecast - by Application
- 9.1.1. Consumer Electronics
- 9.1.2. IT & Telecommunication
- 9.1.3. Automotive
- 9.1.4. Industrial
- 9.1.5. Aerospace & Defense
- 9.1.6. Healthcare
- 9.1.7. Others
- 9.2. Market Analysis, Insights and Forecast - by Type
- 9.2.1. by Axial Leads
- 9.2.2. by Radial Leads
- 9.1. Market Analysis, Insights and Forecast - by Application
- 10. Middle East & Africa Through Hole Passive Components Analysis, Insights and Forecast, 2020-2032
- 10.1. Market Analysis, Insights and Forecast - by Application
- 10.1.1. Consumer Electronics
- 10.1.2. IT & Telecommunication
- 10.1.3. Automotive
- 10.1.4. Industrial
- 10.1.5. Aerospace & Defense
- 10.1.6. Healthcare
- 10.1.7. Others
- 10.2. Market Analysis, Insights and Forecast - by Type
- 10.2.1. by Axial Leads
- 10.2.2. by Radial Leads
- 10.1. Market Analysis, Insights and Forecast - by Application
- 11. Asia Pacific Through Hole Passive Components Analysis, Insights and Forecast, 2020-2032
- 11.1. Market Analysis, Insights and Forecast - by Application
- 11.1.1. Consumer Electronics
- 11.1.2. IT & Telecommunication
- 11.1.3. Automotive
- 11.1.4. Industrial
- 11.1.5. Aerospace & Defense
- 11.1.6. Healthcare
- 11.1.7. Others
- 11.2. Market Analysis, Insights and Forecast - by Type
- 11.2.1. by Axial Leads
- 11.2.2. by Radial Leads
- 11.1. Market Analysis, Insights and Forecast - by Application
- 12. Competitive Analysis
- 12.1. Company Profiles
- 12.1.1 Bourns Inc.
- 12.1.1.1. Company Overview
- 12.1.1.2. Products
- 12.1.1.3. Company Financials
- 12.1.1.4. SWOT Analysis
- 12.1.2 KYOCERA AVX Components Corporation
- 12.1.2.1. Company Overview
- 12.1.2.2. Products
- 12.1.2.3. Company Financials
- 12.1.2.4. SWOT Analysis
- 12.1.3 Panasonic Holdings Corporation
- 12.1.3.1. Company Overview
- 12.1.3.2. Products
- 12.1.3.3. Company Financials
- 12.1.3.4. SWOT Analysis
- 12.1.4 Microchip Technology Inc.
- 12.1.4.1. Company Overview
- 12.1.4.2. Products
- 12.1.4.3. Company Financials
- 12.1.4.4. SWOT Analysis
- 12.1.5 Murata Manufacturing Co. Ltd
- 12.1.5.1. Company Overview
- 12.1.5.2. Products
- 12.1.5.3. Company Financials
- 12.1.5.4. SWOT Analysis
- 12.1.6 TDK Corporation
- 12.1.6.1. Company Overview
- 12.1.6.2. Products
- 12.1.6.3. Company Financials
- 12.1.6.4. SWOT Analysis
- 12.1.7 TE Connectivity
- 12.1.7.1. Company Overview
- 12.1.7.2. Products
- 12.1.7.3. Company Financials
- 12.1.7.4. SWOT Analysis
- 12.1.8 Vishay Intertechnology Inc
- 12.1.8.1. Company Overview
- 12.1.8.2. Products
- 12.1.8.3. Company Financials
- 12.1.8.4. SWOT Analysis
- 12.1.9 YAGEO Group
- 12.1.9.1. Company Overview
- 12.1.9.2. Products
- 12.1.9.3. Company Financials
- 12.1.9.4. SWOT Analysis
- 12.1.10 AVX Corporation
- 12.1.10.1. Company Overview
- 12.1.10.2. Products
- 12.1.10.3. Company Financials
- 12.1.10.4. SWOT Analysis
- 12.1.11 KEMET Corporation
- 12.1.11.1. Company Overview
- 12.1.11.2. Products
- 12.1.11.3. Company Financials
- 12.1.11.4. SWOT Analysis
- 12.1.12 Rubycon Corporation
- 12.1.12.1. Company Overview
- 12.1.12.2. Products
- 12.1.12.3. Company Financials
- 12.1.12.4. SWOT Analysis
- 12.1.13 Nichicon Corporation
- 12.1.13.1. Company Overview
- 12.1.13.2. Products
- 12.1.13.3. Company Financials
- 12.1.13.4. SWOT Analysis
- 12.1.14 Walsin Technology Corporation
- 12.1.14.1. Company Overview
- 12.1.14.2. Products
- 12.1.14.3. Company Financials
- 12.1.14.4. SWOT Analysis
- 12.1.15 Taiyo Yuden Co. Ltd
- 12.1.15.1. Company Overview
- 12.1.15.2. Products
- 12.1.15.3. Company Financials
- 12.1.15.4. SWOT Analysis
- 12.1.16 Samsung Electro-Mechanics
- 12.1.16.1. Company Overview
- 12.1.16.2. Products
- 12.1.16.3. Company Financials
- 12.1.16.4. SWOT Analysis
- 12.1.17 EPCOS AG
- 12.1.17.1. Company Overview
- 12.1.17.2. Products
- 12.1.17.3. Company Financials
- 12.1.17.4. SWOT Analysis
- 12.1.18 Nippon Chemi-Con Corporation
- 12.1.18.1. Company Overview
- 12.1.18.2. Products
- 12.1.18.3. Company Financials
- 12.1.18.4. SWOT Analysis
- 12.1.19 Cornell Dubilier Electronics Inc
- 12.1.19.1. Company Overview
- 12.1.19.2. Products
- 12.1.19.3. Company Financials
- 12.1.19.4. SWOT Analysis
- 12.1.20 TT Electronics PLC
- 12.1.20.1. Company Overview
- 12.1.20.2. Products
- 12.1.20.3. Company Financials
- 12.1.20.4. SWOT Analysis
- 12.1.1 Bourns Inc.
- 12.2. Market Entropy
- 12.2.1 Company's Key Areas Served
- 12.2.2 Recent Developments
- 12.3. Company Market Share Analysis 2025
- 12.3.1 Top 5 Companies Market Share Analysis
- 12.3.2 Top 3 Companies Market Share Analysis
- 12.4. List of Potential Customers
- 13. Research Methodology
List of Figures
- Figure 1: Global Through Hole Passive Components Revenue Breakdown (million, %) by Region 2025 & 2033
- Figure 2: North America Through Hole Passive Components Revenue (million), by Application 2025 & 2033
- Figure 3: North America Through Hole Passive Components Revenue Share (%), by Application 2025 & 2033
- Figure 4: North America Through Hole Passive Components Revenue (million), by Type 2025 & 2033
- Figure 5: North America Through Hole Passive Components Revenue Share (%), by Type 2025 & 2033
- Figure 6: North America Through Hole Passive Components Revenue (million), by Country 2025 & 2033
- Figure 7: North America Through Hole Passive Components Revenue Share (%), by Country 2025 & 2033
- Figure 8: South America Through Hole Passive Components Revenue (million), by Application 2025 & 2033
- Figure 9: South America Through Hole Passive Components Revenue Share (%), by Application 2025 & 2033
- Figure 10: South America Through Hole Passive Components Revenue (million), by Type 2025 & 2033
- Figure 11: South America Through Hole Passive Components Revenue Share (%), by Type 2025 & 2033
- Figure 12: South America Through Hole Passive Components Revenue (million), by Country 2025 & 2033
- Figure 13: South America Through Hole Passive Components Revenue Share (%), by Country 2025 & 2033
- Figure 14: Europe Through Hole Passive Components Revenue (million), by Application 2025 & 2033
- Figure 15: Europe Through Hole Passive Components Revenue Share (%), by Application 2025 & 2033
- Figure 16: Europe Through Hole Passive Components Revenue (million), by Type 2025 & 2033
- Figure 17: Europe Through Hole Passive Components Revenue Share (%), by Type 2025 & 2033
- Figure 18: Europe Through Hole Passive Components Revenue (million), by Country 2025 & 2033
- Figure 19: Europe Through Hole Passive Components Revenue Share (%), by Country 2025 & 2033
- Figure 20: Middle East & Africa Through Hole Passive Components Revenue (million), by Application 2025 & 2033
- Figure 21: Middle East & Africa Through Hole Passive Components Revenue Share (%), by Application 2025 & 2033
- Figure 22: Middle East & Africa Through Hole Passive Components Revenue (million), by Type 2025 & 2033
- Figure 23: Middle East & Africa Through Hole Passive Components Revenue Share (%), by Type 2025 & 2033
- Figure 24: Middle East & Africa Through Hole Passive Components Revenue (million), by Country 2025 & 2033
- Figure 25: Middle East & Africa Through Hole Passive Components Revenue Share (%), by Country 2025 & 2033
- Figure 26: Asia Pacific Through Hole Passive Components Revenue (million), by Application 2025 & 2033
- Figure 27: Asia Pacific Through Hole Passive Components Revenue Share (%), by Application 2025 & 2033
- Figure 28: Asia Pacific Through Hole Passive Components Revenue (million), by Type 2025 & 2033
- Figure 29: Asia Pacific Through Hole Passive Components Revenue Share (%), by Type 2025 & 2033
- Figure 30: Asia Pacific Through Hole Passive Components Revenue (million), by Country 2025 & 2033
- Figure 31: Asia Pacific Through Hole Passive Components Revenue Share (%), by Country 2025 & 2033
List of Tables
- Table 1: Global Through Hole Passive Components Revenue million Forecast, by Application 2020 & 2033
- Table 2: Global Through Hole Passive Components Revenue million Forecast, by Type 2020 & 2033
- Table 3: Global Through Hole Passive Components Revenue million Forecast, by Region 2020 & 2033
- Table 4: Global Through Hole Passive Components Revenue million Forecast, by Application 2020 & 2033
- Table 5: Global Through Hole Passive Components Revenue million Forecast, by Type 2020 & 2033
- Table 6: Global Through Hole Passive Components Revenue million Forecast, by Country 2020 & 2033
- Table 7: United States Through Hole Passive Components Revenue (million) Forecast, by Application 2020 & 2033
- Table 8: Canada Through Hole Passive Components Revenue (million) Forecast, by Application 2020 & 2033
- Table 9: Mexico Through Hole Passive Components Revenue (million) Forecast, by Application 2020 & 2033
- Table 10: Global Through Hole Passive Components Revenue million Forecast, by Application 2020 & 2033
- Table 11: Global Through Hole Passive Components Revenue million Forecast, by Type 2020 & 2033
- Table 12: Global Through Hole Passive Components Revenue million Forecast, by Country 2020 & 2033
- Table 13: Brazil Through Hole Passive Components Revenue (million) Forecast, by Application 2020 & 2033
- Table 14: Argentina Through Hole Passive Components Revenue (million) Forecast, by Application 2020 & 2033
- Table 15: Rest of South America Through Hole Passive Components Revenue (million) Forecast, by Application 2020 & 2033
- Table 16: Global Through Hole Passive Components Revenue million Forecast, by Application 2020 & 2033
- Table 17: Global Through Hole Passive Components Revenue million Forecast, by Type 2020 & 2033
- Table 18: Global Through Hole Passive Components Revenue million Forecast, by Country 2020 & 2033
- Table 19: United Kingdom Through Hole Passive Components Revenue (million) Forecast, by Application 2020 & 2033
- Table 20: Germany Through Hole Passive Components Revenue (million) Forecast, by Application 2020 & 2033
- Table 21: France Through Hole Passive Components Revenue (million) Forecast, by Application 2020 & 2033
- Table 22: Italy Through Hole Passive Components Revenue (million) Forecast, by Application 2020 & 2033
- Table 23: Spain Through Hole Passive Components Revenue (million) Forecast, by Application 2020 & 2033
- Table 24: Russia Through Hole Passive Components Revenue (million) Forecast, by Application 2020 & 2033
- Table 25: Benelux Through Hole Passive Components Revenue (million) Forecast, by Application 2020 & 2033
- Table 26: Nordics Through Hole Passive Components Revenue (million) Forecast, by Application 2020 & 2033
- Table 27: Rest of Europe Through Hole Passive Components Revenue (million) Forecast, by Application 2020 & 2033
- Table 28: Global Through Hole Passive Components Revenue million Forecast, by Application 2020 & 2033
- Table 29: Global Through Hole Passive Components Revenue million Forecast, by Type 2020 & 2033
- Table 30: Global Through Hole Passive Components Revenue million Forecast, by Country 2020 & 2033
- Table 31: Turkey Through Hole Passive Components Revenue (million) Forecast, by Application 2020 & 2033
- Table 32: Israel Through Hole Passive Components Revenue (million) Forecast, by Application 2020 & 2033
- Table 33: GCC Through Hole Passive Components Revenue (million) Forecast, by Application 2020 & 2033
- Table 34: North Africa Through Hole Passive Components Revenue (million) Forecast, by Application 2020 & 2033
- Table 35: South Africa Through Hole Passive Components Revenue (million) Forecast, by Application 2020 & 2033
- Table 36: Rest of Middle East & Africa Through Hole Passive Components Revenue (million) Forecast, by Application 2020 & 2033
- Table 37: Global Through Hole Passive Components Revenue million Forecast, by Application 2020 & 2033
- Table 38: Global Through Hole Passive Components Revenue million Forecast, by Type 2020 & 2033
- Table 39: Global Through Hole Passive Components Revenue million Forecast, by Country 2020 & 2033
- Table 40: China Through Hole Passive Components Revenue (million) Forecast, by Application 2020 & 2033
- Table 41: India Through Hole Passive Components Revenue (million) Forecast, by Application 2020 & 2033
- Table 42: Japan Through Hole Passive Components Revenue (million) Forecast, by Application 2020 & 2033
- Table 43: South Korea Through Hole Passive Components Revenue (million) Forecast, by Application 2020 & 2033
- Table 44: ASEAN Through Hole Passive Components Revenue (million) Forecast, by Application 2020 & 2033
- Table 45: Oceania Through Hole Passive Components Revenue (million) Forecast, by Application 2020 & 2033
- Table 46: Rest of Asia Pacific Through Hole Passive Components Revenue (million) Forecast, by Application 2020 & 2033
Frequently Asked Questions
1. What is the projected Compound Annual Growth Rate (CAGR) of the Through Hole Passive Components?
The projected CAGR is approximately 7.1%.
2. Which companies are prominent players in the Through Hole Passive Components?
Key companies in the market include Bourns, Inc., KYOCERA AVX Components Corporation, Panasonic Holdings Corporation, Microchip Technology Inc., Murata Manufacturing Co., Ltd, TDK Corporation, TE Connectivity, Vishay Intertechnology, Inc, YAGEO Group, AVX Corporation, KEMET Corporation, Rubycon Corporation, Nichicon Corporation, Walsin Technology Corporation, Taiyo Yuden Co., Ltd, Samsung Electro-Mechanics, EPCOS AG, Nippon Chemi-Con Corporation, Cornell Dubilier Electronics, Inc, TT Electronics PLC.
3. What are the main segments of the Through Hole Passive Components?
The market segments include Application, Type.
4. Can you provide details about the market size?
The market size is estimated to be USD 6676 million as of 2022.
5. What are some drivers contributing to market growth?
N/A
6. What are the notable trends driving market growth?
N/A
7. Are there any restraints impacting market growth?
N/A
8. Can you provide examples of recent developments in the market?
N/A
9. What pricing options are available for accessing the report?
Pricing options include single-user, multi-user, and enterprise licenses priced at USD 2900.00, USD 4350.00, and USD 5800.00 respectively.
10. Is the market size provided in terms of value or volume?
The market size is provided in terms of value, measured in million.
11. Are there any specific market keywords associated with the report?
Yes, the market keyword associated with the report is "Through Hole Passive Components," which aids in identifying and referencing the specific market segment covered.
12. How do I determine which pricing option suits my needs best?
The pricing options vary based on user requirements and access needs. Individual users may opt for single-user licenses, while businesses requiring broader access may choose multi-user or enterprise licenses for cost-effective access to the report.
13. Are there any additional resources or data provided in the Through Hole Passive Components report?
While the report offers comprehensive insights, it's advisable to review the specific contents or supplementary materials provided to ascertain if additional resources or data are available.
14. How can I stay updated on further developments or reports in the Through Hole Passive Components?
To stay informed about further developments, trends, and reports in the Through Hole Passive Components, consider subscribing to industry newsletters, following relevant companies and organizations, or regularly checking reputable industry news sources and publications.
Methodology
Step 1 - Identification of Relevant Samples Size from Population Database


Step 2 - Approaches for Defining Global Market Size (Value, Volume* & Price*)

Note*: In applicable scenarios
Step 3 - Data Sources
Primary Research
- Web Analytics
- Survey Reports
- Research Institute
- Latest Research Reports
- Opinion Leaders
Secondary Research
- Annual Reports
- White Paper
- Latest Press Release
- Industry Association
- Paid Database
- Investor Presentations

Step 4 - Data Triangulation
Involves using different sources of information in order to increase the validity of a study
These sources are likely to be stakeholders in a program - participants, other researchers, program staff, other community members, and so on.
Then we put all data in single framework & apply various statistical tools to find out the dynamic on the market.
During the analysis stage, feedback from the stakeholder groups would be compared to determine areas of agreement as well as areas of divergence