

Key Insights
The global Synchronous Rectification ICs market is poised for significant expansion, driven by the increasing demand for energy efficiency and miniaturization across various electronic devices. As of 2024, the market is estimated to be valued at approximately $1.5 billion, with a robust projected Compound Annual Growth Rate (CAGR) of 9.2% through 2033. This impressive growth is fueled by the widespread adoption of high-efficiency power supplies in consumer electronics, telecommunications, and industrial automation. Key applications such as chargers and adapters are witnessing substantial demand, directly benefiting from the superior performance and reduced power loss offered by synchronous rectification technology compared to traditional diode rectification. The continuous evolution of power management solutions, coupled with stringent energy regulations worldwide, further accelerates the market's upward trajectory.
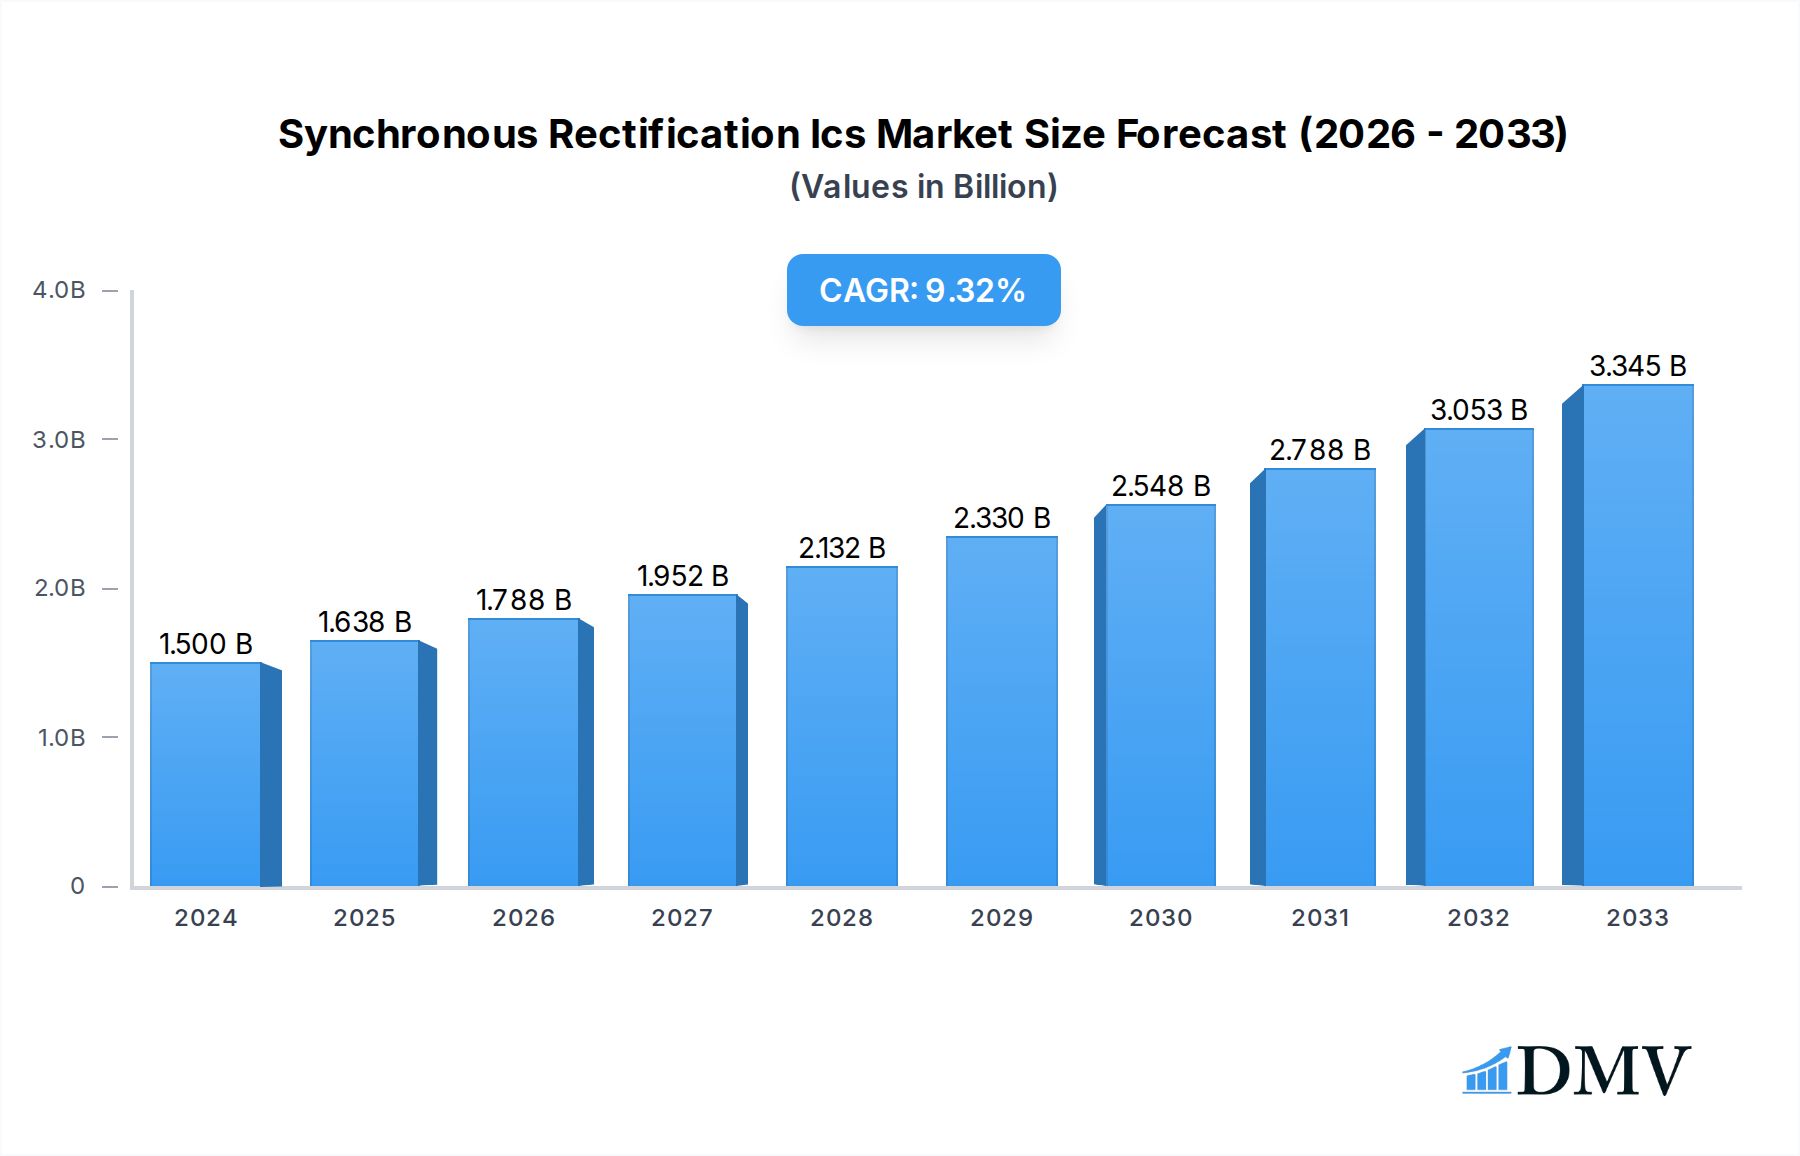
Synchronous Rectification Ics Market Size (In Billion)
Emerging trends like the proliferation of electric vehicles (EVs) and the expansion of renewable energy infrastructure are creating new avenues for growth in the Synchronous Rectification ICs market. The "Above 120V" segment, in particular, is expected to witness accelerated adoption as higher voltage systems become more prevalent in these advanced applications. While the market enjoys strong growth drivers, potential restraints include the complexity of integration for some designers and the price sensitivity in certain consumer segments. However, the ongoing innovation in semiconductor manufacturing and the continuous drive for more sustainable power solutions are expected to overcome these challenges. Major players like Texas Instruments, NXP, Onsemi, and Infineon are actively investing in research and development, introducing advanced synchronous rectification ICs that offer enhanced performance, smaller form factors, and lower costs, thereby solidifying the market's bright future.

Synchronous Rectification Ics Company Market Share
This comprehensive market research report provides an in-depth analysis of the global Synchronous Rectification ICs market, charting its trajectory from 2019 to 2033. With a base year of 2025 and a forecast period extending to 2033, this report offers critical insights into market dynamics, technological advancements, regional dominance, and future growth prospects for this vital semiconductor component. We cover key segments including Chargers, Adapters, and Others for applications, and Below 40V, 40-80V, 80-120V, and Above 120V for voltage types. This report is essential for stakeholders seeking to understand the current landscape and capitalize on the evolving opportunities within the synchronous rectification IC industry.
Synchronous Rectification ICs Market Composition & Trends
The global Synchronous Rectification ICs market is characterized by a moderate to high level of concentration, with a few prominent players holding significant market share. Innovation catalysts are primarily driven by the relentless demand for higher energy efficiency, smaller form factors, and enhanced thermal performance in power electronics. Regulatory landscapes, particularly concerning energy efficiency standards and environmental impact, are increasingly shaping product development and market entry strategies. Substitute products, while existing in the form of traditional diode rectification, are steadily being displaced by the superior efficiency and performance of synchronous rectification ICs. End-user profiles range from consumer electronics manufacturers and automotive component suppliers to industrial equipment developers and renewable energy system integrators. Mergers and acquisitions (M&A) activities are expected to continue, with estimated deal values reaching billions of dollars as larger players seek to consolidate their market positions and acquire cutting-edge technologies.
- Market Share Distribution: Estimated to be around $10 billion by 2025, with leading companies holding a combined share of over 70%.
- Innovation Catalysts: Focus on GaN and SiC integration, miniaturization, and smart power management features.
- Regulatory Impact: Driven by mandates for higher Power Conversion Efficiency (PCE) in power supplies and adapters.
- Substitute Product Displacement: Traditional Schottky diodes are being phased out in high-efficiency applications.
- M&A Activity: Anticipated deal values in the billions, targeting companies with advanced process technologies and intellectual property.
Synchronous Rectification ICs Industry Evolution
The Synchronous Rectification ICs industry has witnessed a remarkable evolution, driven by an insatiable global appetite for efficient power conversion solutions. Over the historical period (2019-2024), we observed a consistent upward trajectory in market growth, fueled by the increasing adoption of these ICs in a wide array of electronic devices. This growth was underpinned by significant technological advancements, including the transition from traditional MOSFET-based solutions to more advanced GaN (Gallium Nitride) and SiC (Silicon Carbide) technologies. These new materials have unlocked unprecedented levels of performance, enabling smaller, lighter, and more power-efficient power supplies, chargers, and adapters. Consumer demands have also played a pivotal role, with a growing preference for devices that offer longer battery life, faster charging capabilities, and a reduced environmental footprint. This has directly translated into a higher demand for synchronous rectification ICs that minimize power loss and heat generation. The market experienced an estimated Compound Annual Growth Rate (CAGR) of approximately 15% during the historical period. Looking ahead, the estimated market size for 2025 is projected to be around $10 billion, with significant growth catalysts pointing towards a robust forecast period (2025-2033). The adoption of synchronous rectification ICs is no longer a niche application but a mainstream requirement for virtually all modern power management systems.
- Market Growth Trajectory: Consistent double-digit CAGR observed from 2019 to 2024, projected to continue into the forecast period.
- Technological Advancements: Evolution from standard MOSFETs to high-performance GaN and SiC technologies.
- Shifting Consumer Demands: Emphasis on energy efficiency, miniaturization, faster charging, and reduced heat dissipation.
- Adoption Metrics: Over 80% adoption in new high-efficiency power adapter designs by 2024.
- Market Size Projections: Estimated $10 billion in 2025, with a forecasted CAGR of 12-15% during the forecast period.
Leading Regions, Countries, or Segments in Synchronous Rectification ICs
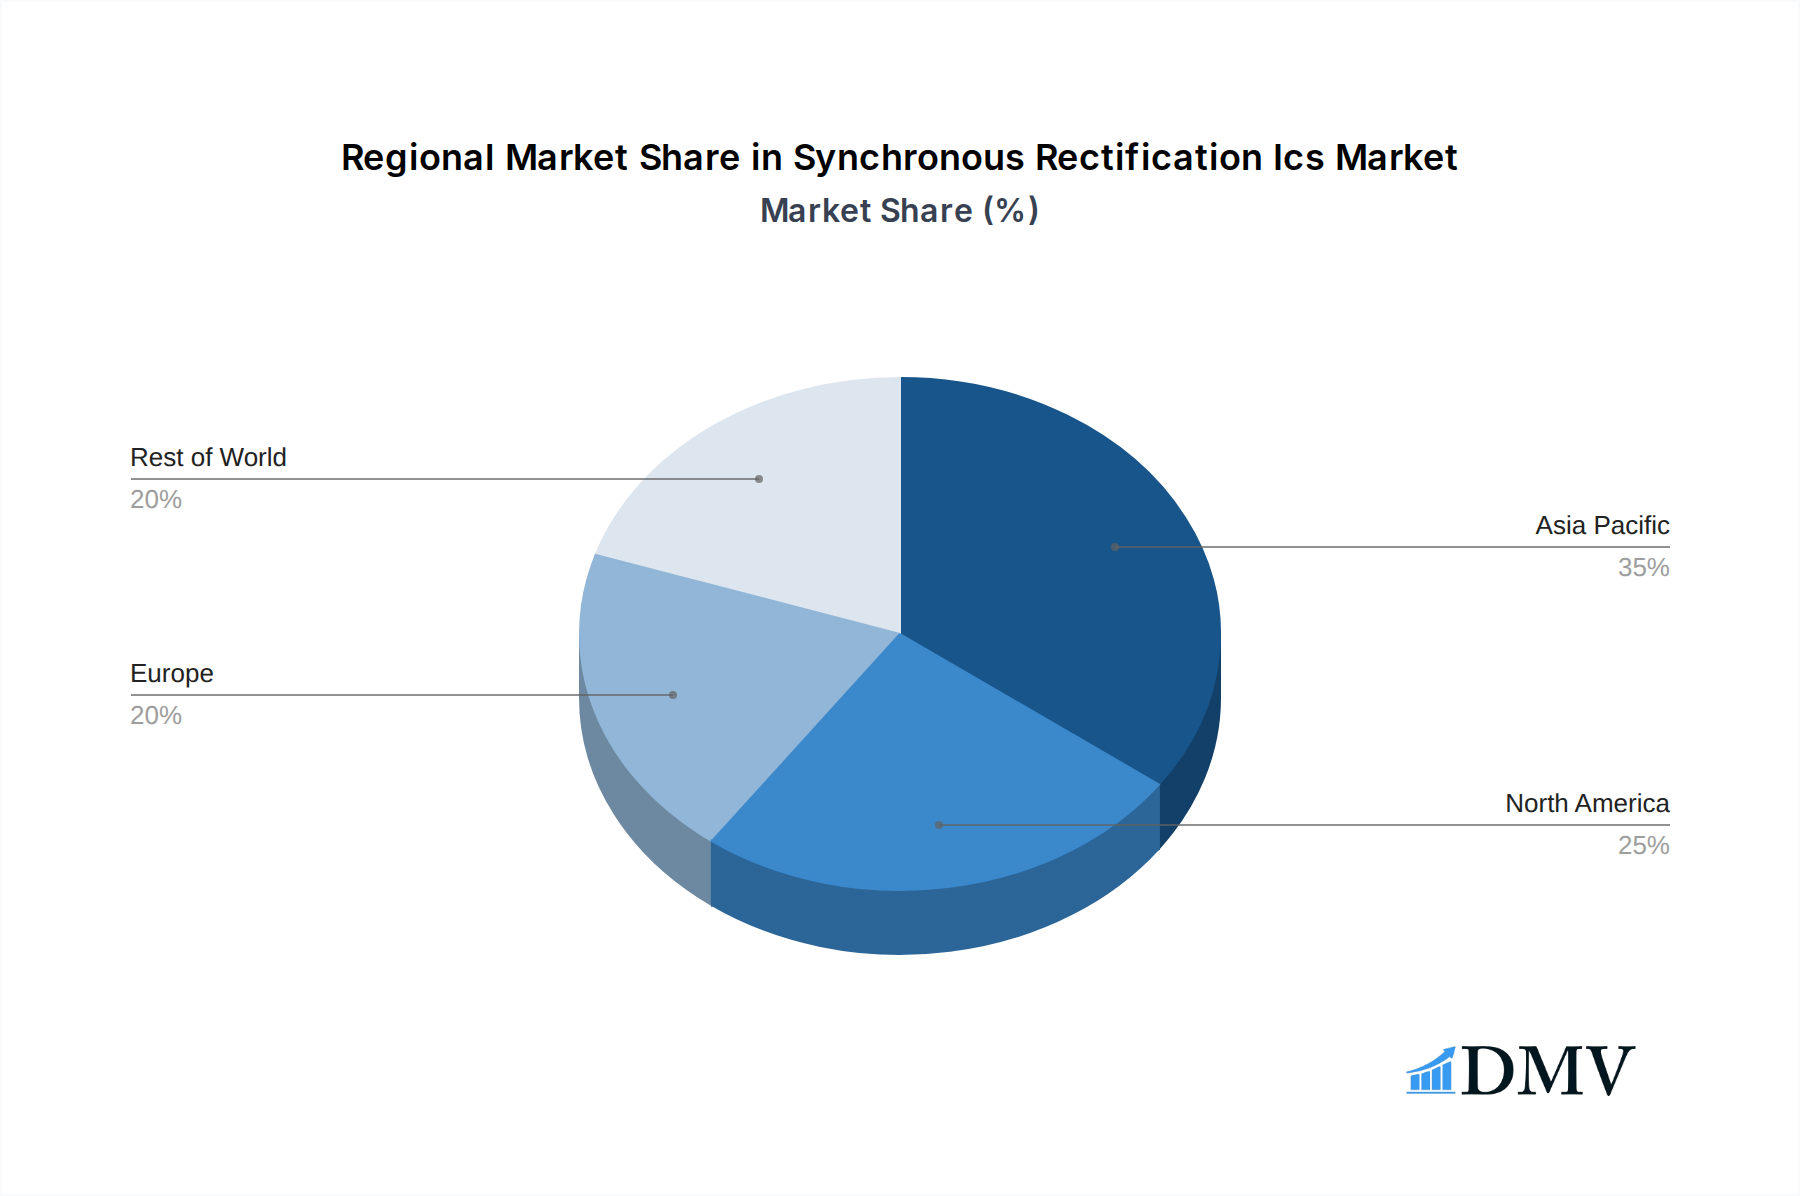
The global Synchronous Rectification ICs market is experiencing dynamic shifts, with the Charger application segment poised for significant dominance, particularly within the 40-80V and 80-120V voltage types. This ascendancy is driven by a confluence of factors, including the burgeoning demand for advanced mobile device chargers, the proliferation of fast-charging technologies, and the increasing integration of USB Power Delivery (USB PD) standards. Asia Pacific, spearheaded by China, has emerged as a powerhouse in both manufacturing and consumption of these ICs, owing to its robust electronics manufacturing ecosystem and a massive consumer base.
- Dominant Application Segment: Chargers are leading the market due to the ubiquitous need for efficient power delivery across a vast range of electronic devices, from smartphones and laptops to electric vehicles. The market for chargers is projected to exceed $6 billion by 2025.
- Key Voltage Type Drivers:
- 40-80V: Crucial for advanced smartphone and laptop chargers, enabling faster charging speeds and greater power output. This segment alone is estimated to reach over $3 billion by 2025.
- 80-120V: Essential for higher power applications such as gaming laptops, portable power stations, and entry-level electric vehicle chargers, experiencing rapid growth.
- Regional Dominance (Asia Pacific): This region accounts for over 60% of the global market share.
- Investment Trends: Billions of dollars are being invested in R&D and manufacturing facilities by leading semiconductor companies.
- Regulatory Support: Government initiatives promoting energy efficiency and e-mobility are driving demand.
- Manufacturing Hub: China's established semiconductor supply chain provides a competitive advantage.
- Emerging Opportunities in Other Segments: While chargers lead, the Adapter segment is also experiencing substantial growth, driven by the need for efficient power supplies in consumer electronics and IT equipment. The "Others" segment, encompassing industrial automation, medical devices, and renewable energy systems, presents significant untapped potential, with market size projected to reach over $2 billion by 2025.
Synchronous Rectification ICs Product Innovations
Product innovations in synchronous rectification ICs are primarily focused on enhancing energy efficiency, reducing power losses, and enabling smaller form factors. Companies are leveraging advanced semiconductor materials like Gallium Nitride (GaN) and Silicon Carbide (SiC) to achieve higher switching frequencies and lower on-resistance, leading to significantly improved power conversion efficiency (PCE) of over 95%. Integrated solutions that combine synchronous rectification with advanced control features, such as adaptive on-time control and digital power management, are gaining traction. These innovations translate into more compact and cooler-running power adapters, chargers, and other power management systems, meeting the ever-increasing demands for portable, efficient, and high-performance electronic devices.
Propelling Factors for Synchronous Rectification ICs Growth
The growth of the Synchronous Rectification ICs market is propelled by several key factors. The global imperative for energy efficiency, driven by environmental concerns and governmental regulations, is a primary catalyst, pushing for the adoption of solutions that minimize wasted energy. The rapid expansion of consumer electronics, including smartphones, laptops, and wearables, all requiring efficient charging and power management, significantly boosts demand. Furthermore, the burgeoning electric vehicle (EV) market necessitates advanced power electronics for charging infrastructure and onboard power systems, creating substantial opportunities. Technological advancements, particularly the integration of GaN and SiC technologies, are enabling smaller, more powerful, and more efficient devices. The increasing adoption of USB Power Delivery (USB PD) standards across a wide range of devices also drives the demand for synchronous rectification ICs capable of handling higher power levels efficiently.
Obstacles in the Synchronous Rectification ICs Market
Despite robust growth, the Synchronous Rectification ICs market faces several obstacles. High manufacturing costs associated with advanced materials like GaN and SiC can be a deterrent for some applications. Supply chain disruptions, exacerbated by geopolitical factors and raw material availability, can lead to increased lead times and price volatility. Intense competition among a growing number of semiconductor manufacturers can put pressure on profit margins. Furthermore, the complexity of designing and integrating these advanced ICs can pose a challenge for some system designers, requiring specialized expertise. Evolving regulatory landscapes, while often a driver, can also create compliance hurdles and require continuous product adaptation.
Future Opportunities in Synchronous Rectification ICs
The future of the Synchronous Rectification ICs market is brimming with opportunities. The continued expansion of the Electric Vehicle (EV) market, both for onboard chargers and charging stations, presents a colossal growth avenue. The increasing demand for higher power density and efficiency in industrial power supplies, data centers, and renewable energy systems (solar inverters, wind turbines) will also fuel market expansion. The development of smart grids and the Internet of Things (IoT) will create a need for highly efficient and compact power management solutions. Innovations in wireless charging technology and the growing adoption of GaN-on-Si technology are expected to further drive market penetration and open up new application frontiers.
Major Players in the Synchronous Rectification ICs Ecosystem
- Texas Instruments
- NXP
- Onsemi
- Infineon
- Renesas
- STMicroelectronics
- ROHM
- Richtek
- Elevation Semiconductor
- Kiwi Instruments
- Maxic Technology
- Joulwatt
- Southchip Semiconductor Technology
- Global Semiconductor
- Lishengmei Semiconductor
- WINSEMI
- Dongke semiconductor
- Chipown Micro-electronics
- Silan Microelectronics
- CXW Technology
- Reactor Microelectronics
- Icm-Semi
- Fremont Micro Devices
- Chip-Hope
- Segments
Key Developments in Synchronous Rectification ICs Industry
- 2023 Q4: Launch of new GaN-based synchronous rectification ICs offering superior efficiency and thermal performance by multiple leading players.
- 2024 Q1: Increased investment in R&D for SiC-based solutions targeting high-voltage automotive applications.
- 2024 Q2: Acquisition of a specialized GaN power IC company by a major semiconductor conglomerate to bolster its portfolio.
- 2024 Q3: Significant increase in demand for synchronous rectification ICs for consumer electronics chargers, driven by new smartphone and laptop releases.
- 2024 Q4: Introduction of integrated synchronous rectification and controller ICs for simplified power supply design.
Strategic Synchronous Rectification ICs Market Forecast
The strategic outlook for the Synchronous Rectification ICs market remains exceptionally strong, driven by ongoing technological advancements and expanding application landscapes. The relentless pursuit of energy efficiency across all electronic devices, coupled with the rapid growth of sectors like electric vehicles and renewable energy, will continue to propel demand. Innovations in GaN and SiC technologies will unlock further performance gains, enabling smaller, more powerful, and more cost-effective solutions. Strategic collaborations and M&A activities are expected to shape the competitive environment, fostering innovation and market consolidation. The forecast period (2025-2033) is poised for sustained, high-percentage growth, solidifying synchronous rectification ICs as a cornerstone of modern power electronics.
Synchronous Rectification Ics Segmentation
-
1. Application
- 1.1. Charger
- 1.2. Adapter
- 1.3. Others
-
2. Type
- 2.1. Below 40V
- 2.2. 40-80V
- 2.3. 80-120V
- 2.4. Above 120V
Synchronous Rectification Ics Segmentation By Geography
-
1. North America
- 1.1. United States
- 1.2. Canada
- 1.3. Mexico
-
2. South America
- 2.1. Brazil
- 2.2. Argentina
- 2.3. Rest of South America
-
3. Europe
- 3.1. United Kingdom
- 3.2. Germany
- 3.3. France
- 3.4. Italy
- 3.5. Spain
- 3.6. Russia
- 3.7. Benelux
- 3.8. Nordics
- 3.9. Rest of Europe
-
4. Middle East & Africa
- 4.1. Turkey
- 4.2. Israel
- 4.3. GCC
- 4.4. North Africa
- 4.5. South Africa
- 4.6. Rest of Middle East & Africa
-
5. Asia Pacific
- 5.1. China
- 5.2. India
- 5.3. Japan
- 5.4. South Korea
- 5.5. ASEAN
- 5.6. Oceania
- 5.7. Rest of Asia Pacific
Synchronous Rectification Ics Regional Market Share
Geographic Coverage of Synchronous Rectification Ics
Synchronous Rectification Ics REPORT HIGHLIGHTS
| Aspects | Details |
|---|---|
| Study Period | 2020-2034 |
| Base Year | 2025 |
| Estimated Year | 2026 |
| Forecast Period | 2026-2034 |
| Historical Period | 2020-2025 |
| Growth Rate | CAGR of 9.2% from 2020-2034 |
| Segmentation |
|
Table of Contents
- 1. Introduction
- 1.1. Research Scope
- 1.2. Market Segmentation
- 1.3. Research Objective
- 1.4. Definitions and Assumptions
- 2. Executive Summary
- 2.1. Market Snapshot
- 3. Market Dynamics
- 3.1. Market Drivers
- 3.2. Market Restrains
- 3.3. Market Trends
- 3.4. Market Opportunities
- 4. Market Factor Analysis
- 4.1. Porters Five Forces
- 4.1.1. Bargaining Power of Suppliers
- 4.1.2. Bargaining Power of Buyers
- 4.1.3. Threat of New Entrants
- 4.1.4. Threat of Substitutes
- 4.1.5. Competitive Rivalry
- 4.2. PESTEL analysis
- 4.3. BCG Analysis
- 4.3.1. Stars (High Growth, High Market Share)
- 4.3.2. Cash Cows (Low Growth, High Market Share)
- 4.3.3. Question Mark (High Growth, Low Market Share)
- 4.3.4. Dogs (Low Growth, Low Market Share)
- 4.4. Ansoff Matrix Analysis
- 4.5. Supply Chain Analysis
- 4.6. Regulatory Landscape
- 4.7. Current Market Potential and Opportunity Assessment (TAM–SAM–SOM Framework)
- 4.8. DMV Analyst Note
- 4.1. Porters Five Forces
- 5. Market Analysis, Insights and Forecast 2021-2033
- 5.1. Market Analysis, Insights and Forecast - by Application
- 5.1.1. Charger
- 5.1.2. Adapter
- 5.1.3. Others
- 5.2. Market Analysis, Insights and Forecast - by Type
- 5.2.1. Below 40V
- 5.2.2. 40-80V
- 5.2.3. 80-120V
- 5.2.4. Above 120V
- 5.3. Market Analysis, Insights and Forecast - by Region
- 5.3.1. North America
- 5.3.2. South America
- 5.3.3. Europe
- 5.3.4. Middle East & Africa
- 5.3.5. Asia Pacific
- 5.1. Market Analysis, Insights and Forecast - by Application
- 6. Global Synchronous Rectification Ics Analysis, Insights and Forecast, 2021-2033
- 6.1. Market Analysis, Insights and Forecast - by Application
- 6.1.1. Charger
- 6.1.2. Adapter
- 6.1.3. Others
- 6.2. Market Analysis, Insights and Forecast - by Type
- 6.2.1. Below 40V
- 6.2.2. 40-80V
- 6.2.3. 80-120V
- 6.2.4. Above 120V
- 6.1. Market Analysis, Insights and Forecast - by Application
- 7. North America Synchronous Rectification Ics Analysis, Insights and Forecast, 2020-2032
- 7.1. Market Analysis, Insights and Forecast - by Application
- 7.1.1. Charger
- 7.1.2. Adapter
- 7.1.3. Others
- 7.2. Market Analysis, Insights and Forecast - by Type
- 7.2.1. Below 40V
- 7.2.2. 40-80V
- 7.2.3. 80-120V
- 7.2.4. Above 120V
- 7.1. Market Analysis, Insights and Forecast - by Application
- 8. South America Synchronous Rectification Ics Analysis, Insights and Forecast, 2020-2032
- 8.1. Market Analysis, Insights and Forecast - by Application
- 8.1.1. Charger
- 8.1.2. Adapter
- 8.1.3. Others
- 8.2. Market Analysis, Insights and Forecast - by Type
- 8.2.1. Below 40V
- 8.2.2. 40-80V
- 8.2.3. 80-120V
- 8.2.4. Above 120V
- 8.1. Market Analysis, Insights and Forecast - by Application
- 9. Europe Synchronous Rectification Ics Analysis, Insights and Forecast, 2020-2032
- 9.1. Market Analysis, Insights and Forecast - by Application
- 9.1.1. Charger
- 9.1.2. Adapter
- 9.1.3. Others
- 9.2. Market Analysis, Insights and Forecast - by Type
- 9.2.1. Below 40V
- 9.2.2. 40-80V
- 9.2.3. 80-120V
- 9.2.4. Above 120V
- 9.1. Market Analysis, Insights and Forecast - by Application
- 10. Middle East & Africa Synchronous Rectification Ics Analysis, Insights and Forecast, 2020-2032
- 10.1. Market Analysis, Insights and Forecast - by Application
- 10.1.1. Charger
- 10.1.2. Adapter
- 10.1.3. Others
- 10.2. Market Analysis, Insights and Forecast - by Type
- 10.2.1. Below 40V
- 10.2.2. 40-80V
- 10.2.3. 80-120V
- 10.2.4. Above 120V
- 10.1. Market Analysis, Insights and Forecast - by Application
- 11. Asia Pacific Synchronous Rectification Ics Analysis, Insights and Forecast, 2020-2032
- 11.1. Market Analysis, Insights and Forecast - by Application
- 11.1.1. Charger
- 11.1.2. Adapter
- 11.1.3. Others
- 11.2. Market Analysis, Insights and Forecast - by Type
- 11.2.1. Below 40V
- 11.2.2. 40-80V
- 11.2.3. 80-120V
- 11.2.4. Above 120V
- 11.1. Market Analysis, Insights and Forecast - by Application
- 12. Competitive Analysis
- 12.1. Company Profiles
- 12.1.1 Texas Instruments
- 12.1.1.1. Company Overview
- 12.1.1.2. Products
- 12.1.1.3. Company Financials
- 12.1.1.4. SWOT Analysis
- 12.1.2 NXP
- 12.1.2.1. Company Overview
- 12.1.2.2. Products
- 12.1.2.3. Company Financials
- 12.1.2.4. SWOT Analysis
- 12.1.3 Onsemi
- 12.1.3.1. Company Overview
- 12.1.3.2. Products
- 12.1.3.3. Company Financials
- 12.1.3.4. SWOT Analysis
- 12.1.4 Infineon
- 12.1.4.1. Company Overview
- 12.1.4.2. Products
- 12.1.4.3. Company Financials
- 12.1.4.4. SWOT Analysis
- 12.1.5 Renesas
- 12.1.5.1. Company Overview
- 12.1.5.2. Products
- 12.1.5.3. Company Financials
- 12.1.5.4. SWOT Analysis
- 12.1.6 STMicroelectronics
- 12.1.6.1. Company Overview
- 12.1.6.2. Products
- 12.1.6.3. Company Financials
- 12.1.6.4. SWOT Analysis
- 12.1.7 ROHM
- 12.1.7.1. Company Overview
- 12.1.7.2. Products
- 12.1.7.3. Company Financials
- 12.1.7.4. SWOT Analysis
- 12.1.8 Richtek
- 12.1.8.1. Company Overview
- 12.1.8.2. Products
- 12.1.8.3. Company Financials
- 12.1.8.4. SWOT Analysis
- 12.1.9 Elevation Semiconductor
- 12.1.9.1. Company Overview
- 12.1.9.2. Products
- 12.1.9.3. Company Financials
- 12.1.9.4. SWOT Analysis
- 12.1.10 Kiwi Instruments
- 12.1.10.1. Company Overview
- 12.1.10.2. Products
- 12.1.10.3. Company Financials
- 12.1.10.4. SWOT Analysis
- 12.1.11 Maxic Technology
- 12.1.11.1. Company Overview
- 12.1.11.2. Products
- 12.1.11.3. Company Financials
- 12.1.11.4. SWOT Analysis
- 12.1.12 Joulwatt
- 12.1.12.1. Company Overview
- 12.1.12.2. Products
- 12.1.12.3. Company Financials
- 12.1.12.4. SWOT Analysis
- 12.1.13 Southchip Semiconductor Technology
- 12.1.13.1. Company Overview
- 12.1.13.2. Products
- 12.1.13.3. Company Financials
- 12.1.13.4. SWOT Analysis
- 12.1.14 Global Semiconductor
- 12.1.14.1. Company Overview
- 12.1.14.2. Products
- 12.1.14.3. Company Financials
- 12.1.14.4. SWOT Analysis
- 12.1.15 Lishengmei Semiconductor
- 12.1.15.1. Company Overview
- 12.1.15.2. Products
- 12.1.15.3. Company Financials
- 12.1.15.4. SWOT Analysis
- 12.1.16 WINSEMI
- 12.1.16.1. Company Overview
- 12.1.16.2. Products
- 12.1.16.3. Company Financials
- 12.1.16.4. SWOT Analysis
- 12.1.17 Dongke semiconductor
- 12.1.17.1. Company Overview
- 12.1.17.2. Products
- 12.1.17.3. Company Financials
- 12.1.17.4. SWOT Analysis
- 12.1.18 Chipown Micro-electronics
- 12.1.18.1. Company Overview
- 12.1.18.2. Products
- 12.1.18.3. Company Financials
- 12.1.18.4. SWOT Analysis
- 12.1.19 Silan Microelectronics
- 12.1.19.1. Company Overview
- 12.1.19.2. Products
- 12.1.19.3. Company Financials
- 12.1.19.4. SWOT Analysis
- 12.1.20 CXW Technology
- 12.1.20.1. Company Overview
- 12.1.20.2. Products
- 12.1.20.3. Company Financials
- 12.1.20.4. SWOT Analysis
- 12.1.21 Reactor Microelectronics
- 12.1.21.1. Company Overview
- 12.1.21.2. Products
- 12.1.21.3. Company Financials
- 12.1.21.4. SWOT Analysis
- 12.1.22 Icm-Semi
- 12.1.22.1. Company Overview
- 12.1.22.2. Products
- 12.1.22.3. Company Financials
- 12.1.22.4. SWOT Analysis
- 12.1.23 Fremont Micro Devices
- 12.1.23.1. Company Overview
- 12.1.23.2. Products
- 12.1.23.3. Company Financials
- 12.1.23.4. SWOT Analysis
- 12.1.24 Chip-Hope
- 12.1.24.1. Company Overview
- 12.1.24.2. Products
- 12.1.24.3. Company Financials
- 12.1.24.4. SWOT Analysis
- 12.1.1 Texas Instruments
- 12.2. Market Entropy
- 12.2.1 Company's Key Areas Served
- 12.2.2 Recent Developments
- 12.3. Company Market Share Analysis 2025
- 12.3.1 Top 5 Companies Market Share Analysis
- 12.3.2 Top 3 Companies Market Share Analysis
- 12.4. List of Potential Customers
- 13. Research Methodology
List of Figures
- Figure 1: Global Synchronous Rectification Ics Revenue Breakdown (undefined, %) by Region 2025 & 2033
- Figure 2: Global Synchronous Rectification Ics Volume Breakdown (K, %) by Region 2025 & 2033
- Figure 3: North America Synchronous Rectification Ics Revenue (undefined), by Application 2025 & 2033
- Figure 4: North America Synchronous Rectification Ics Volume (K), by Application 2025 & 2033
- Figure 5: North America Synchronous Rectification Ics Revenue Share (%), by Application 2025 & 2033
- Figure 6: North America Synchronous Rectification Ics Volume Share (%), by Application 2025 & 2033
- Figure 7: North America Synchronous Rectification Ics Revenue (undefined), by Type 2025 & 2033
- Figure 8: North America Synchronous Rectification Ics Volume (K), by Type 2025 & 2033
- Figure 9: North America Synchronous Rectification Ics Revenue Share (%), by Type 2025 & 2033
- Figure 10: North America Synchronous Rectification Ics Volume Share (%), by Type 2025 & 2033
- Figure 11: North America Synchronous Rectification Ics Revenue (undefined), by Country 2025 & 2033
- Figure 12: North America Synchronous Rectification Ics Volume (K), by Country 2025 & 2033
- Figure 13: North America Synchronous Rectification Ics Revenue Share (%), by Country 2025 & 2033
- Figure 14: North America Synchronous Rectification Ics Volume Share (%), by Country 2025 & 2033
- Figure 15: South America Synchronous Rectification Ics Revenue (undefined), by Application 2025 & 2033
- Figure 16: South America Synchronous Rectification Ics Volume (K), by Application 2025 & 2033
- Figure 17: South America Synchronous Rectification Ics Revenue Share (%), by Application 2025 & 2033
- Figure 18: South America Synchronous Rectification Ics Volume Share (%), by Application 2025 & 2033
- Figure 19: South America Synchronous Rectification Ics Revenue (undefined), by Type 2025 & 2033
- Figure 20: South America Synchronous Rectification Ics Volume (K), by Type 2025 & 2033
- Figure 21: South America Synchronous Rectification Ics Revenue Share (%), by Type 2025 & 2033
- Figure 22: South America Synchronous Rectification Ics Volume Share (%), by Type 2025 & 2033
- Figure 23: South America Synchronous Rectification Ics Revenue (undefined), by Country 2025 & 2033
- Figure 24: South America Synchronous Rectification Ics Volume (K), by Country 2025 & 2033
- Figure 25: South America Synchronous Rectification Ics Revenue Share (%), by Country 2025 & 2033
- Figure 26: South America Synchronous Rectification Ics Volume Share (%), by Country 2025 & 2033
- Figure 27: Europe Synchronous Rectification Ics Revenue (undefined), by Application 2025 & 2033
- Figure 28: Europe Synchronous Rectification Ics Volume (K), by Application 2025 & 2033
- Figure 29: Europe Synchronous Rectification Ics Revenue Share (%), by Application 2025 & 2033
- Figure 30: Europe Synchronous Rectification Ics Volume Share (%), by Application 2025 & 2033
- Figure 31: Europe Synchronous Rectification Ics Revenue (undefined), by Type 2025 & 2033
- Figure 32: Europe Synchronous Rectification Ics Volume (K), by Type 2025 & 2033
- Figure 33: Europe Synchronous Rectification Ics Revenue Share (%), by Type 2025 & 2033
- Figure 34: Europe Synchronous Rectification Ics Volume Share (%), by Type 2025 & 2033
- Figure 35: Europe Synchronous Rectification Ics Revenue (undefined), by Country 2025 & 2033
- Figure 36: Europe Synchronous Rectification Ics Volume (K), by Country 2025 & 2033
- Figure 37: Europe Synchronous Rectification Ics Revenue Share (%), by Country 2025 & 2033
- Figure 38: Europe Synchronous Rectification Ics Volume Share (%), by Country 2025 & 2033
- Figure 39: Middle East & Africa Synchronous Rectification Ics Revenue (undefined), by Application 2025 & 2033
- Figure 40: Middle East & Africa Synchronous Rectification Ics Volume (K), by Application 2025 & 2033
- Figure 41: Middle East & Africa Synchronous Rectification Ics Revenue Share (%), by Application 2025 & 2033
- Figure 42: Middle East & Africa Synchronous Rectification Ics Volume Share (%), by Application 2025 & 2033
- Figure 43: Middle East & Africa Synchronous Rectification Ics Revenue (undefined), by Type 2025 & 2033
- Figure 44: Middle East & Africa Synchronous Rectification Ics Volume (K), by Type 2025 & 2033
- Figure 45: Middle East & Africa Synchronous Rectification Ics Revenue Share (%), by Type 2025 & 2033
- Figure 46: Middle East & Africa Synchronous Rectification Ics Volume Share (%), by Type 2025 & 2033
- Figure 47: Middle East & Africa Synchronous Rectification Ics Revenue (undefined), by Country 2025 & 2033
- Figure 48: Middle East & Africa Synchronous Rectification Ics Volume (K), by Country 2025 & 2033
- Figure 49: Middle East & Africa Synchronous Rectification Ics Revenue Share (%), by Country 2025 & 2033
- Figure 50: Middle East & Africa Synchronous Rectification Ics Volume Share (%), by Country 2025 & 2033
- Figure 51: Asia Pacific Synchronous Rectification Ics Revenue (undefined), by Application 2025 & 2033
- Figure 52: Asia Pacific Synchronous Rectification Ics Volume (K), by Application 2025 & 2033
- Figure 53: Asia Pacific Synchronous Rectification Ics Revenue Share (%), by Application 2025 & 2033
- Figure 54: Asia Pacific Synchronous Rectification Ics Volume Share (%), by Application 2025 & 2033
- Figure 55: Asia Pacific Synchronous Rectification Ics Revenue (undefined), by Type 2025 & 2033
- Figure 56: Asia Pacific Synchronous Rectification Ics Volume (K), by Type 2025 & 2033
- Figure 57: Asia Pacific Synchronous Rectification Ics Revenue Share (%), by Type 2025 & 2033
- Figure 58: Asia Pacific Synchronous Rectification Ics Volume Share (%), by Type 2025 & 2033
- Figure 59: Asia Pacific Synchronous Rectification Ics Revenue (undefined), by Country 2025 & 2033
- Figure 60: Asia Pacific Synchronous Rectification Ics Volume (K), by Country 2025 & 2033
- Figure 61: Asia Pacific Synchronous Rectification Ics Revenue Share (%), by Country 2025 & 2033
- Figure 62: Asia Pacific Synchronous Rectification Ics Volume Share (%), by Country 2025 & 2033
List of Tables
- Table 1: Global Synchronous Rectification Ics Revenue undefined Forecast, by Application 2020 & 2033
- Table 2: Global Synchronous Rectification Ics Volume K Forecast, by Application 2020 & 2033
- Table 3: Global Synchronous Rectification Ics Revenue undefined Forecast, by Type 2020 & 2033
- Table 4: Global Synchronous Rectification Ics Volume K Forecast, by Type 2020 & 2033
- Table 5: Global Synchronous Rectification Ics Revenue undefined Forecast, by Region 2020 & 2033
- Table 6: Global Synchronous Rectification Ics Volume K Forecast, by Region 2020 & 2033
- Table 7: Global Synchronous Rectification Ics Revenue undefined Forecast, by Application 2020 & 2033
- Table 8: Global Synchronous Rectification Ics Volume K Forecast, by Application 2020 & 2033
- Table 9: Global Synchronous Rectification Ics Revenue undefined Forecast, by Type 2020 & 2033
- Table 10: Global Synchronous Rectification Ics Volume K Forecast, by Type 2020 & 2033
- Table 11: Global Synchronous Rectification Ics Revenue undefined Forecast, by Country 2020 & 2033
- Table 12: Global Synchronous Rectification Ics Volume K Forecast, by Country 2020 & 2033
- Table 13: United States Synchronous Rectification Ics Revenue (undefined) Forecast, by Application 2020 & 2033
- Table 14: United States Synchronous Rectification Ics Volume (K) Forecast, by Application 2020 & 2033
- Table 15: Canada Synchronous Rectification Ics Revenue (undefined) Forecast, by Application 2020 & 2033
- Table 16: Canada Synchronous Rectification Ics Volume (K) Forecast, by Application 2020 & 2033
- Table 17: Mexico Synchronous Rectification Ics Revenue (undefined) Forecast, by Application 2020 & 2033
- Table 18: Mexico Synchronous Rectification Ics Volume (K) Forecast, by Application 2020 & 2033
- Table 19: Global Synchronous Rectification Ics Revenue undefined Forecast, by Application 2020 & 2033
- Table 20: Global Synchronous Rectification Ics Volume K Forecast, by Application 2020 & 2033
- Table 21: Global Synchronous Rectification Ics Revenue undefined Forecast, by Type 2020 & 2033
- Table 22: Global Synchronous Rectification Ics Volume K Forecast, by Type 2020 & 2033
- Table 23: Global Synchronous Rectification Ics Revenue undefined Forecast, by Country 2020 & 2033
- Table 24: Global Synchronous Rectification Ics Volume K Forecast, by Country 2020 & 2033
- Table 25: Brazil Synchronous Rectification Ics Revenue (undefined) Forecast, by Application 2020 & 2033
- Table 26: Brazil Synchronous Rectification Ics Volume (K) Forecast, by Application 2020 & 2033
- Table 27: Argentina Synchronous Rectification Ics Revenue (undefined) Forecast, by Application 2020 & 2033
- Table 28: Argentina Synchronous Rectification Ics Volume (K) Forecast, by Application 2020 & 2033
- Table 29: Rest of South America Synchronous Rectification Ics Revenue (undefined) Forecast, by Application 2020 & 2033
- Table 30: Rest of South America Synchronous Rectification Ics Volume (K) Forecast, by Application 2020 & 2033
- Table 31: Global Synchronous Rectification Ics Revenue undefined Forecast, by Application 2020 & 2033
- Table 32: Global Synchronous Rectification Ics Volume K Forecast, by Application 2020 & 2033
- Table 33: Global Synchronous Rectification Ics Revenue undefined Forecast, by Type 2020 & 2033
- Table 34: Global Synchronous Rectification Ics Volume K Forecast, by Type 2020 & 2033
- Table 35: Global Synchronous Rectification Ics Revenue undefined Forecast, by Country 2020 & 2033
- Table 36: Global Synchronous Rectification Ics Volume K Forecast, by Country 2020 & 2033
- Table 37: United Kingdom Synchronous Rectification Ics Revenue (undefined) Forecast, by Application 2020 & 2033
- Table 38: United Kingdom Synchronous Rectification Ics Volume (K) Forecast, by Application 2020 & 2033
- Table 39: Germany Synchronous Rectification Ics Revenue (undefined) Forecast, by Application 2020 & 2033
- Table 40: Germany Synchronous Rectification Ics Volume (K) Forecast, by Application 2020 & 2033
- Table 41: France Synchronous Rectification Ics Revenue (undefined) Forecast, by Application 2020 & 2033
- Table 42: France Synchronous Rectification Ics Volume (K) Forecast, by Application 2020 & 2033
- Table 43: Italy Synchronous Rectification Ics Revenue (undefined) Forecast, by Application 2020 & 2033
- Table 44: Italy Synchronous Rectification Ics Volume (K) Forecast, by Application 2020 & 2033
- Table 45: Spain Synchronous Rectification Ics Revenue (undefined) Forecast, by Application 2020 & 2033
- Table 46: Spain Synchronous Rectification Ics Volume (K) Forecast, by Application 2020 & 2033
- Table 47: Russia Synchronous Rectification Ics Revenue (undefined) Forecast, by Application 2020 & 2033
- Table 48: Russia Synchronous Rectification Ics Volume (K) Forecast, by Application 2020 & 2033
- Table 49: Benelux Synchronous Rectification Ics Revenue (undefined) Forecast, by Application 2020 & 2033
- Table 50: Benelux Synchronous Rectification Ics Volume (K) Forecast, by Application 2020 & 2033
- Table 51: Nordics Synchronous Rectification Ics Revenue (undefined) Forecast, by Application 2020 & 2033
- Table 52: Nordics Synchronous Rectification Ics Volume (K) Forecast, by Application 2020 & 2033
- Table 53: Rest of Europe Synchronous Rectification Ics Revenue (undefined) Forecast, by Application 2020 & 2033
- Table 54: Rest of Europe Synchronous Rectification Ics Volume (K) Forecast, by Application 2020 & 2033
- Table 55: Global Synchronous Rectification Ics Revenue undefined Forecast, by Application 2020 & 2033
- Table 56: Global Synchronous Rectification Ics Volume K Forecast, by Application 2020 & 2033
- Table 57: Global Synchronous Rectification Ics Revenue undefined Forecast, by Type 2020 & 2033
- Table 58: Global Synchronous Rectification Ics Volume K Forecast, by Type 2020 & 2033
- Table 59: Global Synchronous Rectification Ics Revenue undefined Forecast, by Country 2020 & 2033
- Table 60: Global Synchronous Rectification Ics Volume K Forecast, by Country 2020 & 2033
- Table 61: Turkey Synchronous Rectification Ics Revenue (undefined) Forecast, by Application 2020 & 2033
- Table 62: Turkey Synchronous Rectification Ics Volume (K) Forecast, by Application 2020 & 2033
- Table 63: Israel Synchronous Rectification Ics Revenue (undefined) Forecast, by Application 2020 & 2033
- Table 64: Israel Synchronous Rectification Ics Volume (K) Forecast, by Application 2020 & 2033
- Table 65: GCC Synchronous Rectification Ics Revenue (undefined) Forecast, by Application 2020 & 2033
- Table 66: GCC Synchronous Rectification Ics Volume (K) Forecast, by Application 2020 & 2033
- Table 67: North Africa Synchronous Rectification Ics Revenue (undefined) Forecast, by Application 2020 & 2033
- Table 68: North Africa Synchronous Rectification Ics Volume (K) Forecast, by Application 2020 & 2033
- Table 69: South Africa Synchronous Rectification Ics Revenue (undefined) Forecast, by Application 2020 & 2033
- Table 70: South Africa Synchronous Rectification Ics Volume (K) Forecast, by Application 2020 & 2033
- Table 71: Rest of Middle East & Africa Synchronous Rectification Ics Revenue (undefined) Forecast, by Application 2020 & 2033
- Table 72: Rest of Middle East & Africa Synchronous Rectification Ics Volume (K) Forecast, by Application 2020 & 2033
- Table 73: Global Synchronous Rectification Ics Revenue undefined Forecast, by Application 2020 & 2033
- Table 74: Global Synchronous Rectification Ics Volume K Forecast, by Application 2020 & 2033
- Table 75: Global Synchronous Rectification Ics Revenue undefined Forecast, by Type 2020 & 2033
- Table 76: Global Synchronous Rectification Ics Volume K Forecast, by Type 2020 & 2033
- Table 77: Global Synchronous Rectification Ics Revenue undefined Forecast, by Country 2020 & 2033
- Table 78: Global Synchronous Rectification Ics Volume K Forecast, by Country 2020 & 2033
- Table 79: China Synchronous Rectification Ics Revenue (undefined) Forecast, by Application 2020 & 2033
- Table 80: China Synchronous Rectification Ics Volume (K) Forecast, by Application 2020 & 2033
- Table 81: India Synchronous Rectification Ics Revenue (undefined) Forecast, by Application 2020 & 2033
- Table 82: India Synchronous Rectification Ics Volume (K) Forecast, by Application 2020 & 2033
- Table 83: Japan Synchronous Rectification Ics Revenue (undefined) Forecast, by Application 2020 & 2033
- Table 84: Japan Synchronous Rectification Ics Volume (K) Forecast, by Application 2020 & 2033
- Table 85: South Korea Synchronous Rectification Ics Revenue (undefined) Forecast, by Application 2020 & 2033
- Table 86: South Korea Synchronous Rectification Ics Volume (K) Forecast, by Application 2020 & 2033
- Table 87: ASEAN Synchronous Rectification Ics Revenue (undefined) Forecast, by Application 2020 & 2033
- Table 88: ASEAN Synchronous Rectification Ics Volume (K) Forecast, by Application 2020 & 2033
- Table 89: Oceania Synchronous Rectification Ics Revenue (undefined) Forecast, by Application 2020 & 2033
- Table 90: Oceania Synchronous Rectification Ics Volume (K) Forecast, by Application 2020 & 2033
- Table 91: Rest of Asia Pacific Synchronous Rectification Ics Revenue (undefined) Forecast, by Application 2020 & 2033
- Table 92: Rest of Asia Pacific Synchronous Rectification Ics Volume (K) Forecast, by Application 2020 & 2033
Frequently Asked Questions
1. What is the projected Compound Annual Growth Rate (CAGR) of the Synchronous Rectification Ics?
The projected CAGR is approximately 9.2%.
2. Which companies are prominent players in the Synchronous Rectification Ics?
Key companies in the market include Texas Instruments, NXP, Onsemi, Infineon, Renesas, STMicroelectronics, ROHM, Richtek, Elevation Semiconductor, Kiwi Instruments, Maxic Technology, Joulwatt, Southchip Semiconductor Technology, Global Semiconductor, Lishengmei Semiconductor, WINSEMI, Dongke semiconductor, Chipown Micro-electronics, Silan Microelectronics, CXW Technology, Reactor Microelectronics, Icm-Semi, Fremont Micro Devices, Chip-Hope.
3. What are the main segments of the Synchronous Rectification Ics?
The market segments include Application, Type.
4. Can you provide details about the market size?
The market size is estimated to be USD XXX N/A as of 2022.
5. What are some drivers contributing to market growth?
N/A
6. What are the notable trends driving market growth?
N/A
7. Are there any restraints impacting market growth?
N/A
8. Can you provide examples of recent developments in the market?
N/A
9. What pricing options are available for accessing the report?
Pricing options include single-user, multi-user, and enterprise licenses priced at USD 3950.00, USD 5925.00, and USD 7900.00 respectively.
10. Is the market size provided in terms of value or volume?
The market size is provided in terms of value, measured in N/A and volume, measured in K.
11. Are there any specific market keywords associated with the report?
Yes, the market keyword associated with the report is "Synchronous Rectification Ics," which aids in identifying and referencing the specific market segment covered.
12. How do I determine which pricing option suits my needs best?
The pricing options vary based on user requirements and access needs. Individual users may opt for single-user licenses, while businesses requiring broader access may choose multi-user or enterprise licenses for cost-effective access to the report.
13. Are there any additional resources or data provided in the Synchronous Rectification Ics report?
While the report offers comprehensive insights, it's advisable to review the specific contents or supplementary materials provided to ascertain if additional resources or data are available.
14. How can I stay updated on further developments or reports in the Synchronous Rectification Ics?
To stay informed about further developments, trends, and reports in the Synchronous Rectification Ics, consider subscribing to industry newsletters, following relevant companies and organizations, or regularly checking reputable industry news sources and publications.
Methodology
Step 1 - Identification of Relevant Samples Size from Population Database


Step 2 - Approaches for Defining Global Market Size (Value, Volume* & Price*)

Note*: In applicable scenarios
Step 3 - Data Sources
Primary Research
- Web Analytics
- Survey Reports
- Research Institute
- Latest Research Reports
- Opinion Leaders
Secondary Research
- Annual Reports
- White Paper
- Latest Press Release
- Industry Association
- Paid Database
- Investor Presentations

Step 4 - Data Triangulation
Involves using different sources of information in order to increase the validity of a study
These sources are likely to be stakeholders in a program - participants, other researchers, program staff, other community members, and so on.
Then we put all data in single framework & apply various statistical tools to find out the dynamic on the market.
During the analysis stage, feedback from the stakeholder groups would be compared to determine areas of agreement as well as areas of divergence