

Key Insights
The global surface vision and inspection equipment market is poised for substantial growth, projected to achieve a Compound Annual Growth Rate (CAGR) of 14.56% from 2025 to 2033. This expansion is propelled by increasing industrial automation, particularly within the automotive, electronics, and pharmaceutical sectors. Advanced technologies, including AI-powered image processing and machine learning, are enhancing defect detection, operational efficiency, and throughput. Stringent quality control mandates and regulatory compliance further drive market adoption. The market is segmented by components such as cameras, lighting, and optics, and by applications including automotive, electronics, medical, and food & beverage. The market size is estimated to reach $14.86 billion by 2025.
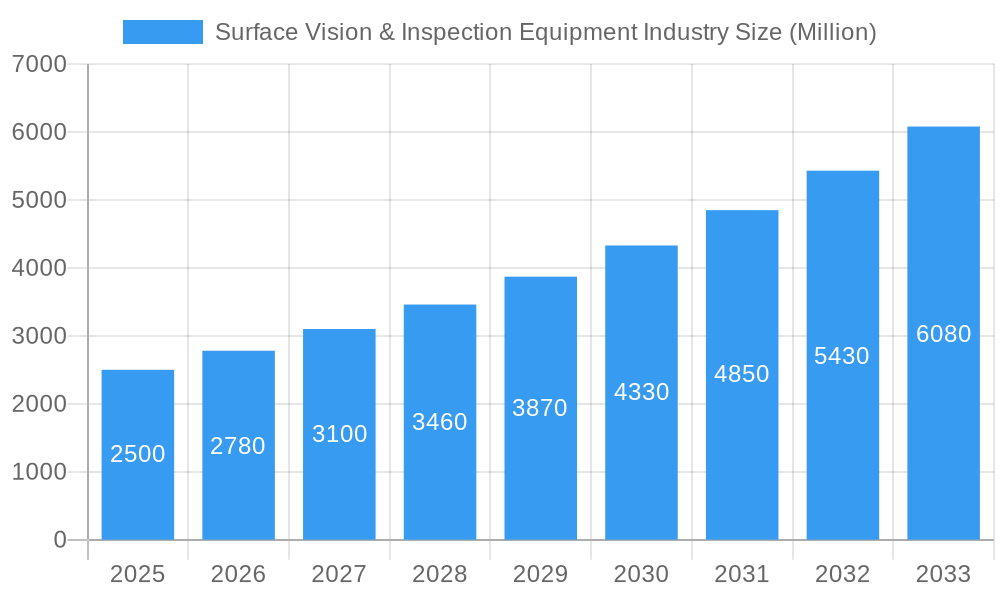
Surface Vision & Inspection Equipment Industry Market Size (In Billion)
Key industry players like Cognex, Keyence, and Matrox are actively pursuing innovation, strategic partnerships, and mergers to expand their market presence. While North America and Europe lead in market share due to technological advancements, the Asia-Pacific region is experiencing accelerated growth driven by burgeoning industrialization. Continued progress in sensor technology, software algorithms, and the adoption of Industry 4.0 principles will sustain this upward trajectory. Initial investment costs and integration complexities present challenges, but the long-term benefits of superior product quality and operational efficiency will continue to fuel market expansion.
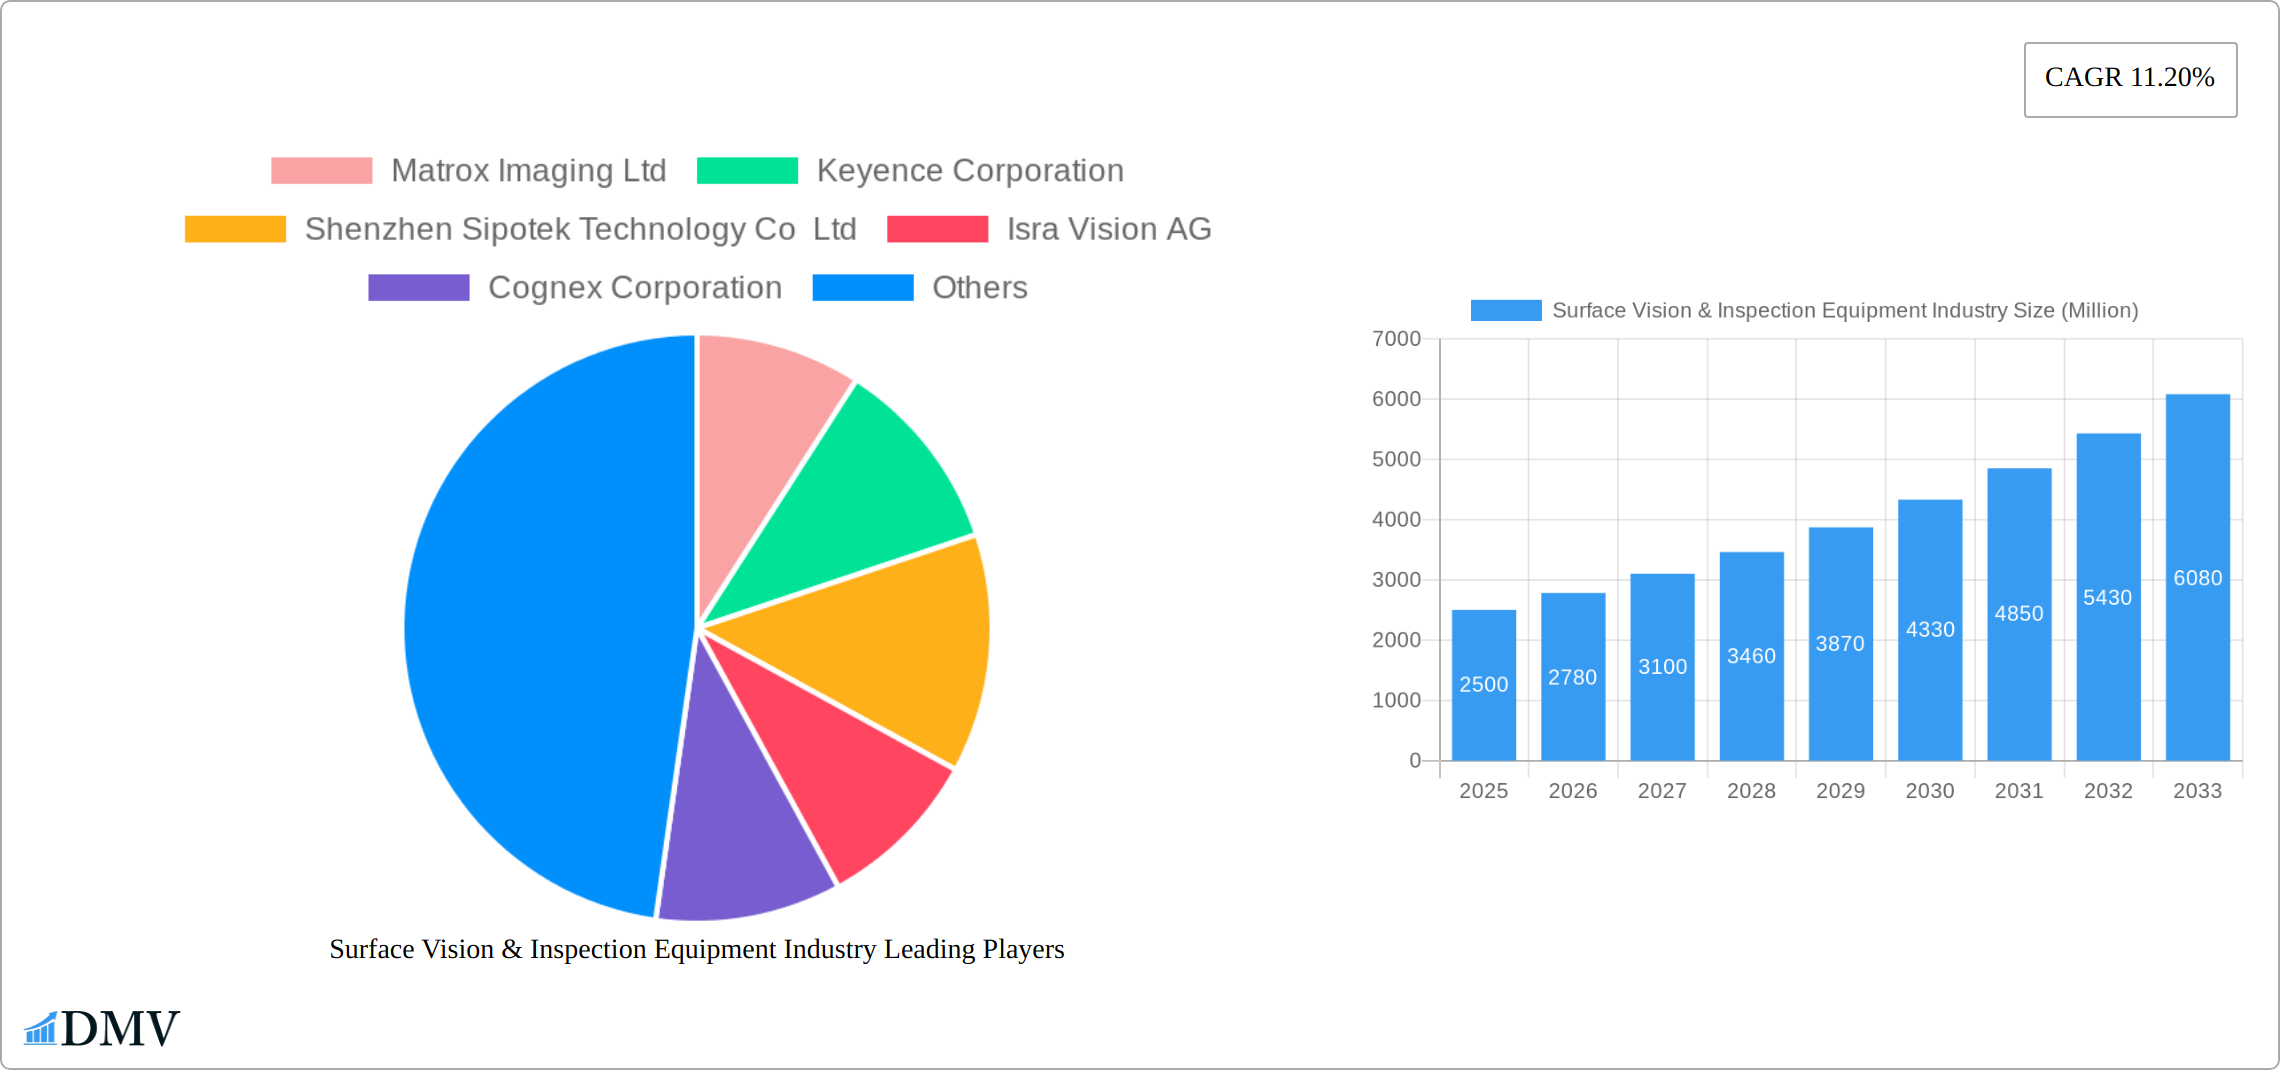
Surface Vision & Inspection Equipment Industry Company Market Share
Surface Vision & Inspection Equipment Industry Market Report: 2019-2033
This comprehensive report provides a detailed analysis of the global Surface Vision & Inspection Equipment market, offering invaluable insights for stakeholders seeking to understand market dynamics, future trends, and investment opportunities. The study period spans 2019-2033, with 2025 serving as the base and estimated year. The forecast period covers 2025-2033, while the historical period encompasses 2019-2024. The report features in-depth analysis of leading players such as Matrox Imaging Ltd, Keyence Corporation, Shenzhen Sipotek Technology Co Ltd, Isra Vision AG, Cognex Corporation, Stemmer Imaging AG, AMETEK Surface Vision, Omron Corporation, Comvis AG, Daitron Inc, Flexfilm Ltd, Edmund Scientific Corporation, and Panasonic Corporation – a list which is not exhaustive. The market is segmented by component (Camera, Lighting Equipment, Optics, Other Components) and application (Automotive, Electrical & Electronics, Medical & Pharmaceuticals, Food & Beverages, Postal & Logistics, Other Applications). This report projects a market value exceeding $XX Million by 2033.
Surface Vision & Inspection Equipment Industry Market Composition & Trends
The Surface Vision & Inspection Equipment market is characterized by a dynamic and evolving landscape, featuring both established industry leaders and innovative niche players. As of 2025, the market exhibits a moderately concentrated structure, with the top 5 prominent companies collectively commanding approximately 60% of the market share. The remaining 40% is diversified across a broad spectrum of smaller enterprises and specialized solution providers.
A significant impetus for market growth stems from continuous innovation, particularly the integration of cutting-edge technologies such as Artificial Intelligence (AI), Machine Learning (ML), and advanced high-resolution imaging. These advancements are crucial for developing more sophisticated and efficient inspection solutions. The regulatory environment presents a varied picture across different geographical regions. Stringent compliance standards, especially within the highly regulated medical and pharmaceutical sectors, are influencing the pace of adoption and the specific requirements for inspection equipment.
While automated systems are increasingly favored for their superior efficiency and accuracy, traditional manual inspection methods still retain relevance for specific low-volume or specialized applications. The primary end-user industries driving demand include the automotive, electronics, and pharmaceutical sectors, each with its unique quality control needs. Merger and acquisition (M&A) activity has been observed to be moderate in recent years. Between 2019 and 2024, the average deal value for transactions in this sector was estimated at approximately $XX Million, indicating strategic consolidation and growth opportunities.
- Market Share Distribution (Estimated 2025): Top 5 Players: 60%; Remaining Players: 40%
- Average M&A Deal Value (2019-2024): $XX Million
- Key Innovation Catalysts: Advancements in AI, Machine Learning, and High-Resolution Imaging Technologies
- Dominant End-User Industries: Automotive, Electronics, Pharmaceuticals
Surface Vision & Inspection Equipment Industry Industry Evolution
The Surface Vision & Inspection Equipment industry has witnessed substantial growth over the past five years, driven primarily by increasing automation across various sectors. The market exhibited a Compound Annual Growth Rate (CAGR) of approximately XX% during the historical period (2019-2024). This growth trajectory is projected to continue, albeit at a slightly moderated pace, with a forecasted CAGR of XX% during the period 2025-2033. Technological advancements, including the integration of advanced algorithms and improved sensor technologies, have enhanced inspection speed, accuracy, and capabilities. Consumer demand for higher quality and improved efficiency in manufacturing and logistics processes fuels continued market expansion. Adoption of automated inspection systems has increased significantly in recent years, particularly within high-volume manufacturing settings. The industry is poised for further growth as the adoption of advanced technologies continues, driving demand for more sophisticated and adaptable solutions. Specifically, the integration of AI-powered systems and cloud-based solutions is enhancing data analysis and predictive maintenance capabilities within the industry.
Leading Regions, Countries, or Segments in Surface Vision & Inspection Equipment Industry
North America currently holds the largest market share, driven by strong demand from the automotive and electronics sectors, and robust technological innovation within the region. However, the Asia-Pacific region exhibits the highest growth potential, fueled by rapid industrialization and rising investments in automation across countries like China and India.
By Component:
- Cameras: Holds the largest segment share due to technological advancements and the increasing demand for high-resolution imaging.
- Lighting Equipment: Steady growth driven by the need for optimized illumination for various applications.
- Optics: Steady growth and importance due to the increased demand for high quality lenses and optical systems.
- Other Components: Steady growth fueled by technological innovation in other components, but smaller in market share in comparison to other components.
By Application:
- Automotive: The dominant application segment due to stringent quality control requirements and the increasing complexity of automotive components. Key drivers include automation investment and stricter regulatory compliance.
- Electrical & Electronics: Strong growth fueled by the need for efficient and accurate inspection in electronics manufacturing.
- Medical & Pharmaceuticals: Growth is driven by the strict regulatory environment and high quality requirements in the sector.
- Food & Beverages: Increasing adoption driven by concerns over food safety and quality control.
- Postal & Logistics: Steady growth driven by increasing demand for efficient sorting and package handling.
Key Drivers: High levels of automation investments, stringent regulatory compliance standards, and continuous advancements in technology.
Surface Vision & Inspection Equipment Industry Product Innovations
The Surface Vision & Inspection Equipment industry is witnessing rapid advancements in product development, focusing on enhancing detection capabilities, automation, and data analysis. Key recent innovations include the introduction of multi-spectral imaging systems, which significantly improve the accuracy and range of defect detection by analyzing materials across various light wavelengths. Furthermore, the deployment of AI-powered software is revolutionizing automated defect classification, enabling systems to identify, categorize, and flag anomalies with unprecedented speed and precision. The development of compact, high-resolution cameras is also a notable trend, facilitating seamless integration into increasingly smaller and more confined production lines. These groundbreaking advancements not only boost operational speed and accuracy but also introduce unique value propositions such as real-time defect analysis and predictive maintenance capabilities, allowing manufacturers to proactively address potential issues and minimize downtime.
Propelling Factors for Surface Vision & Inspection Equipment Growth
Technological advancements, particularly in AI and machine learning, are key growth drivers, enabling more sophisticated and efficient inspection processes. Growing automation across various industries necessitates the adoption of automated inspection systems, increasing market demand. Stringent quality control requirements across sectors, especially in regulated industries like pharmaceuticals, drive adoption. Economic factors, such as increasing labor costs, further propel the shift towards automation.
Obstacles in the Surface Vision & Inspection Equipment Industry Market
Despite its growth, the Surface Vision & Inspection Equipment industry faces several significant challenges. A primary hurdle is the substantial initial investment required for sophisticated, state-of-the-art systems, which can be a deterrent for small and medium-sized enterprises (SMEs) looking to adopt these technologies. The global supply chain, while recovering, remains susceptible to disruptions, which can affect the availability of critical components and consequently lead to production delays, impacting the overall market expansion. The competitive landscape is intense, with a constant influx of new entrants alongside established players, creating significant pressure on pricing strategies and profit margins. Moreover, evolving regulatory frameworks and the need to adhere to increasingly stringent compliance requirements across different industries can elevate operational costs and add layers of complexity to system implementation and maintenance.
Future Opportunities in Surface Vision & Inspection Equipment Industry
The integration of advanced analytics and cloud-based platforms for remote monitoring and data analysis offers significant opportunities. Expansion into emerging markets with increasing industrialization presents substantial growth potential. The development of specialized solutions tailored to specific industry needs, such as 3D imaging for complex geometries, can open new avenues.
Major Players in the Surface Vision & Inspection Equipment Industry Ecosystem
The Surface Vision & Inspection Equipment industry is supported by a robust ecosystem of leading companies, innovators, and solution providers. These organizations are at the forefront of developing and deploying advanced vision and inspection technologies across a wide array of applications.
- Matrox Imaging Ltd
- Keyence Corporation
- Shenzhen Sipotek Technology Co Ltd
- Isra Vision AG
- Cognex Corporation
- Stemmer Imaging AG
- AMETEK Surface Vision
- Omron Corporation
- Comvis AG
- Daitron Inc
- Flexfilm Ltd
- Edmund Scientific Corporation
- Panasonic Corporation
Key Developments in Surface Vision & Inspection Equipment Industry Industry
The Surface Vision & Inspection Equipment industry continues to experience significant advancements and strategic moves by key players, reflecting the sector's rapid innovation and market expansion.
- 2023-Q3: Cognex Corporation unveiled a groundbreaking new high-speed 3D vision system, significantly enhancing its offerings for complex industrial inspection tasks.
- 2022-Q4: Keyence Corporation announced a strategic partnership with a leading global automotive manufacturer, underscoring the growing importance of advanced vision solutions in the automotive sector.
- 2021-Q2: Matrox Imaging Ltd released an updated software suite featuring enhanced AI capabilities, providing users with more powerful tools for image analysis and defect detection.
- (Further comprehensive developments and market insights will be detailed in the full industry report)
Strategic Surface Vision & Inspection Equipment Industry Market Forecast
The Surface Vision & Inspection Equipment market is poised for robust growth, driven by continued technological advancements, increasing automation across industries, and stringent quality control standards. Emerging opportunities in new markets and application segments, coupled with innovative product development, promise significant market expansion. The market is expected to experience healthy growth throughout the forecast period, surpassing $XX Million by 2033.
Surface Vision & Inspection Equipment Industry Segmentation
-
1. Component
- 1.1. Camera
- 1.2. Lighting Equipment
- 1.3. Optics
- 1.4. Other Components
-
2. Application
- 2.1. Automotive
- 2.2. Electrical & Electronics
- 2.3. Medical & Pharmaceuticals
- 2.4. Food & Beverages
- 2.5. Postal & Logistics
- 2.6. Other Applications
Surface Vision & Inspection Equipment Industry Segmentation By Geography
- 1. North America
- 2. Europe
- 3. Asia Pacific
- 4. Rest of the World

Surface Vision & Inspection Equipment Industry Regional Market Share
Geographic Coverage of Surface Vision & Inspection Equipment Industry
Surface Vision & Inspection Equipment Industry REPORT HIGHLIGHTS
| Aspects | Details |
|---|---|
| Study Period | 2020-2034 |
| Base Year | 2025 |
| Estimated Year | 2026 |
| Forecast Period | 2026-2034 |
| Historical Period | 2020-2025 |
| Growth Rate | CAGR of 14.56% from 2020-2034 |
| Segmentation |
|
Table of Contents
- 1. Introduction
- 1.1. Research Scope
- 1.2. Market Segmentation
- 1.3. Research Objective
- 1.4. Definitions and Assumptions
- 2. Executive Summary
- 2.1. Market Snapshot
- 3. Market Dynamics
- 3.1. Market Drivers
- 3.2. Market Restrains
- 3.3. Market Trends
- 3.4. Market Opportunities
- 4. Market Factor Analysis
- 4.1. Porters Five Forces
- 4.1.1. Bargaining Power of Suppliers
- 4.1.2. Bargaining Power of Buyers
- 4.1.3. Threat of New Entrants
- 4.1.4. Threat of Substitutes
- 4.1.5. Competitive Rivalry
- 4.2. PESTEL analysis
- 4.3. BCG Analysis
- 4.3.1. Stars (High Growth, High Market Share)
- 4.3.2. Cash Cows (Low Growth, High Market Share)
- 4.3.3. Question Mark (High Growth, Low Market Share)
- 4.3.4. Dogs (Low Growth, Low Market Share)
- 4.4. Ansoff Matrix Analysis
- 4.5. Supply Chain Analysis
- 4.6. Regulatory Landscape
- 4.7. Current Market Potential and Opportunity Assessment (TAM–SAM–SOM Framework)
- 4.8. DMV Analyst Note
- 4.1. Porters Five Forces
- 5. Market Analysis, Insights and Forecast 2021-2033
- 5.1. Market Analysis, Insights and Forecast - by Component
- 5.1.1. Camera
- 5.1.2. Lighting Equipment
- 5.1.3. Optics
- 5.1.4. Other Components
- 5.2. Market Analysis, Insights and Forecast - by Application
- 5.2.1. Automotive
- 5.2.2. Electrical & Electronics
- 5.2.3. Medical & Pharmaceuticals
- 5.2.4. Food & Beverages
- 5.2.5. Postal & Logistics
- 5.2.6. Other Applications
- 5.3. Market Analysis, Insights and Forecast - by Region
- 5.3.1. North America
- 5.3.2. Europe
- 5.3.3. Asia Pacific
- 5.3.4. Rest of the World
- 5.1. Market Analysis, Insights and Forecast - by Component
- 6. Global Surface Vision & Inspection Equipment Industry Analysis, Insights and Forecast, 2021-2033
- 6.1. Market Analysis, Insights and Forecast - by Component
- 6.1.1. Camera
- 6.1.2. Lighting Equipment
- 6.1.3. Optics
- 6.1.4. Other Components
- 6.2. Market Analysis, Insights and Forecast - by Application
- 6.2.1. Automotive
- 6.2.2. Electrical & Electronics
- 6.2.3. Medical & Pharmaceuticals
- 6.2.4. Food & Beverages
- 6.2.5. Postal & Logistics
- 6.2.6. Other Applications
- 6.1. Market Analysis, Insights and Forecast - by Component
- 7. North America Surface Vision & Inspection Equipment Industry Analysis, Insights and Forecast, 2020-2032
- 7.1. Market Analysis, Insights and Forecast - by Component
- 7.1.1. Camera
- 7.1.2. Lighting Equipment
- 7.1.3. Optics
- 7.1.4. Other Components
- 7.2. Market Analysis, Insights and Forecast - by Application
- 7.2.1. Automotive
- 7.2.2. Electrical & Electronics
- 7.2.3. Medical & Pharmaceuticals
- 7.2.4. Food & Beverages
- 7.2.5. Postal & Logistics
- 7.2.6. Other Applications
- 7.1. Market Analysis, Insights and Forecast - by Component
- 8. Europe Surface Vision & Inspection Equipment Industry Analysis, Insights and Forecast, 2020-2032
- 8.1. Market Analysis, Insights and Forecast - by Component
- 8.1.1. Camera
- 8.1.2. Lighting Equipment
- 8.1.3. Optics
- 8.1.4. Other Components
- 8.2. Market Analysis, Insights and Forecast - by Application
- 8.2.1. Automotive
- 8.2.2. Electrical & Electronics
- 8.2.3. Medical & Pharmaceuticals
- 8.2.4. Food & Beverages
- 8.2.5. Postal & Logistics
- 8.2.6. Other Applications
- 8.1. Market Analysis, Insights and Forecast - by Component
- 9. Asia Pacific Surface Vision & Inspection Equipment Industry Analysis, Insights and Forecast, 2020-2032
- 9.1. Market Analysis, Insights and Forecast - by Component
- 9.1.1. Camera
- 9.1.2. Lighting Equipment
- 9.1.3. Optics
- 9.1.4. Other Components
- 9.2. Market Analysis, Insights and Forecast - by Application
- 9.2.1. Automotive
- 9.2.2. Electrical & Electronics
- 9.2.3. Medical & Pharmaceuticals
- 9.2.4. Food & Beverages
- 9.2.5. Postal & Logistics
- 9.2.6. Other Applications
- 9.1. Market Analysis, Insights and Forecast - by Component
- 10. Rest of the World Surface Vision & Inspection Equipment Industry Analysis, Insights and Forecast, 2020-2032
- 10.1. Market Analysis, Insights and Forecast - by Component
- 10.1.1. Camera
- 10.1.2. Lighting Equipment
- 10.1.3. Optics
- 10.1.4. Other Components
- 10.2. Market Analysis, Insights and Forecast - by Application
- 10.2.1. Automotive
- 10.2.2. Electrical & Electronics
- 10.2.3. Medical & Pharmaceuticals
- 10.2.4. Food & Beverages
- 10.2.5. Postal & Logistics
- 10.2.6. Other Applications
- 10.1. Market Analysis, Insights and Forecast - by Component
- 11. Competitive Analysis
- 11.1. Company Profiles
- 11.1.1 Matrox Imaging Ltd
- 11.1.1.1. Company Overview
- 11.1.1.2. Products
- 11.1.1.3. Company Financials
- 11.1.1.4. SWOT Analysis
- 11.1.2 Keyence Corporation
- 11.1.2.1. Company Overview
- 11.1.2.2. Products
- 11.1.2.3. Company Financials
- 11.1.2.4. SWOT Analysis
- 11.1.3 Shenzhen Sipotek Technology Co Ltd
- 11.1.3.1. Company Overview
- 11.1.3.2. Products
- 11.1.3.3. Company Financials
- 11.1.3.4. SWOT Analysis
- 11.1.4 Isra Vision AG
- 11.1.4.1. Company Overview
- 11.1.4.2. Products
- 11.1.4.3. Company Financials
- 11.1.4.4. SWOT Analysis
- 11.1.5 Cognex Corporation
- 11.1.5.1. Company Overview
- 11.1.5.2. Products
- 11.1.5.3. Company Financials
- 11.1.5.4. SWOT Analysis
- 11.1.6 Stemmer Imaging AG
- 11.1.6.1. Company Overview
- 11.1.6.2. Products
- 11.1.6.3. Company Financials
- 11.1.6.4. SWOT Analysis
- 11.1.7 AMETEK Surface Vision
- 11.1.7.1. Company Overview
- 11.1.7.2. Products
- 11.1.7.3. Company Financials
- 11.1.7.4. SWOT Analysis
- 11.1.8 Omron Corporation
- 11.1.8.1. Company Overview
- 11.1.8.2. Products
- 11.1.8.3. Company Financials
- 11.1.8.4. SWOT Analysis
- 11.1.9 Comvis AG*List Not Exhaustive
- 11.1.9.1. Company Overview
- 11.1.9.2. Products
- 11.1.9.3. Company Financials
- 11.1.9.4. SWOT Analysis
- 11.1.10 Daitron Inc
- 11.1.10.1. Company Overview
- 11.1.10.2. Products
- 11.1.10.3. Company Financials
- 11.1.10.4. SWOT Analysis
- 11.1.11 Flexfilm Ltd
- 11.1.11.1. Company Overview
- 11.1.11.2. Products
- 11.1.11.3. Company Financials
- 11.1.11.4. SWOT Analysis
- 11.1.12 Edmund Scientific Corporation
- 11.1.12.1. Company Overview
- 11.1.12.2. Products
- 11.1.12.3. Company Financials
- 11.1.12.4. SWOT Analysis
- 11.1.13 Panasonic Corporation
- 11.1.13.1. Company Overview
- 11.1.13.2. Products
- 11.1.13.3. Company Financials
- 11.1.13.4. SWOT Analysis
- 11.1.1 Matrox Imaging Ltd
- 11.2. Market Entropy
- 11.2.1 Company's Key Areas Served
- 11.2.2 Recent Developments
- 11.3. Company Market Share Analysis 2025
- 11.3.1 Top 5 Companies Market Share Analysis
- 11.3.2 Top 3 Companies Market Share Analysis
- 11.4. List of Potential Customers
- 12. Research Methodology
List of Figures
- Figure 1: Global Surface Vision & Inspection Equipment Industry Revenue Breakdown (billion, %) by Region 2025 & 2033
- Figure 2: North America Surface Vision & Inspection Equipment Industry Revenue (billion), by Component 2025 & 2033
- Figure 3: North America Surface Vision & Inspection Equipment Industry Revenue Share (%), by Component 2025 & 2033
- Figure 4: North America Surface Vision & Inspection Equipment Industry Revenue (billion), by Application 2025 & 2033
- Figure 5: North America Surface Vision & Inspection Equipment Industry Revenue Share (%), by Application 2025 & 2033
- Figure 6: North America Surface Vision & Inspection Equipment Industry Revenue (billion), by Country 2025 & 2033
- Figure 7: North America Surface Vision & Inspection Equipment Industry Revenue Share (%), by Country 2025 & 2033
- Figure 8: Europe Surface Vision & Inspection Equipment Industry Revenue (billion), by Component 2025 & 2033
- Figure 9: Europe Surface Vision & Inspection Equipment Industry Revenue Share (%), by Component 2025 & 2033
- Figure 10: Europe Surface Vision & Inspection Equipment Industry Revenue (billion), by Application 2025 & 2033
- Figure 11: Europe Surface Vision & Inspection Equipment Industry Revenue Share (%), by Application 2025 & 2033
- Figure 12: Europe Surface Vision & Inspection Equipment Industry Revenue (billion), by Country 2025 & 2033
- Figure 13: Europe Surface Vision & Inspection Equipment Industry Revenue Share (%), by Country 2025 & 2033
- Figure 14: Asia Pacific Surface Vision & Inspection Equipment Industry Revenue (billion), by Component 2025 & 2033
- Figure 15: Asia Pacific Surface Vision & Inspection Equipment Industry Revenue Share (%), by Component 2025 & 2033
- Figure 16: Asia Pacific Surface Vision & Inspection Equipment Industry Revenue (billion), by Application 2025 & 2033
- Figure 17: Asia Pacific Surface Vision & Inspection Equipment Industry Revenue Share (%), by Application 2025 & 2033
- Figure 18: Asia Pacific Surface Vision & Inspection Equipment Industry Revenue (billion), by Country 2025 & 2033
- Figure 19: Asia Pacific Surface Vision & Inspection Equipment Industry Revenue Share (%), by Country 2025 & 2033
- Figure 20: Rest of the World Surface Vision & Inspection Equipment Industry Revenue (billion), by Component 2025 & 2033
- Figure 21: Rest of the World Surface Vision & Inspection Equipment Industry Revenue Share (%), by Component 2025 & 2033
- Figure 22: Rest of the World Surface Vision & Inspection Equipment Industry Revenue (billion), by Application 2025 & 2033
- Figure 23: Rest of the World Surface Vision & Inspection Equipment Industry Revenue Share (%), by Application 2025 & 2033
- Figure 24: Rest of the World Surface Vision & Inspection Equipment Industry Revenue (billion), by Country 2025 & 2033
- Figure 25: Rest of the World Surface Vision & Inspection Equipment Industry Revenue Share (%), by Country 2025 & 2033
List of Tables
- Table 1: Global Surface Vision & Inspection Equipment Industry Revenue billion Forecast, by Component 2020 & 2033
- Table 2: Global Surface Vision & Inspection Equipment Industry Revenue billion Forecast, by Application 2020 & 2033
- Table 3: Global Surface Vision & Inspection Equipment Industry Revenue billion Forecast, by Region 2020 & 2033
- Table 4: Global Surface Vision & Inspection Equipment Industry Revenue billion Forecast, by Component 2020 & 2033
- Table 5: Global Surface Vision & Inspection Equipment Industry Revenue billion Forecast, by Application 2020 & 2033
- Table 6: Global Surface Vision & Inspection Equipment Industry Revenue billion Forecast, by Country 2020 & 2033
- Table 7: Global Surface Vision & Inspection Equipment Industry Revenue billion Forecast, by Component 2020 & 2033
- Table 8: Global Surface Vision & Inspection Equipment Industry Revenue billion Forecast, by Application 2020 & 2033
- Table 9: Global Surface Vision & Inspection Equipment Industry Revenue billion Forecast, by Country 2020 & 2033
- Table 10: Global Surface Vision & Inspection Equipment Industry Revenue billion Forecast, by Component 2020 & 2033
- Table 11: Global Surface Vision & Inspection Equipment Industry Revenue billion Forecast, by Application 2020 & 2033
- Table 12: Global Surface Vision & Inspection Equipment Industry Revenue billion Forecast, by Country 2020 & 2033
- Table 13: Global Surface Vision & Inspection Equipment Industry Revenue billion Forecast, by Component 2020 & 2033
- Table 14: Global Surface Vision & Inspection Equipment Industry Revenue billion Forecast, by Application 2020 & 2033
- Table 15: Global Surface Vision & Inspection Equipment Industry Revenue billion Forecast, by Country 2020 & 2033
Frequently Asked Questions
1. What is the projected Compound Annual Growth Rate (CAGR) of the Surface Vision & Inspection Equipment Industry?
The projected CAGR is approximately 14.56%.
2. Which companies are prominent players in the Surface Vision & Inspection Equipment Industry?
Key companies in the market include Matrox Imaging Ltd, Keyence Corporation, Shenzhen Sipotek Technology Co Ltd, Isra Vision AG, Cognex Corporation, Stemmer Imaging AG, AMETEK Surface Vision, Omron Corporation, Comvis AG*List Not Exhaustive, Daitron Inc, Flexfilm Ltd, Edmund Scientific Corporation, Panasonic Corporation.
3. What are the main segments of the Surface Vision & Inspection Equipment Industry?
The market segments include Component, Application.
4. Can you provide details about the market size?
The market size is estimated to be USD 14.86 billion as of 2022.
5. What are some drivers contributing to market growth?
; Increasing Need for Better Manufacturing Production Capacity at Reduced Cost; Growing Demand for Qualitative Products; Increasing Adoption of Industrial 4.0 and IoT.
6. What are the notable trends driving market growth?
Camera Segment is expected to Hold the Largest Market Size during the Forecast Period.
7. Are there any restraints impacting market growth?
; Lack of Skilled Labor.
8. Can you provide examples of recent developments in the market?
N/A
9. What pricing options are available for accessing the report?
Pricing options include single-user, multi-user, and enterprise licenses priced at USD 4750, USD 5250, and USD 8750 respectively.
10. Is the market size provided in terms of value or volume?
The market size is provided in terms of value, measured in billion.
11. Are there any specific market keywords associated with the report?
Yes, the market keyword associated with the report is "Surface Vision & Inspection Equipment Industry," which aids in identifying and referencing the specific market segment covered.
12. How do I determine which pricing option suits my needs best?
The pricing options vary based on user requirements and access needs. Individual users may opt for single-user licenses, while businesses requiring broader access may choose multi-user or enterprise licenses for cost-effective access to the report.
13. Are there any additional resources or data provided in the Surface Vision & Inspection Equipment Industry report?
While the report offers comprehensive insights, it's advisable to review the specific contents or supplementary materials provided to ascertain if additional resources or data are available.
14. How can I stay updated on further developments or reports in the Surface Vision & Inspection Equipment Industry?
To stay informed about further developments, trends, and reports in the Surface Vision & Inspection Equipment Industry, consider subscribing to industry newsletters, following relevant companies and organizations, or regularly checking reputable industry news sources and publications.
Methodology
Step 1 - Identification of Relevant Samples Size from Population Database


Step 2 - Approaches for Defining Global Market Size (Value, Volume* & Price*)

Note*: In applicable scenarios
Step 3 - Data Sources
Primary Research
- Web Analytics
- Survey Reports
- Research Institute
- Latest Research Reports
- Opinion Leaders
Secondary Research
- Annual Reports
- White Paper
- Latest Press Release
- Industry Association
- Paid Database
- Investor Presentations

Step 4 - Data Triangulation
Involves using different sources of information in order to increase the validity of a study
These sources are likely to be stakeholders in a program - participants, other researchers, program staff, other community members, and so on.
Then we put all data in single framework & apply various statistical tools to find out the dynamic on the market.
During the analysis stage, feedback from the stakeholder groups would be compared to determine areas of agreement as well as areas of divergence