

Key Insights
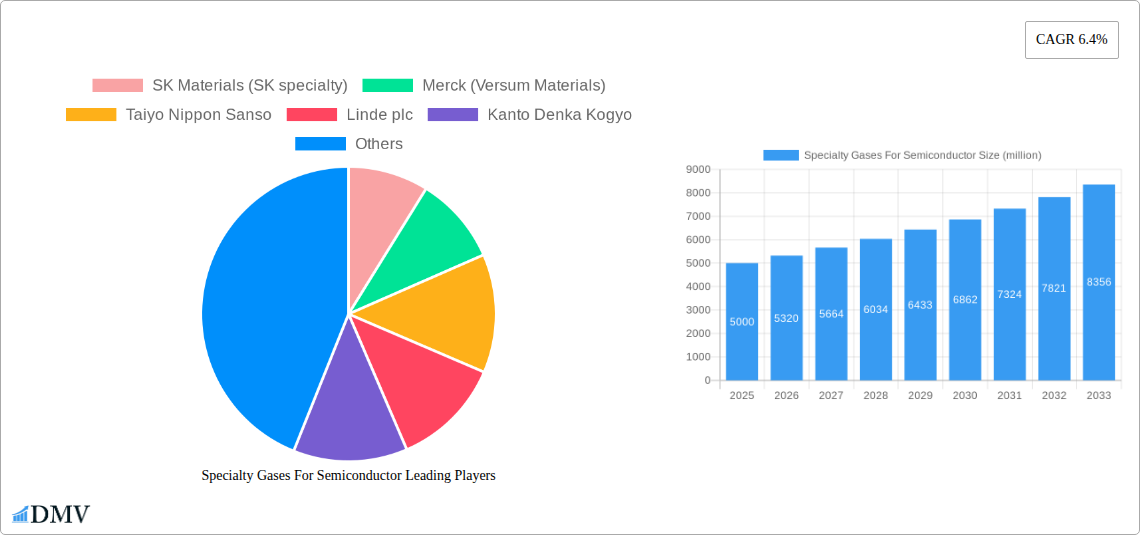
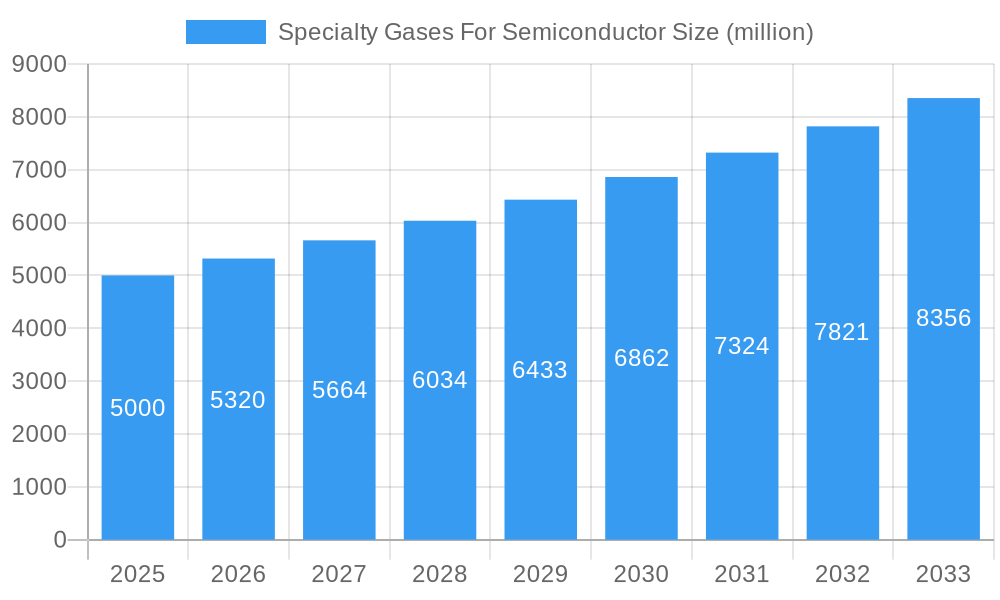
The specialty gases for semiconductor market, valued at approximately $5 billion in 2025, is projected to experience robust growth, driven by the burgeoning semiconductor industry and the increasing demand for advanced semiconductor devices. A compound annual growth rate (CAGR) of 6.4% from 2025 to 2033 indicates a significant expansion in market size, reaching an estimated $8 billion by 2033. This growth is fueled by several key factors, including the rising adoption of advanced semiconductor manufacturing processes like extreme ultraviolet lithography (EUV) which requires highly specialized and pure gases, the increasing demand for high-performance computing (HPC), and the proliferation of 5G and IoT devices. Furthermore, ongoing research and development in semiconductor technology necessitate the continuous development and adoption of new specialty gases with enhanced purity and performance characteristics. Key players like SK Materials, Merck (Versum Materials), and Linde plc are actively investing in research, capacity expansion, and strategic partnerships to capitalize on this expanding market.
Specialty Gases For Semiconductor Market Size (In Billion)
However, the market also faces certain restraints. Fluctuations in raw material prices, stringent regulatory requirements concerning gas handling and emissions, and the cyclical nature of the semiconductor industry can impact market growth. Nevertheless, the long-term outlook remains positive, driven by the continuous miniaturization of semiconductor components and the expanding applications of semiconductors across various industries. The market is segmented based on gas type (e.g., silane, nitrogen, argon), application (e.g., etching, deposition), and region. Regional variations in growth will be influenced by factors such as government policies supporting semiconductor manufacturing and the concentration of semiconductor fabrication plants. The competitive landscape is characterized by a mix of large multinational corporations and specialized regional players, all vying for market share through technological innovation, strategic acquisitions, and cost optimization strategies.
Specialty Gases For Semiconductor Company Market Share
Specialty Gases for Semiconductor: A Comprehensive Market Report (2019-2033)
This insightful report provides a detailed analysis of the specialty gases for semiconductor market, offering invaluable insights for stakeholders seeking to navigate this dynamic landscape. The study period spans 2019-2033, with a base year of 2025 and a forecast period of 2025-2033. We delve into market composition, technological advancements, key players, and future growth potential, incorporating comprehensive data and analysis to provide a clear picture of this multi-million-dollar industry.
Specialty Gases For Semiconductor Market Composition & Trends
This section evaluates the competitive landscape, innovative drivers, regulatory frameworks, substitute products, and end-user profiles within the specialty gases for semiconductor market. The report analyzes market concentration, revealing a consolidated market with several major players commanding significant shares. For example, the top five companies held an estimated xx% market share in 2025. We examine the impact of mergers and acquisitions (M&A) activities, detailing xx million dollars worth of deals in the period 2019-2024, impacting market consolidation and technological innovation.
- Market Share Distribution: A detailed breakdown of market share among key players, including SK Materials, Merck (Versum Materials), Linde plc, and others.
- M&A Activities: Analysis of significant mergers and acquisitions, including deal values and their impact on market structure.
- Innovation Catalysts: Examination of factors driving innovation, such as the pursuit of higher purity gases and advanced process technologies.
- Regulatory Landscape: Assessment of government regulations impacting the production and use of specialty gases.
- Substitute Products: Evaluation of alternative materials and technologies that may compete with specialty gases.
- End-User Profiles: Profiling of major end-users in the semiconductor industry, highlighting their specific needs and preferences.
Specialty Gases For Semiconductor Industry Evolution
This section analyzes the historical and projected growth trajectories of the specialty gases for semiconductor market. The market experienced a Compound Annual Growth Rate (CAGR) of xx% during the historical period (2019-2024), driven by factors such as the increasing demand for advanced semiconductor devices and the expansion of the global electronics industry. We project a CAGR of xx% during the forecast period (2025-2033), with the market value exceeding xx million by 2033. Technological advancements, particularly in the development of novel gas delivery systems and purification techniques, are further boosting market growth. The evolving consumer demand for smaller, faster, and more energy-efficient electronic devices is a key driver.
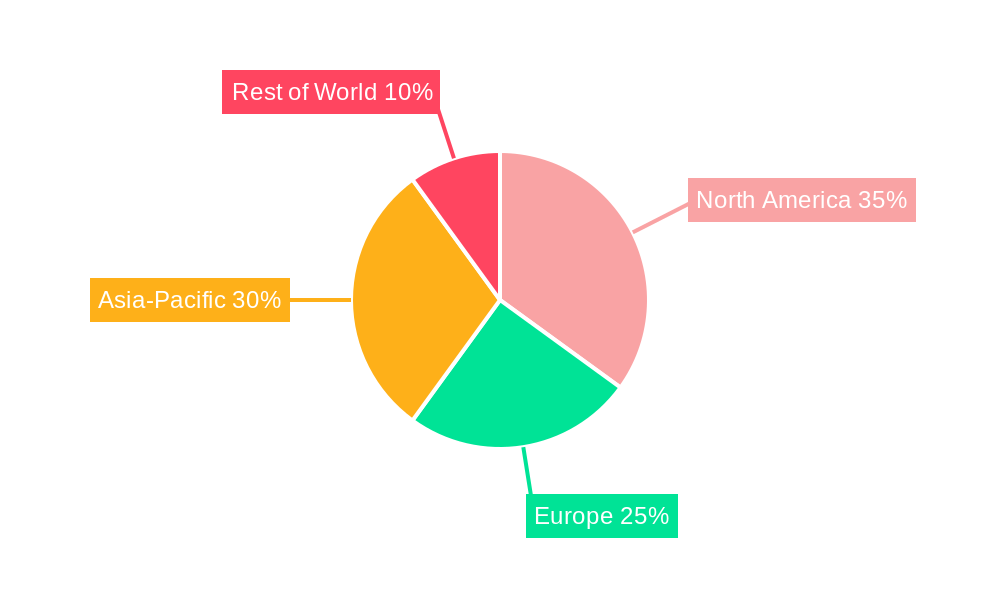
Leading Regions, Countries, or Segments in Specialty Gases For Semiconductor
The report identifies the dominant regions and countries within the specialty gases for semiconductor market. Asia, particularly regions like Taiwan, South Korea, and China, currently holds the largest market share. This dominance is attributed to several key factors:
- High Concentration of Semiconductor Manufacturing: The presence of leading semiconductor manufacturers creates a significant demand for specialty gases.
- Government Investment & Support: Government initiatives and subsidies for semiconductor manufacturing infrastructure fuel industry growth.
- Technological Advancements: Strong R&D capabilities and a focus on technological innovation contribute to industry leadership.
This section provides an in-depth analysis of these dominance factors, along with projections for the future distribution of market share across different regions.
Specialty Gases For Semiconductor Product Innovations
Recent years have witnessed significant innovation in specialty gases for semiconductors. Companies are focusing on developing higher-purity gases with improved performance characteristics to meet the demands of advanced semiconductor fabrication processes. Innovations include advanced purification techniques, specialized gas delivery systems, and the development of novel gas mixtures optimized for specific applications. These innovations lead to enhanced process yields, improved device performance, and reduced manufacturing costs, further propelling market growth.
Propelling Factors for Specialty Gases For Semiconductor Growth
The specialty gases for semiconductor market is driven by several key factors. The increasing demand for advanced semiconductor devices, fueled by the growth of the electronics industry, is a major catalyst. Technological advancements, including the development of more complex and efficient semiconductor manufacturing processes, further boost demand. Government initiatives and investments aimed at fostering technological innovation and supporting the semiconductor industry also contribute significantly. Furthermore, the rising adoption of 5G technology and the growth of the automotive electronics sector are creating substantial opportunities for market expansion.
Obstacles in the Specialty Gases For Semiconductor Market
Despite the positive growth outlook, the specialty gases for semiconductor market faces several challenges. Fluctuations in raw material prices can impact production costs and profitability. Supply chain disruptions can also lead to shortages and delays in gas delivery. Intense competition among established players and the emergence of new entrants can put pressure on profit margins. Strict regulatory requirements and environmental concerns related to the production and handling of specialty gases also present obstacles to market growth. These factors could cumulatively impact the market by xx million dollars annually.
Future Opportunities in Specialty Gases For Semiconductor
The future of the specialty gases for semiconductor market holds significant opportunities. The increasing demand for advanced semiconductor devices in various applications, such as artificial intelligence, IoT, and high-performance computing, will fuel market growth. The development of new materials and manufacturing processes will create new demands for specialized gases. Expansion into emerging markets and the development of sustainable and environmentally friendly production methods will offer further growth potential.
Major Players in the Specialty Gases For Semiconductor Ecosystem
- SK Materials (SK specialty)
- Merck (Versum Materials)
- Taiyo Nippon Sanso
- Linde plc
- Kanto Denka Kogyo
- Hyosung
- PERIC
- Showa Denko
- Mitsui Chemical
- ChemChina
- Shandong FeiYuan
- Guangdong Huate Gas
- Central Glass
Key Developments in Specialty Gases For Semiconductor Industry
- January 2023: Linde plc announces a major investment in a new specialty gas production facility.
- March 2022: Merck (Versum Materials) launches a new line of high-purity gases for advanced semiconductor manufacturing.
- June 2021: A significant merger between two specialty gas companies reshapes the market landscape.
- (Add more entries as available)
Strategic Specialty Gases For Semiconductor Market Forecast
The specialty gases for semiconductor market is poised for robust growth over the forecast period, driven by the increasing demand for advanced semiconductor technologies and the expansion of the global electronics industry. The market is expected to reach xx million by 2033, representing a significant expansion from its current size. Emerging applications, such as AI, IoT, and 5G, coupled with technological advancements in semiconductor manufacturing, will continue to propel this growth. Strategic collaborations, R&D investments, and capacity expansions by key players will further fuel market expansion during this period.
Specialty Gases For Semiconductor Segmentation
-
1. Application
- 1.1. Consumer Electronics
- 1.2. Automotive Electronics
- 1.3. Networking & Communications
- 1.4. Others
-
2. Type
- 2.1. Nitrogen Trifluoride
- 2.2. Silicon-Precursor Gases
- 2.3. Fluoroalkane
- 2.4. Ammonia
- 2.5. Others
Specialty Gases For Semiconductor Segmentation By Geography
-
1. North America
- 1.1. United States
- 1.2. Canada
- 1.3. Mexico
-
2. South America
- 2.1. Brazil
- 2.2. Argentina
- 2.3. Rest of South America
-
3. Europe
- 3.1. United Kingdom
- 3.2. Germany
- 3.3. France
- 3.4. Italy
- 3.5. Spain
- 3.6. Russia
- 3.7. Benelux
- 3.8. Nordics
- 3.9. Rest of Europe
-
4. Middle East & Africa
- 4.1. Turkey
- 4.2. Israel
- 4.3. GCC
- 4.4. North Africa
- 4.5. South Africa
- 4.6. Rest of Middle East & Africa
-
5. Asia Pacific
- 5.1. China
- 5.2. India
- 5.3. Japan
- 5.4. South Korea
- 5.5. ASEAN
- 5.6. Oceania
- 5.7. Rest of Asia Pacific
Specialty Gases For Semiconductor Regional Market Share
Geographic Coverage of Specialty Gases For Semiconductor
Specialty Gases For Semiconductor REPORT HIGHLIGHTS
| Aspects | Details |
|---|---|
| Study Period | 2020-2034 |
| Base Year | 2025 |
| Estimated Year | 2026 |
| Forecast Period | 2026-2034 |
| Historical Period | 2020-2025 |
| Growth Rate | CAGR of 6.4% from 2020-2034 |
| Segmentation |
|
Table of Contents
- 1. Introduction
- 1.1. Research Scope
- 1.2. Market Segmentation
- 1.3. Research Objective
- 1.4. Definitions and Assumptions
- 2. Executive Summary
- 2.1. Market Snapshot
- 3. Market Dynamics
- 3.1. Market Drivers
- 3.2. Market Restrains
- 3.3. Market Trends
- 3.4. Market Opportunities
- 4. Market Factor Analysis
- 4.1. Porters Five Forces
- 4.1.1. Bargaining Power of Suppliers
- 4.1.2. Bargaining Power of Buyers
- 4.1.3. Threat of New Entrants
- 4.1.4. Threat of Substitutes
- 4.1.5. Competitive Rivalry
- 4.2. PESTEL analysis
- 4.3. BCG Analysis
- 4.3.1. Stars (High Growth, High Market Share)
- 4.3.2. Cash Cows (Low Growth, High Market Share)
- 4.3.3. Question Mark (High Growth, Low Market Share)
- 4.3.4. Dogs (Low Growth, Low Market Share)
- 4.4. Ansoff Matrix Analysis
- 4.5. Supply Chain Analysis
- 4.6. Regulatory Landscape
- 4.7. Current Market Potential and Opportunity Assessment (TAM–SAM–SOM Framework)
- 4.8. DMV Analyst Note
- 4.1. Porters Five Forces
- 5. Market Analysis, Insights and Forecast 2021-2033
- 5.1. Market Analysis, Insights and Forecast - by Application
- 5.1.1. Consumer Electronics
- 5.1.2. Automotive Electronics
- 5.1.3. Networking & Communications
- 5.1.4. Others
- 5.2. Market Analysis, Insights and Forecast - by Type
- 5.2.1. Nitrogen Trifluoride
- 5.2.2. Silicon-Precursor Gases
- 5.2.3. Fluoroalkane
- 5.2.4. Ammonia
- 5.2.5. Others
- 5.3. Market Analysis, Insights and Forecast - by Region
- 5.3.1. North America
- 5.3.2. South America
- 5.3.3. Europe
- 5.3.4. Middle East & Africa
- 5.3.5. Asia Pacific
- 5.1. Market Analysis, Insights and Forecast - by Application
- 6. Global Specialty Gases For Semiconductor Analysis, Insights and Forecast, 2021-2033
- 6.1. Market Analysis, Insights and Forecast - by Application
- 6.1.1. Consumer Electronics
- 6.1.2. Automotive Electronics
- 6.1.3. Networking & Communications
- 6.1.4. Others
- 6.2. Market Analysis, Insights and Forecast - by Type
- 6.2.1. Nitrogen Trifluoride
- 6.2.2. Silicon-Precursor Gases
- 6.2.3. Fluoroalkane
- 6.2.4. Ammonia
- 6.2.5. Others
- 6.1. Market Analysis, Insights and Forecast - by Application
- 7. North America Specialty Gases For Semiconductor Analysis, Insights and Forecast, 2020-2032
- 7.1. Market Analysis, Insights and Forecast - by Application
- 7.1.1. Consumer Electronics
- 7.1.2. Automotive Electronics
- 7.1.3. Networking & Communications
- 7.1.4. Others
- 7.2. Market Analysis, Insights and Forecast - by Type
- 7.2.1. Nitrogen Trifluoride
- 7.2.2. Silicon-Precursor Gases
- 7.2.3. Fluoroalkane
- 7.2.4. Ammonia
- 7.2.5. Others
- 7.1. Market Analysis, Insights and Forecast - by Application
- 8. South America Specialty Gases For Semiconductor Analysis, Insights and Forecast, 2020-2032
- 8.1. Market Analysis, Insights and Forecast - by Application
- 8.1.1. Consumer Electronics
- 8.1.2. Automotive Electronics
- 8.1.3. Networking & Communications
- 8.1.4. Others
- 8.2. Market Analysis, Insights and Forecast - by Type
- 8.2.1. Nitrogen Trifluoride
- 8.2.2. Silicon-Precursor Gases
- 8.2.3. Fluoroalkane
- 8.2.4. Ammonia
- 8.2.5. Others
- 8.1. Market Analysis, Insights and Forecast - by Application
- 9. Europe Specialty Gases For Semiconductor Analysis, Insights and Forecast, 2020-2032
- 9.1. Market Analysis, Insights and Forecast - by Application
- 9.1.1. Consumer Electronics
- 9.1.2. Automotive Electronics
- 9.1.3. Networking & Communications
- 9.1.4. Others
- 9.2. Market Analysis, Insights and Forecast - by Type
- 9.2.1. Nitrogen Trifluoride
- 9.2.2. Silicon-Precursor Gases
- 9.2.3. Fluoroalkane
- 9.2.4. Ammonia
- 9.2.5. Others
- 9.1. Market Analysis, Insights and Forecast - by Application
- 10. Middle East & Africa Specialty Gases For Semiconductor Analysis, Insights and Forecast, 2020-2032
- 10.1. Market Analysis, Insights and Forecast - by Application
- 10.1.1. Consumer Electronics
- 10.1.2. Automotive Electronics
- 10.1.3. Networking & Communications
- 10.1.4. Others
- 10.2. Market Analysis, Insights and Forecast - by Type
- 10.2.1. Nitrogen Trifluoride
- 10.2.2. Silicon-Precursor Gases
- 10.2.3. Fluoroalkane
- 10.2.4. Ammonia
- 10.2.5. Others
- 10.1. Market Analysis, Insights and Forecast - by Application
- 11. Asia Pacific Specialty Gases For Semiconductor Analysis, Insights and Forecast, 2020-2032
- 11.1. Market Analysis, Insights and Forecast - by Application
- 11.1.1. Consumer Electronics
- 11.1.2. Automotive Electronics
- 11.1.3. Networking & Communications
- 11.1.4. Others
- 11.2. Market Analysis, Insights and Forecast - by Type
- 11.2.1. Nitrogen Trifluoride
- 11.2.2. Silicon-Precursor Gases
- 11.2.3. Fluoroalkane
- 11.2.4. Ammonia
- 11.2.5. Others
- 11.1. Market Analysis, Insights and Forecast - by Application
- 12. Competitive Analysis
- 12.1. Company Profiles
- 12.1.1 SK Materials (SK specialty)
- 12.1.1.1. Company Overview
- 12.1.1.2. Products
- 12.1.1.3. Company Financials
- 12.1.1.4. SWOT Analysis
- 12.1.2 Merck (Versum Materials)
- 12.1.2.1. Company Overview
- 12.1.2.2. Products
- 12.1.2.3. Company Financials
- 12.1.2.4. SWOT Analysis
- 12.1.3 Taiyo Nippon Sanso
- 12.1.3.1. Company Overview
- 12.1.3.2. Products
- 12.1.3.3. Company Financials
- 12.1.3.4. SWOT Analysis
- 12.1.4 Linde plc
- 12.1.4.1. Company Overview
- 12.1.4.2. Products
- 12.1.4.3. Company Financials
- 12.1.4.4. SWOT Analysis
- 12.1.5 Kanto Denka Kogyo
- 12.1.5.1. Company Overview
- 12.1.5.2. Products
- 12.1.5.3. Company Financials
- 12.1.5.4. SWOT Analysis
- 12.1.6 Hyosung
- 12.1.6.1. Company Overview
- 12.1.6.2. Products
- 12.1.6.3. Company Financials
- 12.1.6.4. SWOT Analysis
- 12.1.7 PERIC
- 12.1.7.1. Company Overview
- 12.1.7.2. Products
- 12.1.7.3. Company Financials
- 12.1.7.4. SWOT Analysis
- 12.1.8 Showa Denko
- 12.1.8.1. Company Overview
- 12.1.8.2. Products
- 12.1.8.3. Company Financials
- 12.1.8.4. SWOT Analysis
- 12.1.9 Mitsui Chemical
- 12.1.9.1. Company Overview
- 12.1.9.2. Products
- 12.1.9.3. Company Financials
- 12.1.9.4. SWOT Analysis
- 12.1.10 ChemChina
- 12.1.10.1. Company Overview
- 12.1.10.2. Products
- 12.1.10.3. Company Financials
- 12.1.10.4. SWOT Analysis
- 12.1.11 Shandong FeiYuan
- 12.1.11.1. Company Overview
- 12.1.11.2. Products
- 12.1.11.3. Company Financials
- 12.1.11.4. SWOT Analysis
- 12.1.12 Guangdong Huate Gas
- 12.1.12.1. Company Overview
- 12.1.12.2. Products
- 12.1.12.3. Company Financials
- 12.1.12.4. SWOT Analysis
- 12.1.13 Central Glass
- 12.1.13.1. Company Overview
- 12.1.13.2. Products
- 12.1.13.3. Company Financials
- 12.1.13.4. SWOT Analysis
- 12.1.1 SK Materials (SK specialty)
- 12.2. Market Entropy
- 12.2.1 Company's Key Areas Served
- 12.2.2 Recent Developments
- 12.3. Company Market Share Analysis 2025
- 12.3.1 Top 5 Companies Market Share Analysis
- 12.3.2 Top 3 Companies Market Share Analysis
- 12.4. List of Potential Customers
- 13. Research Methodology
List of Figures
- Figure 1: Global Specialty Gases For Semiconductor Revenue Breakdown (million, %) by Region 2025 & 2033
- Figure 2: Global Specialty Gases For Semiconductor Volume Breakdown (K, %) by Region 2025 & 2033
- Figure 3: North America Specialty Gases For Semiconductor Revenue (million), by Application 2025 & 2033
- Figure 4: North America Specialty Gases For Semiconductor Volume (K), by Application 2025 & 2033
- Figure 5: North America Specialty Gases For Semiconductor Revenue Share (%), by Application 2025 & 2033
- Figure 6: North America Specialty Gases For Semiconductor Volume Share (%), by Application 2025 & 2033
- Figure 7: North America Specialty Gases For Semiconductor Revenue (million), by Type 2025 & 2033
- Figure 8: North America Specialty Gases For Semiconductor Volume (K), by Type 2025 & 2033
- Figure 9: North America Specialty Gases For Semiconductor Revenue Share (%), by Type 2025 & 2033
- Figure 10: North America Specialty Gases For Semiconductor Volume Share (%), by Type 2025 & 2033
- Figure 11: North America Specialty Gases For Semiconductor Revenue (million), by Country 2025 & 2033
- Figure 12: North America Specialty Gases For Semiconductor Volume (K), by Country 2025 & 2033
- Figure 13: North America Specialty Gases For Semiconductor Revenue Share (%), by Country 2025 & 2033
- Figure 14: North America Specialty Gases For Semiconductor Volume Share (%), by Country 2025 & 2033
- Figure 15: South America Specialty Gases For Semiconductor Revenue (million), by Application 2025 & 2033
- Figure 16: South America Specialty Gases For Semiconductor Volume (K), by Application 2025 & 2033
- Figure 17: South America Specialty Gases For Semiconductor Revenue Share (%), by Application 2025 & 2033
- Figure 18: South America Specialty Gases For Semiconductor Volume Share (%), by Application 2025 & 2033
- Figure 19: South America Specialty Gases For Semiconductor Revenue (million), by Type 2025 & 2033
- Figure 20: South America Specialty Gases For Semiconductor Volume (K), by Type 2025 & 2033
- Figure 21: South America Specialty Gases For Semiconductor Revenue Share (%), by Type 2025 & 2033
- Figure 22: South America Specialty Gases For Semiconductor Volume Share (%), by Type 2025 & 2033
- Figure 23: South America Specialty Gases For Semiconductor Revenue (million), by Country 2025 & 2033
- Figure 24: South America Specialty Gases For Semiconductor Volume (K), by Country 2025 & 2033
- Figure 25: South America Specialty Gases For Semiconductor Revenue Share (%), by Country 2025 & 2033
- Figure 26: South America Specialty Gases For Semiconductor Volume Share (%), by Country 2025 & 2033
- Figure 27: Europe Specialty Gases For Semiconductor Revenue (million), by Application 2025 & 2033
- Figure 28: Europe Specialty Gases For Semiconductor Volume (K), by Application 2025 & 2033
- Figure 29: Europe Specialty Gases For Semiconductor Revenue Share (%), by Application 2025 & 2033
- Figure 30: Europe Specialty Gases For Semiconductor Volume Share (%), by Application 2025 & 2033
- Figure 31: Europe Specialty Gases For Semiconductor Revenue (million), by Type 2025 & 2033
- Figure 32: Europe Specialty Gases For Semiconductor Volume (K), by Type 2025 & 2033
- Figure 33: Europe Specialty Gases For Semiconductor Revenue Share (%), by Type 2025 & 2033
- Figure 34: Europe Specialty Gases For Semiconductor Volume Share (%), by Type 2025 & 2033
- Figure 35: Europe Specialty Gases For Semiconductor Revenue (million), by Country 2025 & 2033
- Figure 36: Europe Specialty Gases For Semiconductor Volume (K), by Country 2025 & 2033
- Figure 37: Europe Specialty Gases For Semiconductor Revenue Share (%), by Country 2025 & 2033
- Figure 38: Europe Specialty Gases For Semiconductor Volume Share (%), by Country 2025 & 2033
- Figure 39: Middle East & Africa Specialty Gases For Semiconductor Revenue (million), by Application 2025 & 2033
- Figure 40: Middle East & Africa Specialty Gases For Semiconductor Volume (K), by Application 2025 & 2033
- Figure 41: Middle East & Africa Specialty Gases For Semiconductor Revenue Share (%), by Application 2025 & 2033
- Figure 42: Middle East & Africa Specialty Gases For Semiconductor Volume Share (%), by Application 2025 & 2033
- Figure 43: Middle East & Africa Specialty Gases For Semiconductor Revenue (million), by Type 2025 & 2033
- Figure 44: Middle East & Africa Specialty Gases For Semiconductor Volume (K), by Type 2025 & 2033
- Figure 45: Middle East & Africa Specialty Gases For Semiconductor Revenue Share (%), by Type 2025 & 2033
- Figure 46: Middle East & Africa Specialty Gases For Semiconductor Volume Share (%), by Type 2025 & 2033
- Figure 47: Middle East & Africa Specialty Gases For Semiconductor Revenue (million), by Country 2025 & 2033
- Figure 48: Middle East & Africa Specialty Gases For Semiconductor Volume (K), by Country 2025 & 2033
- Figure 49: Middle East & Africa Specialty Gases For Semiconductor Revenue Share (%), by Country 2025 & 2033
- Figure 50: Middle East & Africa Specialty Gases For Semiconductor Volume Share (%), by Country 2025 & 2033
- Figure 51: Asia Pacific Specialty Gases For Semiconductor Revenue (million), by Application 2025 & 2033
- Figure 52: Asia Pacific Specialty Gases For Semiconductor Volume (K), by Application 2025 & 2033
- Figure 53: Asia Pacific Specialty Gases For Semiconductor Revenue Share (%), by Application 2025 & 2033
- Figure 54: Asia Pacific Specialty Gases For Semiconductor Volume Share (%), by Application 2025 & 2033
- Figure 55: Asia Pacific Specialty Gases For Semiconductor Revenue (million), by Type 2025 & 2033
- Figure 56: Asia Pacific Specialty Gases For Semiconductor Volume (K), by Type 2025 & 2033
- Figure 57: Asia Pacific Specialty Gases For Semiconductor Revenue Share (%), by Type 2025 & 2033
- Figure 58: Asia Pacific Specialty Gases For Semiconductor Volume Share (%), by Type 2025 & 2033
- Figure 59: Asia Pacific Specialty Gases For Semiconductor Revenue (million), by Country 2025 & 2033
- Figure 60: Asia Pacific Specialty Gases For Semiconductor Volume (K), by Country 2025 & 2033
- Figure 61: Asia Pacific Specialty Gases For Semiconductor Revenue Share (%), by Country 2025 & 2033
- Figure 62: Asia Pacific Specialty Gases For Semiconductor Volume Share (%), by Country 2025 & 2033
List of Tables
- Table 1: Global Specialty Gases For Semiconductor Revenue million Forecast, by Application 2020 & 2033
- Table 2: Global Specialty Gases For Semiconductor Volume K Forecast, by Application 2020 & 2033
- Table 3: Global Specialty Gases For Semiconductor Revenue million Forecast, by Type 2020 & 2033
- Table 4: Global Specialty Gases For Semiconductor Volume K Forecast, by Type 2020 & 2033
- Table 5: Global Specialty Gases For Semiconductor Revenue million Forecast, by Region 2020 & 2033
- Table 6: Global Specialty Gases For Semiconductor Volume K Forecast, by Region 2020 & 2033
- Table 7: Global Specialty Gases For Semiconductor Revenue million Forecast, by Application 2020 & 2033
- Table 8: Global Specialty Gases For Semiconductor Volume K Forecast, by Application 2020 & 2033
- Table 9: Global Specialty Gases For Semiconductor Revenue million Forecast, by Type 2020 & 2033
- Table 10: Global Specialty Gases For Semiconductor Volume K Forecast, by Type 2020 & 2033
- Table 11: Global Specialty Gases For Semiconductor Revenue million Forecast, by Country 2020 & 2033
- Table 12: Global Specialty Gases For Semiconductor Volume K Forecast, by Country 2020 & 2033
- Table 13: United States Specialty Gases For Semiconductor Revenue (million) Forecast, by Application 2020 & 2033
- Table 14: United States Specialty Gases For Semiconductor Volume (K) Forecast, by Application 2020 & 2033
- Table 15: Canada Specialty Gases For Semiconductor Revenue (million) Forecast, by Application 2020 & 2033
- Table 16: Canada Specialty Gases For Semiconductor Volume (K) Forecast, by Application 2020 & 2033
- Table 17: Mexico Specialty Gases For Semiconductor Revenue (million) Forecast, by Application 2020 & 2033
- Table 18: Mexico Specialty Gases For Semiconductor Volume (K) Forecast, by Application 2020 & 2033
- Table 19: Global Specialty Gases For Semiconductor Revenue million Forecast, by Application 2020 & 2033
- Table 20: Global Specialty Gases For Semiconductor Volume K Forecast, by Application 2020 & 2033
- Table 21: Global Specialty Gases For Semiconductor Revenue million Forecast, by Type 2020 & 2033
- Table 22: Global Specialty Gases For Semiconductor Volume K Forecast, by Type 2020 & 2033
- Table 23: Global Specialty Gases For Semiconductor Revenue million Forecast, by Country 2020 & 2033
- Table 24: Global Specialty Gases For Semiconductor Volume K Forecast, by Country 2020 & 2033
- Table 25: Brazil Specialty Gases For Semiconductor Revenue (million) Forecast, by Application 2020 & 2033
- Table 26: Brazil Specialty Gases For Semiconductor Volume (K) Forecast, by Application 2020 & 2033
- Table 27: Argentina Specialty Gases For Semiconductor Revenue (million) Forecast, by Application 2020 & 2033
- Table 28: Argentina Specialty Gases For Semiconductor Volume (K) Forecast, by Application 2020 & 2033
- Table 29: Rest of South America Specialty Gases For Semiconductor Revenue (million) Forecast, by Application 2020 & 2033
- Table 30: Rest of South America Specialty Gases For Semiconductor Volume (K) Forecast, by Application 2020 & 2033
- Table 31: Global Specialty Gases For Semiconductor Revenue million Forecast, by Application 2020 & 2033
- Table 32: Global Specialty Gases For Semiconductor Volume K Forecast, by Application 2020 & 2033
- Table 33: Global Specialty Gases For Semiconductor Revenue million Forecast, by Type 2020 & 2033
- Table 34: Global Specialty Gases For Semiconductor Volume K Forecast, by Type 2020 & 2033
- Table 35: Global Specialty Gases For Semiconductor Revenue million Forecast, by Country 2020 & 2033
- Table 36: Global Specialty Gases For Semiconductor Volume K Forecast, by Country 2020 & 2033
- Table 37: United Kingdom Specialty Gases For Semiconductor Revenue (million) Forecast, by Application 2020 & 2033
- Table 38: United Kingdom Specialty Gases For Semiconductor Volume (K) Forecast, by Application 2020 & 2033
- Table 39: Germany Specialty Gases For Semiconductor Revenue (million) Forecast, by Application 2020 & 2033
- Table 40: Germany Specialty Gases For Semiconductor Volume (K) Forecast, by Application 2020 & 2033
- Table 41: France Specialty Gases For Semiconductor Revenue (million) Forecast, by Application 2020 & 2033
- Table 42: France Specialty Gases For Semiconductor Volume (K) Forecast, by Application 2020 & 2033
- Table 43: Italy Specialty Gases For Semiconductor Revenue (million) Forecast, by Application 2020 & 2033
- Table 44: Italy Specialty Gases For Semiconductor Volume (K) Forecast, by Application 2020 & 2033
- Table 45: Spain Specialty Gases For Semiconductor Revenue (million) Forecast, by Application 2020 & 2033
- Table 46: Spain Specialty Gases For Semiconductor Volume (K) Forecast, by Application 2020 & 2033
- Table 47: Russia Specialty Gases For Semiconductor Revenue (million) Forecast, by Application 2020 & 2033
- Table 48: Russia Specialty Gases For Semiconductor Volume (K) Forecast, by Application 2020 & 2033
- Table 49: Benelux Specialty Gases For Semiconductor Revenue (million) Forecast, by Application 2020 & 2033
- Table 50: Benelux Specialty Gases For Semiconductor Volume (K) Forecast, by Application 2020 & 2033
- Table 51: Nordics Specialty Gases For Semiconductor Revenue (million) Forecast, by Application 2020 & 2033
- Table 52: Nordics Specialty Gases For Semiconductor Volume (K) Forecast, by Application 2020 & 2033
- Table 53: Rest of Europe Specialty Gases For Semiconductor Revenue (million) Forecast, by Application 2020 & 2033
- Table 54: Rest of Europe Specialty Gases For Semiconductor Volume (K) Forecast, by Application 2020 & 2033
- Table 55: Global Specialty Gases For Semiconductor Revenue million Forecast, by Application 2020 & 2033
- Table 56: Global Specialty Gases For Semiconductor Volume K Forecast, by Application 2020 & 2033
- Table 57: Global Specialty Gases For Semiconductor Revenue million Forecast, by Type 2020 & 2033
- Table 58: Global Specialty Gases For Semiconductor Volume K Forecast, by Type 2020 & 2033
- Table 59: Global Specialty Gases For Semiconductor Revenue million Forecast, by Country 2020 & 2033
- Table 60: Global Specialty Gases For Semiconductor Volume K Forecast, by Country 2020 & 2033
- Table 61: Turkey Specialty Gases For Semiconductor Revenue (million) Forecast, by Application 2020 & 2033
- Table 62: Turkey Specialty Gases For Semiconductor Volume (K) Forecast, by Application 2020 & 2033
- Table 63: Israel Specialty Gases For Semiconductor Revenue (million) Forecast, by Application 2020 & 2033
- Table 64: Israel Specialty Gases For Semiconductor Volume (K) Forecast, by Application 2020 & 2033
- Table 65: GCC Specialty Gases For Semiconductor Revenue (million) Forecast, by Application 2020 & 2033
- Table 66: GCC Specialty Gases For Semiconductor Volume (K) Forecast, by Application 2020 & 2033
- Table 67: North Africa Specialty Gases For Semiconductor Revenue (million) Forecast, by Application 2020 & 2033
- Table 68: North Africa Specialty Gases For Semiconductor Volume (K) Forecast, by Application 2020 & 2033
- Table 69: South Africa Specialty Gases For Semiconductor Revenue (million) Forecast, by Application 2020 & 2033
- Table 70: South Africa Specialty Gases For Semiconductor Volume (K) Forecast, by Application 2020 & 2033
- Table 71: Rest of Middle East & Africa Specialty Gases For Semiconductor Revenue (million) Forecast, by Application 2020 & 2033
- Table 72: Rest of Middle East & Africa Specialty Gases For Semiconductor Volume (K) Forecast, by Application 2020 & 2033
- Table 73: Global Specialty Gases For Semiconductor Revenue million Forecast, by Application 2020 & 2033
- Table 74: Global Specialty Gases For Semiconductor Volume K Forecast, by Application 2020 & 2033
- Table 75: Global Specialty Gases For Semiconductor Revenue million Forecast, by Type 2020 & 2033
- Table 76: Global Specialty Gases For Semiconductor Volume K Forecast, by Type 2020 & 2033
- Table 77: Global Specialty Gases For Semiconductor Revenue million Forecast, by Country 2020 & 2033
- Table 78: Global Specialty Gases For Semiconductor Volume K Forecast, by Country 2020 & 2033
- Table 79: China Specialty Gases For Semiconductor Revenue (million) Forecast, by Application 2020 & 2033
- Table 80: China Specialty Gases For Semiconductor Volume (K) Forecast, by Application 2020 & 2033
- Table 81: India Specialty Gases For Semiconductor Revenue (million) Forecast, by Application 2020 & 2033
- Table 82: India Specialty Gases For Semiconductor Volume (K) Forecast, by Application 2020 & 2033
- Table 83: Japan Specialty Gases For Semiconductor Revenue (million) Forecast, by Application 2020 & 2033
- Table 84: Japan Specialty Gases For Semiconductor Volume (K) Forecast, by Application 2020 & 2033
- Table 85: South Korea Specialty Gases For Semiconductor Revenue (million) Forecast, by Application 2020 & 2033
- Table 86: South Korea Specialty Gases For Semiconductor Volume (K) Forecast, by Application 2020 & 2033
- Table 87: ASEAN Specialty Gases For Semiconductor Revenue (million) Forecast, by Application 2020 & 2033
- Table 88: ASEAN Specialty Gases For Semiconductor Volume (K) Forecast, by Application 2020 & 2033
- Table 89: Oceania Specialty Gases For Semiconductor Revenue (million) Forecast, by Application 2020 & 2033
- Table 90: Oceania Specialty Gases For Semiconductor Volume (K) Forecast, by Application 2020 & 2033
- Table 91: Rest of Asia Pacific Specialty Gases For Semiconductor Revenue (million) Forecast, by Application 2020 & 2033
- Table 92: Rest of Asia Pacific Specialty Gases For Semiconductor Volume (K) Forecast, by Application 2020 & 2033
Frequently Asked Questions
1. What is the projected Compound Annual Growth Rate (CAGR) of the Specialty Gases For Semiconductor?
The projected CAGR is approximately 6.4%.
2. Which companies are prominent players in the Specialty Gases For Semiconductor?
Key companies in the market include SK Materials (SK specialty), Merck (Versum Materials), Taiyo Nippon Sanso, Linde plc, Kanto Denka Kogyo, Hyosung, PERIC, Showa Denko, Mitsui Chemical, ChemChina, Shandong FeiYuan, Guangdong Huate Gas, Central Glass.
3. What are the main segments of the Specialty Gases For Semiconductor?
The market segments include Application, Type.
4. Can you provide details about the market size?
The market size is estimated to be USD 4999 million as of 2022.
5. What are some drivers contributing to market growth?
N/A
6. What are the notable trends driving market growth?
N/A
7. Are there any restraints impacting market growth?
N/A
8. Can you provide examples of recent developments in the market?
N/A
9. What pricing options are available for accessing the report?
Pricing options include single-user, multi-user, and enterprise licenses priced at USD 3950.00, USD 5925.00, and USD 7900.00 respectively.
10. Is the market size provided in terms of value or volume?
The market size is provided in terms of value, measured in million and volume, measured in K.
11. Are there any specific market keywords associated with the report?
Yes, the market keyword associated with the report is "Specialty Gases For Semiconductor," which aids in identifying and referencing the specific market segment covered.
12. How do I determine which pricing option suits my needs best?
The pricing options vary based on user requirements and access needs. Individual users may opt for single-user licenses, while businesses requiring broader access may choose multi-user or enterprise licenses for cost-effective access to the report.
13. Are there any additional resources or data provided in the Specialty Gases For Semiconductor report?
While the report offers comprehensive insights, it's advisable to review the specific contents or supplementary materials provided to ascertain if additional resources or data are available.
14. How can I stay updated on further developments or reports in the Specialty Gases For Semiconductor?
To stay informed about further developments, trends, and reports in the Specialty Gases For Semiconductor, consider subscribing to industry newsletters, following relevant companies and organizations, or regularly checking reputable industry news sources and publications.
Methodology
Step 1 - Identification of Relevant Samples Size from Population Database


Step 2 - Approaches for Defining Global Market Size (Value, Volume* & Price*)

Note*: In applicable scenarios
Step 3 - Data Sources
Primary Research
- Web Analytics
- Survey Reports
- Research Institute
- Latest Research Reports
- Opinion Leaders
Secondary Research
- Annual Reports
- White Paper
- Latest Press Release
- Industry Association
- Paid Database
- Investor Presentations

Step 4 - Data Triangulation
Involves using different sources of information in order to increase the validity of a study
These sources are likely to be stakeholders in a program - participants, other researchers, program staff, other community members, and so on.
Then we put all data in single framework & apply various statistical tools to find out the dynamic on the market.
During the analysis stage, feedback from the stakeholder groups would be compared to determine areas of agreement as well as areas of divergence