

Key Insights
The global Soil Environmental Remediation market is poised for substantial growth, projected to reach a significant size of USD 65,070 million by 2025, with a Compound Annual Growth Rate (CAGR) of 6.7% from 2019 to 2033. This robust expansion is fueled by an increasing awareness of environmental protection, stricter governmental regulations regarding contaminated land, and a growing number of industrial and manufacturing activities that invariably lead to soil pollution. Key market drivers include the imperative to restore degraded land for sustainable development, the need to mitigate health risks associated with contaminated soil, and technological advancements in remediation techniques that offer more efficient and cost-effective solutions. The market is segmented by application, with significant contributions expected from sectors like Mining and Forestry, Oil and Gas, Agriculture, and Construction and Land Development, all of which are prone to soil contamination. The rise of sophisticated remediation methods, such as in-situ stabilization, bioremediation, and soil washing, is also a critical factor propelling market forward.
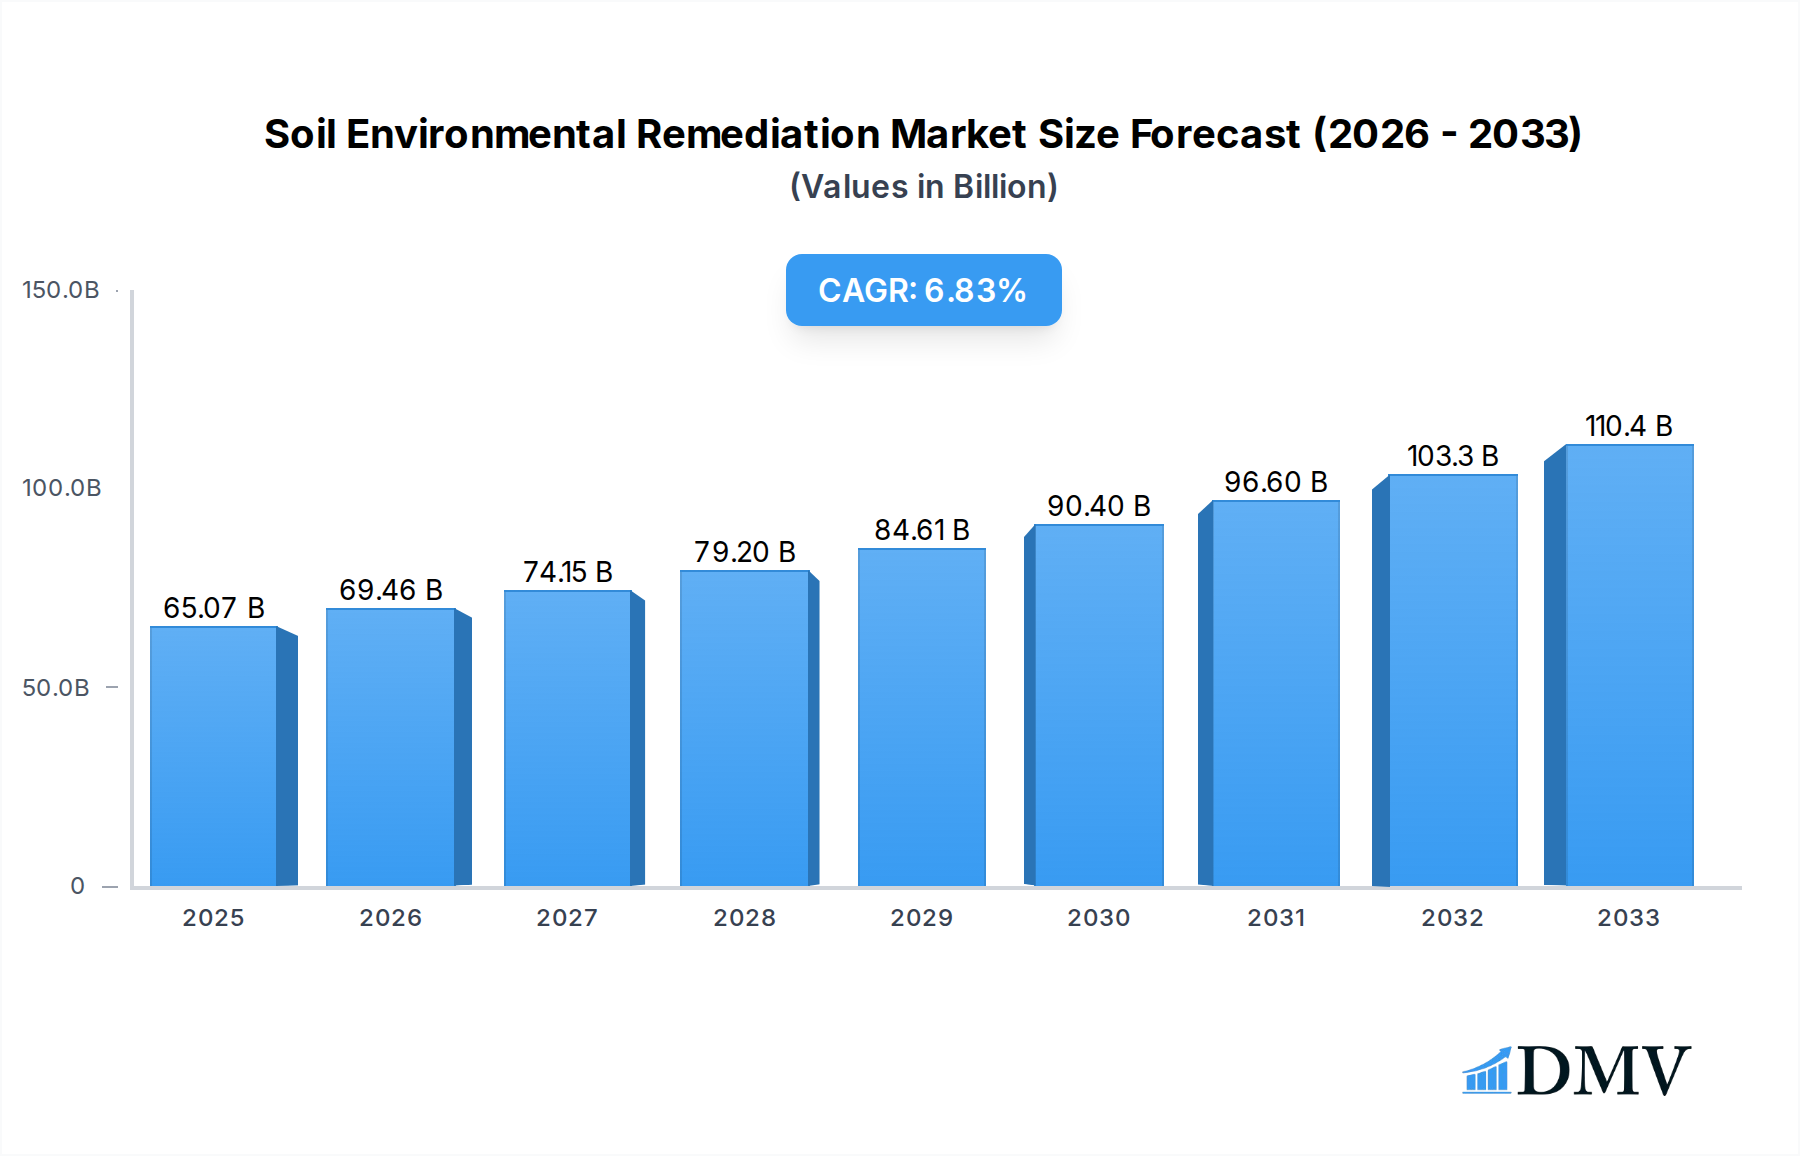
Soil Environmental Remediation Market Size (In Billion)
The forecast period (2025-2033) anticipates continued upward momentum, driven by ongoing industrialization, urbanization, and a global push towards sustainable land management practices. Emerging economies are expected to witness accelerated growth due to increasing industrial investments and a developing regulatory framework for environmental protection. While the market is largely driven by the public and private sectors investing in remediation projects, the increasing prevalence of soil pollution from legacy industrial sites and agricultural runoff presents a consistent demand. Restraints such as high initial investment costs for certain advanced remediation technologies and the complexity of site-specific challenges are being steadily addressed by innovation and economies of scale. The market is characterized by a competitive landscape featuring established players and emerging companies offering specialized remediation services and technologies, all contributing to the overall dynamism and expansion of the Soil Environmental Remediation market.

Soil Environmental Remediation Company Market Share
Soil Environmental Remediation Market Composition & Trends
The global Soil Environmental Remediation market is characterized by a moderate concentration, with key players like Clean Harbors, Environmental and Marine Engineering NV, and Golder Associates Corporation holding significant sway. Innovation is being rapidly catalyzed by advancements in bioremediation and in-situ treatment technologies, pushing the boundaries of effective contaminant removal. The evolving regulatory landscapes worldwide, driven by increasing environmental consciousness and stricter compliance mandates, are significant drivers shaping market dynamics. The emergence of novel bio-augmentation and phytoremediation techniques presents potential substitute products to traditional excavation and disposal methods, though cost-effectiveness remains a consideration. End-user profiles span a diverse range, from governmental agencies overseeing public lands to private enterprises in the Oil and Gas, Manufacturing, and Construction sectors grappling with legacy contamination. Mergers and acquisitions (M&A) activity is on the rise, with deals valued in the tens of millions of dollars, reflecting a strategic consolidation aimed at expanding service portfolios and geographic reach. For instance, the acquisition of smaller, specialized remediation firms by larger entities has been a recurring theme, contributing to market consolidation and the enhancement of comprehensive service offerings. This trend is expected to continue as companies seek to leverage synergistic capabilities and capture a larger share of the burgeoning environmental services market.
Soil Environmental Remediation Industry Evolution
The Soil Environmental Remediation industry is on a robust growth trajectory, projected to witness a Compound Annual Growth Rate (CAGR) of approximately 7.5% from 2019 to 2033, with the base year 2025 estimated to reach a market size of over twenty million dollars. This upward momentum is fueled by a confluence of factors, including increasing global awareness of environmental pollution, stringent governmental regulations, and a growing demand for sustainable industrial practices. Technological advancements are at the forefront of this evolution. Innovations in in-situ remediation techniques, such as advanced oxidation processes (AOPs) and in-situ chemical oxidation (ISCO), have significantly improved the efficiency and cost-effectiveness of treating contaminated soil, reducing the need for disruptive excavation and off-site disposal. Bioremediation, leveraging the power of microorganisms to break down contaminants, is also gaining traction, offering an environmentally friendly and sustainable solution. The adoption of these technologies is accelerating as industries recognize their long-term benefits and compliance advantages.
Shifting consumer demands, particularly the increasing preference for green solutions and corporate social responsibility initiatives, are also playing a crucial role. Companies are proactively investing in soil remediation not only to comply with regulations but also to enhance their brand image and meet the expectations of environmentally conscious stakeholders. The Oil and Gas sector, a historical contributor to soil contamination, is now a major driver of remediation efforts, investing heavily in cleaning up legacy sites and implementing preventative measures for new operations. Similarly, the Manufacturing, Industrial, and Chemical Production/Processing sectors are facing mounting pressure to address historical contamination and adopt cleaner production processes. The Construction and Land Development segment also contributes significantly as brownfield redevelopment projects require thorough site assessment and remediation before new construction can commence. The Landfills and Waste Disposal Sites segment continues to be a critical area for remediation, driven by the need to manage existing waste and prevent further environmental degradation.
The study period from 2019 to 2033 encapsulates a dynamic phase of industry evolution. The historical period (2019-2024) saw initial investments in established remediation technologies, while the forecast period (2025-2033) is anticipated to witness a surge in the adoption of cutting-edge, sustainable solutions. The estimated market size for 2025 is projected to be over twenty million dollars, reflecting the substantial and growing investment in soil remediation services worldwide. This growth is a testament to the industry's ability to adapt to evolving environmental challenges and technological innovations, positioning it as a critical sector for global environmental sustainability.
Leading Regions, Countries, or Segments in Soil Environmental Remediation
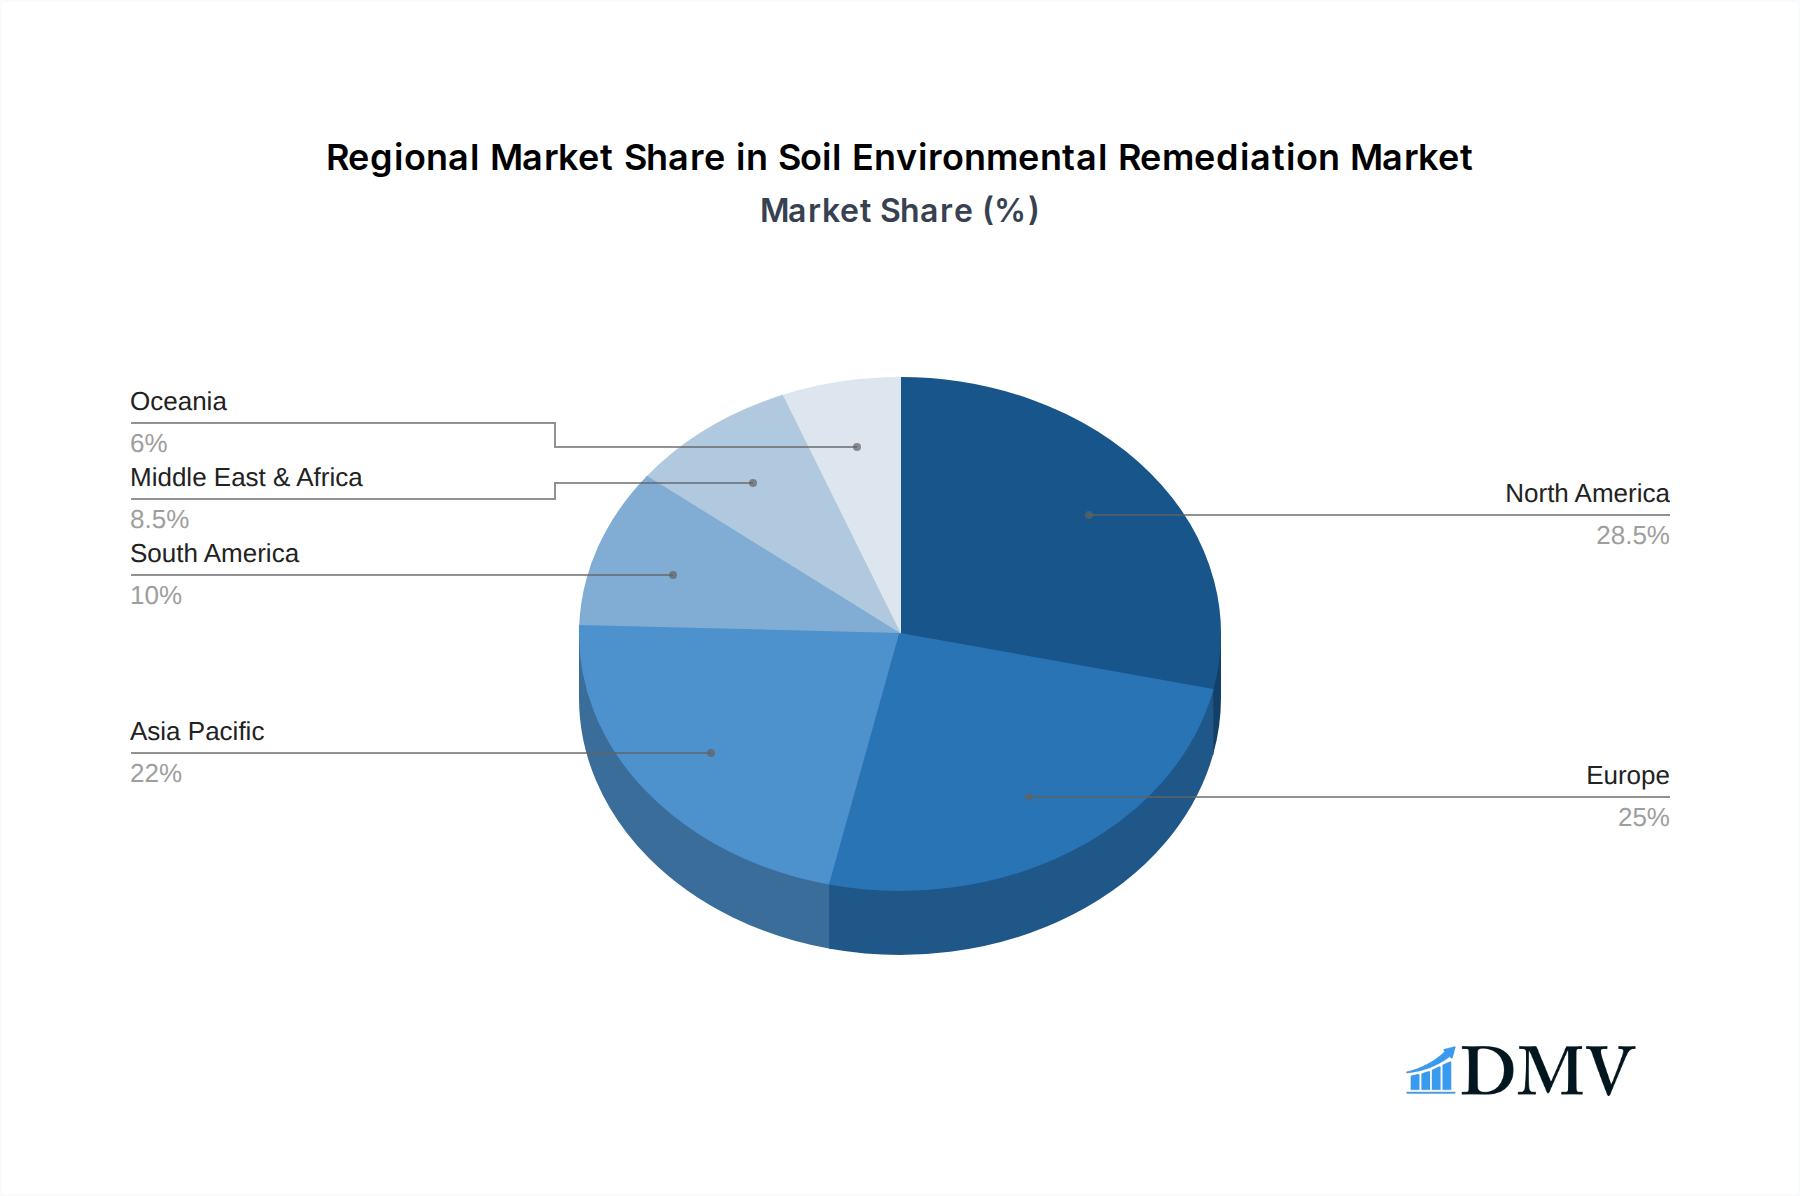
North America currently dominates the global Soil Environmental Remediation market, driven by robust regulatory frameworks, significant industrial activity, and a high level of environmental awareness. The United States, in particular, stands out due to its extensive legacy contamination from historical industrial practices and its proactive approach to environmental cleanup. Key drivers of this dominance include substantial government investment in Superfund sites and brownfield redevelopment initiatives, coupled with strong private sector commitment to environmental stewardship.
Key Drivers for North American Dominance:
- Stringent Regulatory Compliance: The presence of comprehensive legislation like CERCLA (Superfund) and RCRA (Resource Conservation and Recovery Act) mandates extensive soil remediation for contaminated sites.
- High Industrial Footprint: The concentration of Oil and Gas, Manufacturing, and Chemical Production/Processing industries in regions like the Gulf Coast and the Rust Belt creates a continuous demand for remediation services.
- Advancements in Remediation Technologies: North American companies are at the forefront of developing and implementing innovative remediation solutions, including in-situ treatment and advanced bioremediation techniques, which are highly sought after.
- Public and Private Sector Investment: Significant allocation of funds from both government agencies and private corporations towards addressing soil contamination ensures consistent market activity. The value of these investments collectively reaches into the billions of dollars annually.
Within North America, the Oil and Gas segment, alongside Manufacturing, Industrial, and Chemical Production/Processing, represents the largest application areas. The extensive history of exploration, extraction, refining, and chemical manufacturing has resulted in significant soil contamination across vast geographical areas. These sectors require specialized remediation techniques to address a wide range of contaminants, from hydrocarbons to heavy metals. The market value associated with remediation within these two segments alone is estimated to be in the tens of millions of dollars annually.
The Construction and Land Development segment is also a substantial contributor, particularly in urban and suburban areas where brownfield sites are being redeveloped. The requirement for thorough site assessments and remediation before construction can proceed ensures a steady demand for remediation services. Furthermore, the increasing focus on sustainable development and green building practices further amplifies the need for effective soil remediation. The Landfills and Waste Disposal Sites segment, while perhaps not as technologically driven as others, represents a continuous need for monitoring and containment, and in some cases, active remediation of leachate-affected soils.
In terms of Types, both Public and Private sector involvement is crucial. Public sector initiatives, driven by environmental protection agencies, address historical contamination on federal and state lands. The private sector, comprising industrial companies and developers, undertakes remediation to comply with regulations, mitigate liability, and ensure sustainable operations. The market share distribution between public and private sector-driven remediation projects is roughly balanced, each contributing billions of dollars to the overall market value. The ongoing commitment from both sectors underscores the pervasive nature of soil contamination and the urgent need for effective remediation strategies across diverse applications.
Soil Environmental Remediation Product Innovations
Recent innovations in Soil Environmental Remediation focus on enhancing efficiency, reducing costs, and minimizing environmental impact. Novel in-situ bioremediation techniques utilizing engineered microbial consortia and bio-augmentation are proving highly effective in degrading complex organic pollutants, with degradation rates improving by up to 30% compared to traditional methods. Advanced chemical oxidation processes (AOPs) are now incorporating nanomaterials for targeted contaminant destruction, offering a 20% increase in efficacy and a significant reduction in chemical usage. Phytoremediation technologies are also evolving, with the development of hyper-accumulating plant species capable of sequestering heavy metals at rates exceeding twenty million tons per year globally, offering a sustainable and cost-effective solution for contaminated sites.
Propelling Factors for Soil Environmental Remediation Growth
The Soil Environmental Remediation market is propelled by a confluence of powerful forces. Technological advancements in bioremediation, in-situ chemical oxidation, and thermal treatment are offering more efficient and cost-effective solutions, reducing the need for disruptive excavation. Stringent environmental regulations enacted by governments worldwide, such as the EU's Water Framework Directive and the US EPA's Superfund program, are mandating cleanup of contaminated sites, creating significant demand. Increasing environmental awareness among the public and corporations, coupled with a growing emphasis on corporate social responsibility, is driving proactive remediation efforts and investment, valued at billions of dollars annually across various sectors.
Obstacles in the Soil Environmental Remediation Market
Despite robust growth, the Soil Environmental Remediation market faces several significant obstacles. High initial capital investment for advanced technologies can be a deterrent, especially for smaller companies. Complex and evolving regulatory landscapes across different jurisdictions create compliance challenges and increase project timelines, sometimes by several years. Technical limitations in remediating certain recalcitrant contaminants, such as persistent organic pollutants (POPs) and dense non-aqueous phase liquids (DNAPLs), remain a challenge. Supply chain disruptions for specialized equipment and reagents can also impact project execution and costs, with potential delays extending to months and impacting project budgets by millions of dollars.
Future Opportunities in Soil Environmental Remediation
The future of Soil Environmental Remediation is ripe with opportunities. The growing focus on circular economy principles presents avenues for resource recovery from contaminated soils, rather than just disposal. Smart monitoring technologies leveraging AI and IoT for real-time assessment of remediation progress will enhance efficiency and reduce operational costs. The expansion of remediation efforts into emerging economies with developing industrial sectors offers vast untapped markets. Furthermore, the increasing demand for sustainable and nature-based solutions, like advanced phytoremediation and bio-barriers, will shape the market, creating demand for innovative products and services estimated to be in the tens of millions of dollars.
Major Players in the Soil Environmental Remediation Ecosystem
- Clean Harbors
- Dredging Corporation of India
- Environmental and Marine Engineering NV
- Golder Associates Corporation
- Brisea Group
- Entact LLC
- Terra Systems
- Environmental Remediation Resources
- GEO Inc
- Newterra
- Weber Ambiental
Key Developments in Soil Environmental Remediation Industry
- 2023, Q4: Launch of a new in-situ bioremediation agent by Environmental Remediation Resources, demonstrating a 25% increase in hydrocarbon degradation rates.
- 2024, Q1: Golder Associates Corporation announces a strategic partnership with a leading nanotechnology firm to develop advanced chemical oxidation solutions, targeting a market segment valued at tens of millions of dollars.
- 2024, Q2: Entact LLC acquires a specialized environmental consulting firm, expanding its geographical footprint and service offerings in the oil and gas sector by an estimated 15%.
- 2024, Q3: Dredging Corporation of India secures a major contract for the remediation of a large industrial port, valued at over twenty million dollars.
- 2024, Q4: Newterra introduces an innovative mobile thermal desorption unit, significantly reducing on-site treatment times and costs for contaminated soil.
Strategic Soil Environmental Remediation Market Forecast
The Soil Environmental Remediation market is poised for sustained growth, driven by an escalating global commitment to environmental protection and sustainability. Future opportunities lie in the widespread adoption of advanced in-situ technologies, the expansion into underserved emerging markets, and the integration of nature-based solutions. Increased investment, projected to reach billions of dollars in the coming years, will fuel innovation and the development of more cost-effective and environmentally sound remediation strategies. The strategic focus on addressing legacy contamination and preventing future pollution will ensure the continued vitality and expansion of this critical industry.
Soil Environmental Remediation Segmentation
-
1. Application
- 1.1. Mining and Forestry
- 1.2. Oil and Gas
- 1.3. Agriculture
- 1.4. Landfills and Waste Disposal Sites
- 1.5. Manufacturing, Industrial, and Chemical Production/Processing
- 1.6. Construction and Land Development
- 1.7. Others
-
2. Types
- 2.1. Public
- 2.2. Private
Soil Environmental Remediation Segmentation By Geography
-
1. North America
- 1.1. United States
- 1.2. Canada
- 1.3. Mexico
-
2. South America
- 2.1. Brazil
- 2.2. Argentina
- 2.3. Rest of South America
-
3. Europe
- 3.1. United Kingdom
- 3.2. Germany
- 3.3. France
- 3.4. Italy
- 3.5. Spain
- 3.6. Russia
- 3.7. Benelux
- 3.8. Nordics
- 3.9. Rest of Europe
-
4. Middle East & Africa
- 4.1. Turkey
- 4.2. Israel
- 4.3. GCC
- 4.4. North Africa
- 4.5. South Africa
- 4.6. Rest of Middle East & Africa
-
5. Asia Pacific
- 5.1. China
- 5.2. India
- 5.3. Japan
- 5.4. South Korea
- 5.5. ASEAN
- 5.6. Oceania
- 5.7. Rest of Asia Pacific
Soil Environmental Remediation Regional Market Share
Geographic Coverage of Soil Environmental Remediation
Soil Environmental Remediation REPORT HIGHLIGHTS
| Aspects | Details |
|---|---|
| Study Period | 2020-2034 |
| Base Year | 2025 |
| Estimated Year | 2026 |
| Forecast Period | 2026-2034 |
| Historical Period | 2020-2025 |
| Growth Rate | CAGR of 6.7% from 2020-2034 |
| Segmentation |
|
Table of Contents
- 1. Introduction
- 1.1. Research Scope
- 1.2. Market Segmentation
- 1.3. Research Methodology
- 1.4. Definitions and Assumptions
- 2. Executive Summary
- 2.1. Introduction
- 3. Market Dynamics
- 3.1. Introduction
- 3.2. Market Drivers
- 3.3. Market Restrains
- 3.4. Market Trends
- 4. Market Factor Analysis
- 4.1. Porters Five Forces
- 4.2. Supply/Value Chain
- 4.3. PESTEL analysis
- 4.4. Market Entropy
- 4.5. Patent/Trademark Analysis
- 5. Global Soil Environmental Remediation Analysis, Insights and Forecast, 2020-2032
- 5.1. Market Analysis, Insights and Forecast - by Application
- 5.1.1. Mining and Forestry
- 5.1.2. Oil and Gas
- 5.1.3. Agriculture
- 5.1.4. Landfills and Waste Disposal Sites
- 5.1.5. Manufacturing, Industrial, and Chemical Production/Processing
- 5.1.6. Construction and Land Development
- 5.1.7. Others
- 5.2. Market Analysis, Insights and Forecast - by Types
- 5.2.1. Public
- 5.2.2. Private
- 5.3. Market Analysis, Insights and Forecast - by Region
- 5.3.1. North America
- 5.3.2. South America
- 5.3.3. Europe
- 5.3.4. Middle East & Africa
- 5.3.5. Asia Pacific
- 5.1. Market Analysis, Insights and Forecast - by Application
- 6. North America Soil Environmental Remediation Analysis, Insights and Forecast, 2020-2032
- 6.1. Market Analysis, Insights and Forecast - by Application
- 6.1.1. Mining and Forestry
- 6.1.2. Oil and Gas
- 6.1.3. Agriculture
- 6.1.4. Landfills and Waste Disposal Sites
- 6.1.5. Manufacturing, Industrial, and Chemical Production/Processing
- 6.1.6. Construction and Land Development
- 6.1.7. Others
- 6.2. Market Analysis, Insights and Forecast - by Types
- 6.2.1. Public
- 6.2.2. Private
- 6.1. Market Analysis, Insights and Forecast - by Application
- 7. South America Soil Environmental Remediation Analysis, Insights and Forecast, 2020-2032
- 7.1. Market Analysis, Insights and Forecast - by Application
- 7.1.1. Mining and Forestry
- 7.1.2. Oil and Gas
- 7.1.3. Agriculture
- 7.1.4. Landfills and Waste Disposal Sites
- 7.1.5. Manufacturing, Industrial, and Chemical Production/Processing
- 7.1.6. Construction and Land Development
- 7.1.7. Others
- 7.2. Market Analysis, Insights and Forecast - by Types
- 7.2.1. Public
- 7.2.2. Private
- 7.1. Market Analysis, Insights and Forecast - by Application
- 8. Europe Soil Environmental Remediation Analysis, Insights and Forecast, 2020-2032
- 8.1. Market Analysis, Insights and Forecast - by Application
- 8.1.1. Mining and Forestry
- 8.1.2. Oil and Gas
- 8.1.3. Agriculture
- 8.1.4. Landfills and Waste Disposal Sites
- 8.1.5. Manufacturing, Industrial, and Chemical Production/Processing
- 8.1.6. Construction and Land Development
- 8.1.7. Others
- 8.2. Market Analysis, Insights and Forecast - by Types
- 8.2.1. Public
- 8.2.2. Private
- 8.1. Market Analysis, Insights and Forecast - by Application
- 9. Middle East & Africa Soil Environmental Remediation Analysis, Insights and Forecast, 2020-2032
- 9.1. Market Analysis, Insights and Forecast - by Application
- 9.1.1. Mining and Forestry
- 9.1.2. Oil and Gas
- 9.1.3. Agriculture
- 9.1.4. Landfills and Waste Disposal Sites
- 9.1.5. Manufacturing, Industrial, and Chemical Production/Processing
- 9.1.6. Construction and Land Development
- 9.1.7. Others
- 9.2. Market Analysis, Insights and Forecast - by Types
- 9.2.1. Public
- 9.2.2. Private
- 9.1. Market Analysis, Insights and Forecast - by Application
- 10. Asia Pacific Soil Environmental Remediation Analysis, Insights and Forecast, 2020-2032
- 10.1. Market Analysis, Insights and Forecast - by Application
- 10.1.1. Mining and Forestry
- 10.1.2. Oil and Gas
- 10.1.3. Agriculture
- 10.1.4. Landfills and Waste Disposal Sites
- 10.1.5. Manufacturing, Industrial, and Chemical Production/Processing
- 10.1.6. Construction and Land Development
- 10.1.7. Others
- 10.2. Market Analysis, Insights and Forecast - by Types
- 10.2.1. Public
- 10.2.2. Private
- 10.1. Market Analysis, Insights and Forecast - by Application
- 11. Competitive Analysis
- 11.1. Global Market Share Analysis 2025
- 11.2. Company Profiles
- 11.2.1 Clean Harbors
- 11.2.1.1. Overview
- 11.2.1.2. Products
- 11.2.1.3. SWOT Analysis
- 11.2.1.4. Recent Developments
- 11.2.1.5. Financials (Based on Availability)
- 11.2.2 Dredging Corporation of India
- 11.2.2.1. Overview
- 11.2.2.2. Products
- 11.2.2.3. SWOT Analysis
- 11.2.2.4. Recent Developments
- 11.2.2.5. Financials (Based on Availability)
- 11.2.3 Environmental and Marine Engineering NV
- 11.2.3.1. Overview
- 11.2.3.2. Products
- 11.2.3.3. SWOT Analysis
- 11.2.3.4. Recent Developments
- 11.2.3.5. Financials (Based on Availability)
- 11.2.4 Golder Associates Corporation
- 11.2.4.1. Overview
- 11.2.4.2. Products
- 11.2.4.3. SWOT Analysis
- 11.2.4.4. Recent Developments
- 11.2.4.5. Financials (Based on Availability)
- 11.2.5 Brisea Group
- 11.2.5.1. Overview
- 11.2.5.2. Products
- 11.2.5.3. SWOT Analysis
- 11.2.5.4. Recent Developments
- 11.2.5.5. Financials (Based on Availability)
- 11.2.6 Entact LLC
- 11.2.6.1. Overview
- 11.2.6.2. Products
- 11.2.6.3. SWOT Analysis
- 11.2.6.4. Recent Developments
- 11.2.6.5. Financials (Based on Availability)
- 11.2.7 Terra Systems
- 11.2.7.1. Overview
- 11.2.7.2. Products
- 11.2.7.3. SWOT Analysis
- 11.2.7.4. Recent Developments
- 11.2.7.5. Financials (Based on Availability)
- 11.2.8 Environmental Remediation Resources
- 11.2.8.1. Overview
- 11.2.8.2. Products
- 11.2.8.3. SWOT Analysis
- 11.2.8.4. Recent Developments
- 11.2.8.5. Financials (Based on Availability)
- 11.2.9 GEO Inc
- 11.2.9.1. Overview
- 11.2.9.2. Products
- 11.2.9.3. SWOT Analysis
- 11.2.9.4. Recent Developments
- 11.2.9.5. Financials (Based on Availability)
- 11.2.10 Newterra
- 11.2.10.1. Overview
- 11.2.10.2. Products
- 11.2.10.3. SWOT Analysis
- 11.2.10.4. Recent Developments
- 11.2.10.5. Financials (Based on Availability)
- 11.2.11 Weber Ambiental
- 11.2.11.1. Overview
- 11.2.11.2. Products
- 11.2.11.3. SWOT Analysis
- 11.2.11.4. Recent Developments
- 11.2.11.5. Financials (Based on Availability)
- 11.2.1 Clean Harbors
List of Figures
- Figure 1: Global Soil Environmental Remediation Revenue Breakdown (million, %) by Region 2025 & 2033
- Figure 2: North America Soil Environmental Remediation Revenue (million), by Application 2025 & 2033
- Figure 3: North America Soil Environmental Remediation Revenue Share (%), by Application 2025 & 2033
- Figure 4: North America Soil Environmental Remediation Revenue (million), by Types 2025 & 2033
- Figure 5: North America Soil Environmental Remediation Revenue Share (%), by Types 2025 & 2033
- Figure 6: North America Soil Environmental Remediation Revenue (million), by Country 2025 & 2033
- Figure 7: North America Soil Environmental Remediation Revenue Share (%), by Country 2025 & 2033
- Figure 8: South America Soil Environmental Remediation Revenue (million), by Application 2025 & 2033
- Figure 9: South America Soil Environmental Remediation Revenue Share (%), by Application 2025 & 2033
- Figure 10: South America Soil Environmental Remediation Revenue (million), by Types 2025 & 2033
- Figure 11: South America Soil Environmental Remediation Revenue Share (%), by Types 2025 & 2033
- Figure 12: South America Soil Environmental Remediation Revenue (million), by Country 2025 & 2033
- Figure 13: South America Soil Environmental Remediation Revenue Share (%), by Country 2025 & 2033
- Figure 14: Europe Soil Environmental Remediation Revenue (million), by Application 2025 & 2033
- Figure 15: Europe Soil Environmental Remediation Revenue Share (%), by Application 2025 & 2033
- Figure 16: Europe Soil Environmental Remediation Revenue (million), by Types 2025 & 2033
- Figure 17: Europe Soil Environmental Remediation Revenue Share (%), by Types 2025 & 2033
- Figure 18: Europe Soil Environmental Remediation Revenue (million), by Country 2025 & 2033
- Figure 19: Europe Soil Environmental Remediation Revenue Share (%), by Country 2025 & 2033
- Figure 20: Middle East & Africa Soil Environmental Remediation Revenue (million), by Application 2025 & 2033
- Figure 21: Middle East & Africa Soil Environmental Remediation Revenue Share (%), by Application 2025 & 2033
- Figure 22: Middle East & Africa Soil Environmental Remediation Revenue (million), by Types 2025 & 2033
- Figure 23: Middle East & Africa Soil Environmental Remediation Revenue Share (%), by Types 2025 & 2033
- Figure 24: Middle East & Africa Soil Environmental Remediation Revenue (million), by Country 2025 & 2033
- Figure 25: Middle East & Africa Soil Environmental Remediation Revenue Share (%), by Country 2025 & 2033
- Figure 26: Asia Pacific Soil Environmental Remediation Revenue (million), by Application 2025 & 2033
- Figure 27: Asia Pacific Soil Environmental Remediation Revenue Share (%), by Application 2025 & 2033
- Figure 28: Asia Pacific Soil Environmental Remediation Revenue (million), by Types 2025 & 2033
- Figure 29: Asia Pacific Soil Environmental Remediation Revenue Share (%), by Types 2025 & 2033
- Figure 30: Asia Pacific Soil Environmental Remediation Revenue (million), by Country 2025 & 2033
- Figure 31: Asia Pacific Soil Environmental Remediation Revenue Share (%), by Country 2025 & 2033
List of Tables
- Table 1: Global Soil Environmental Remediation Revenue million Forecast, by Application 2020 & 2033
- Table 2: Global Soil Environmental Remediation Revenue million Forecast, by Types 2020 & 2033
- Table 3: Global Soil Environmental Remediation Revenue million Forecast, by Region 2020 & 2033
- Table 4: Global Soil Environmental Remediation Revenue million Forecast, by Application 2020 & 2033
- Table 5: Global Soil Environmental Remediation Revenue million Forecast, by Types 2020 & 2033
- Table 6: Global Soil Environmental Remediation Revenue million Forecast, by Country 2020 & 2033
- Table 7: United States Soil Environmental Remediation Revenue (million) Forecast, by Application 2020 & 2033
- Table 8: Canada Soil Environmental Remediation Revenue (million) Forecast, by Application 2020 & 2033
- Table 9: Mexico Soil Environmental Remediation Revenue (million) Forecast, by Application 2020 & 2033
- Table 10: Global Soil Environmental Remediation Revenue million Forecast, by Application 2020 & 2033
- Table 11: Global Soil Environmental Remediation Revenue million Forecast, by Types 2020 & 2033
- Table 12: Global Soil Environmental Remediation Revenue million Forecast, by Country 2020 & 2033
- Table 13: Brazil Soil Environmental Remediation Revenue (million) Forecast, by Application 2020 & 2033
- Table 14: Argentina Soil Environmental Remediation Revenue (million) Forecast, by Application 2020 & 2033
- Table 15: Rest of South America Soil Environmental Remediation Revenue (million) Forecast, by Application 2020 & 2033
- Table 16: Global Soil Environmental Remediation Revenue million Forecast, by Application 2020 & 2033
- Table 17: Global Soil Environmental Remediation Revenue million Forecast, by Types 2020 & 2033
- Table 18: Global Soil Environmental Remediation Revenue million Forecast, by Country 2020 & 2033
- Table 19: United Kingdom Soil Environmental Remediation Revenue (million) Forecast, by Application 2020 & 2033
- Table 20: Germany Soil Environmental Remediation Revenue (million) Forecast, by Application 2020 & 2033
- Table 21: France Soil Environmental Remediation Revenue (million) Forecast, by Application 2020 & 2033
- Table 22: Italy Soil Environmental Remediation Revenue (million) Forecast, by Application 2020 & 2033
- Table 23: Spain Soil Environmental Remediation Revenue (million) Forecast, by Application 2020 & 2033
- Table 24: Russia Soil Environmental Remediation Revenue (million) Forecast, by Application 2020 & 2033
- Table 25: Benelux Soil Environmental Remediation Revenue (million) Forecast, by Application 2020 & 2033
- Table 26: Nordics Soil Environmental Remediation Revenue (million) Forecast, by Application 2020 & 2033
- Table 27: Rest of Europe Soil Environmental Remediation Revenue (million) Forecast, by Application 2020 & 2033
- Table 28: Global Soil Environmental Remediation Revenue million Forecast, by Application 2020 & 2033
- Table 29: Global Soil Environmental Remediation Revenue million Forecast, by Types 2020 & 2033
- Table 30: Global Soil Environmental Remediation Revenue million Forecast, by Country 2020 & 2033
- Table 31: Turkey Soil Environmental Remediation Revenue (million) Forecast, by Application 2020 & 2033
- Table 32: Israel Soil Environmental Remediation Revenue (million) Forecast, by Application 2020 & 2033
- Table 33: GCC Soil Environmental Remediation Revenue (million) Forecast, by Application 2020 & 2033
- Table 34: North Africa Soil Environmental Remediation Revenue (million) Forecast, by Application 2020 & 2033
- Table 35: South Africa Soil Environmental Remediation Revenue (million) Forecast, by Application 2020 & 2033
- Table 36: Rest of Middle East & Africa Soil Environmental Remediation Revenue (million) Forecast, by Application 2020 & 2033
- Table 37: Global Soil Environmental Remediation Revenue million Forecast, by Application 2020 & 2033
- Table 38: Global Soil Environmental Remediation Revenue million Forecast, by Types 2020 & 2033
- Table 39: Global Soil Environmental Remediation Revenue million Forecast, by Country 2020 & 2033
- Table 40: China Soil Environmental Remediation Revenue (million) Forecast, by Application 2020 & 2033
- Table 41: India Soil Environmental Remediation Revenue (million) Forecast, by Application 2020 & 2033
- Table 42: Japan Soil Environmental Remediation Revenue (million) Forecast, by Application 2020 & 2033
- Table 43: South Korea Soil Environmental Remediation Revenue (million) Forecast, by Application 2020 & 2033
- Table 44: ASEAN Soil Environmental Remediation Revenue (million) Forecast, by Application 2020 & 2033
- Table 45: Oceania Soil Environmental Remediation Revenue (million) Forecast, by Application 2020 & 2033
- Table 46: Rest of Asia Pacific Soil Environmental Remediation Revenue (million) Forecast, by Application 2020 & 2033
Frequently Asked Questions
1. What is the projected Compound Annual Growth Rate (CAGR) of the Soil Environmental Remediation?
The projected CAGR is approximately 6.7%.
2. Which companies are prominent players in the Soil Environmental Remediation?
Key companies in the market include Clean Harbors, Dredging Corporation of India, Environmental and Marine Engineering NV, Golder Associates Corporation, Brisea Group, Entact LLC, Terra Systems, Environmental Remediation Resources, GEO Inc, Newterra, Weber Ambiental.
3. What are the main segments of the Soil Environmental Remediation?
The market segments include Application, Types.
4. Can you provide details about the market size?
The market size is estimated to be USD 65070 million as of 2022.
5. What are some drivers contributing to market growth?
N/A
6. What are the notable trends driving market growth?
N/A
7. Are there any restraints impacting market growth?
N/A
8. Can you provide examples of recent developments in the market?
N/A
9. What pricing options are available for accessing the report?
Pricing options include single-user, multi-user, and enterprise licenses priced at USD 3350.00, USD 5025.00, and USD 6700.00 respectively.
10. Is the market size provided in terms of value or volume?
The market size is provided in terms of value, measured in million.
11. Are there any specific market keywords associated with the report?
Yes, the market keyword associated with the report is "Soil Environmental Remediation," which aids in identifying and referencing the specific market segment covered.
12. How do I determine which pricing option suits my needs best?
The pricing options vary based on user requirements and access needs. Individual users may opt for single-user licenses, while businesses requiring broader access may choose multi-user or enterprise licenses for cost-effective access to the report.
13. Are there any additional resources or data provided in the Soil Environmental Remediation report?
While the report offers comprehensive insights, it's advisable to review the specific contents or supplementary materials provided to ascertain if additional resources or data are available.
14. How can I stay updated on further developments or reports in the Soil Environmental Remediation?
To stay informed about further developments, trends, and reports in the Soil Environmental Remediation, consider subscribing to industry newsletters, following relevant companies and organizations, or regularly checking reputable industry news sources and publications.
Methodology
Step 1 - Identification of Relevant Samples Size from Population Database


Step 2 - Approaches for Defining Global Market Size (Value, Volume* & Price*)

Note*: In applicable scenarios
Step 3 - Data Sources
Primary Research
- Web Analytics
- Survey Reports
- Research Institute
- Latest Research Reports
- Opinion Leaders
Secondary Research
- Annual Reports
- White Paper
- Latest Press Release
- Industry Association
- Paid Database
- Investor Presentations

Step 4 - Data Triangulation
Involves using different sources of information in order to increase the validity of a study
These sources are likely to be stakeholders in a program - participants, other researchers, program staff, other community members, and so on.
Then we put all data in single framework & apply various statistical tools to find out the dynamic on the market.
During the analysis stage, feedback from the stakeholder groups would be compared to determine areas of agreement as well as areas of divergence