

Key Insights
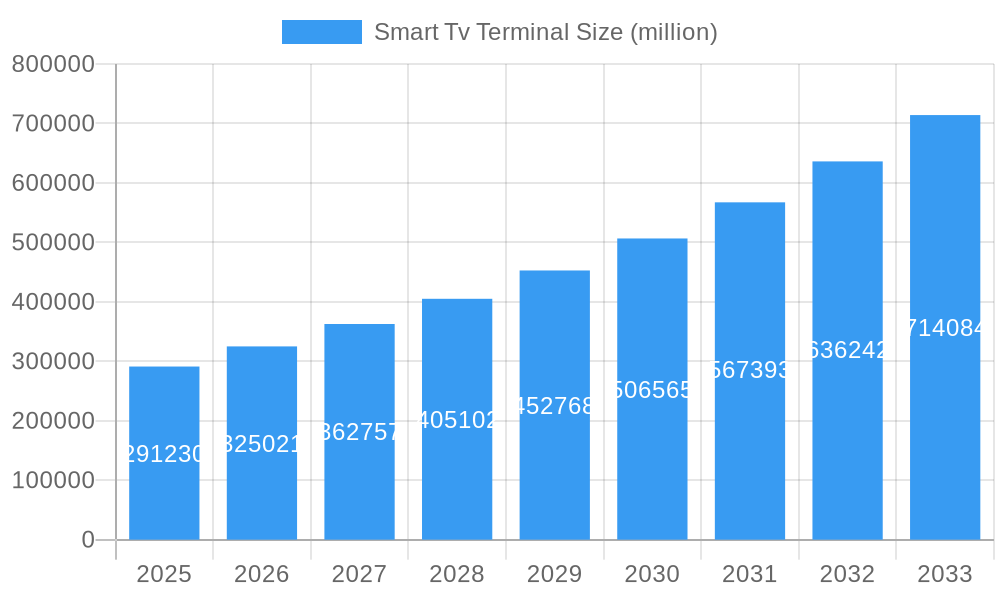
The global Smart TV Terminal market is poised for significant expansion, projected to reach a substantial market size of $291.23 billion by 2025, demonstrating robust growth momentum. This upward trajectory is fueled by a compelling compound annual growth rate (CAGR) of 11.5%, indicating sustained innovation and increasing consumer adoption. The primary drivers of this growth are the escalating demand for enhanced home entertainment experiences, coupled with the proliferation of smart home ecosystems where the smart TV acts as a central hub. Advancements in display technologies like LED and OLED are pivotal, offering superior picture quality, energy efficiency, and immersive viewing. The increasing affordability and accessibility of these advanced display types are further democratizing the market, encouraging wider adoption across both residential and commercial sectors. The convenience of integrated streaming services, voice control functionalities, and seamless connectivity with other smart devices are rapidly transforming how consumers interact with their televisions, positioning the smart TV terminal as an indispensable component of modern living.
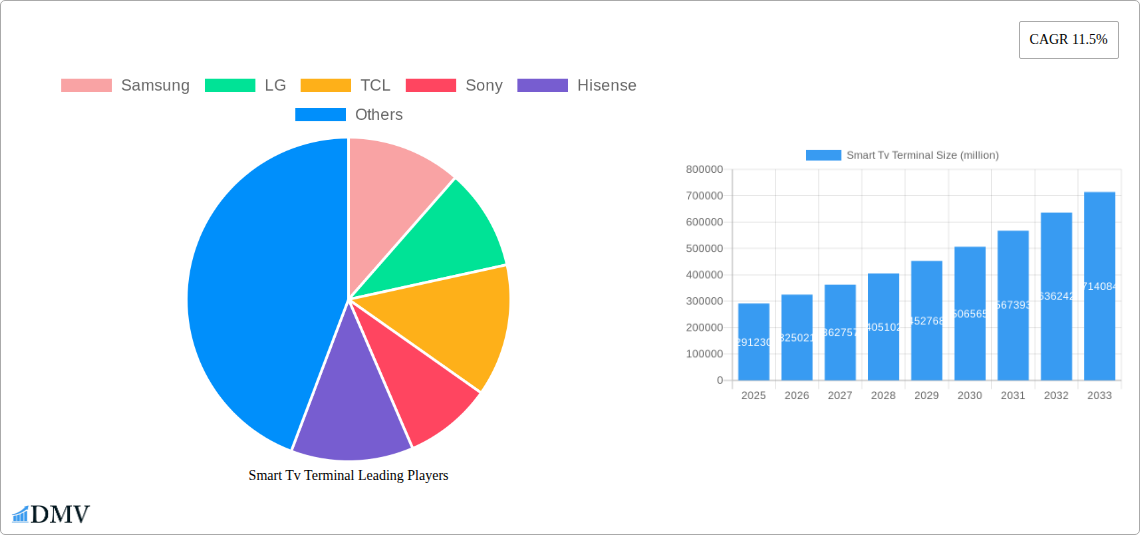
Smart Tv Terminal Market Size (In Billion)
The market is segmented effectively by application into Home and Commercial segments, with the Home segment likely holding a dominant share due to increasing disposable incomes and a growing preference for premium in-home entertainment solutions. Within the type segment, both LED and OLED technologies are expected to witness substantial growth, with OLED capturing a significant share of the premium market segment due to its superior contrast ratios and vibrant colors. Key global players such as Samsung, LG, TCL, Sony, and Hisense are actively innovating, launching new models with cutting-edge features and competitive pricing strategies. Emerging markets in the Asia Pacific region, particularly China and India, are anticipated to be significant growth engines, driven by a burgeoning middle class and rapid urbanization. North America and Europe will continue to be mature yet substantial markets, characterized by high adoption rates and a demand for premium features. The forecast period from 2025 to 2033 anticipates continued evolution, with potential trends including further integration of AI, enhanced interactivity, and the development of more sustainable display technologies.
Smart Tv Terminal Company Market Share
Smart Tv Terminal Market Composition & Trends
This comprehensive report delves into the intricate landscape of the Smart TV Terminal market, meticulously dissecting its composition and identifying pivotal trends. The market exhibits a moderate to high concentration, with key players like Samsung, LG, TCL, Sony, Hisense, Xiaomi, Philips+AOC, Skyworth, Sharp, Vizio, and Changhong vying for significant market share. Innovation remains a primary catalyst, driven by advancements in display technologies, integrated smart features, and enhanced user interfaces. The regulatory landscape is evolving, with a growing emphasis on data privacy and content accessibility standards influencing product development and market entry strategies. Substitute products, such as smart displays and streaming dongles, present a competitive challenge, necessitating continuous innovation in smart TV functionalities to maintain market dominance. End-user profiles are diversifying, encompassing both the Home segment, driven by demand for immersive entertainment and smart home integration, and the Commercial segment, seeking advanced digital signage and interactive display solutions. Mergers and Acquisitions (M&A) activities, while not yet at a billion-dollar scale for individual deals, are strategic, focusing on acquiring technological capabilities or expanding market reach. The total M&A deal value is estimated at $500 million. Market share distribution is dynamic, with premium segments like OLED experiencing rapid growth alongside the enduring popularity of LED displays.
Smart Tv Terminal Industry Evolution
The Smart TV Terminal industry has undergone a dramatic evolution since its nascent stages in the historical period of 2019–2024, and this trajectory is projected to accelerate through the forecast period of 2025–2033. During the study period of 2019–2033, the market has witnessed a significant shift from basic television functionality to sophisticated connected entertainment hubs. The base year of 2025 serves as a crucial benchmark, with an estimated market value of $XX billion. Growth has been consistently robust, driven by an increasing consumer appetite for high-definition content, seamless internet connectivity, and intuitive smart features. Technological advancements have been relentless, with innovations in display resolution (4K and 8K adoption reaching over 60% by 2025), refresh rates (averaging 120Hz in premium models), and processing power enabling smoother operation of smart applications and gaming. The proliferation of streaming services has been a monumental growth driver, with over 90% of households in developed markets expected to subscribe to at least one streaming platform by 2025. Furthermore, the integration of Artificial Intelligence (AI) and Machine Learning (ML) is transforming the user experience, offering personalized content recommendations, voice control capabilities, and enhanced energy efficiency. The estimated year of 2025 anticipates a market value of $XX billion, a testament to the industry's dynamism. Consumer demands have shifted from mere passive viewing to interactive engagement, with a growing preference for smart TVs that can act as central control points for smart home devices, facilitate video conferencing, and support advanced gaming experiences. This evolving demand has pushed manufacturers to invest heavily in user interface design, app ecosystems, and cross-platform compatibility. The penetration of smart TVs in global households is projected to surpass 75% by 2025, indicating a mature yet still expanding market. The continuous push for thinner bezels, higher brightness levels (peaking at over 1500 nits for HDR content), and more energy-efficient panel technologies, such as quantum dot and micro-LED, are further shaping the industry's future. The forecast period of 2025–2033 is expected to witness an average annual growth rate of approximately 8.5%, fueled by emerging markets and continued technological innovation.
Leading Regions, Countries, or Segments in Smart Tv Terminal
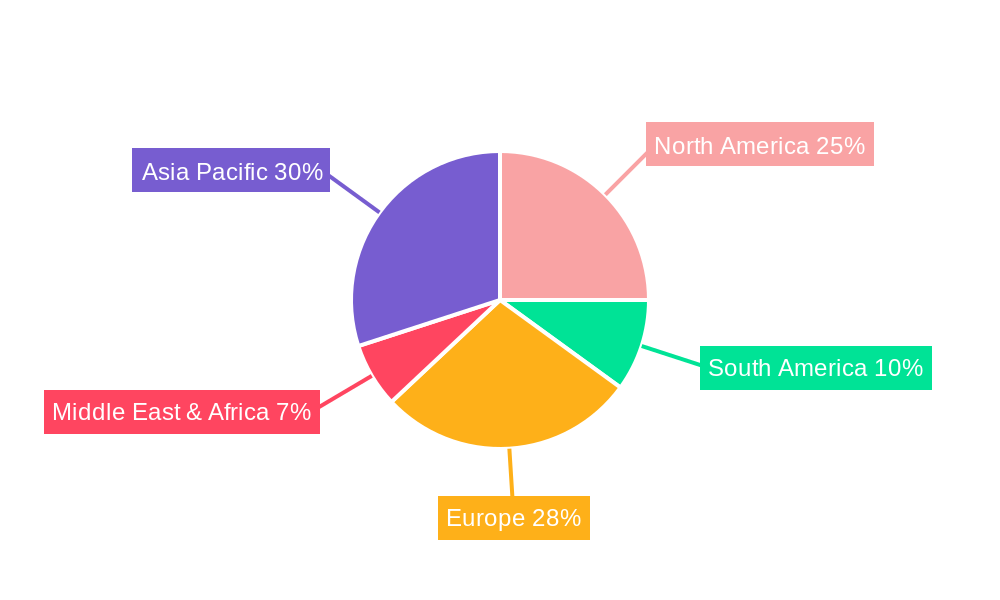
Within the global Smart TV Terminal market, North America and Asia Pacific are emerging as the leading regions, showcasing remarkable growth and adoption rates across both the Home and Commercial application segments. In the Home segment, the ubiquitous adoption of smart TVs as the primary entertainment hub continues to drive demand. Factors such as increasing disposable incomes, a burgeoning middle class, and a strong preference for high-quality viewing experiences are fueling this growth. By 2025, it is estimated that over 85% of households in North America will own at least one smart TV, with Asia Pacific following closely at 70%. The Commercial segment is also experiencing significant expansion, driven by businesses seeking advanced digital signage solutions for retail, hospitality, and corporate environments. The demand for interactive displays, real-time content updates, and integration with business intelligence platforms are key drivers. Regulatory support in the form of digital transformation initiatives in several Asian countries is further bolstering this segment.
The Type of smart TV technology is also a critical determinant of market leadership. LED displays, due to their cost-effectiveness and widespread availability, continue to hold a dominant market share, particularly in the mid-range and budget segments. However, OLED technology is rapidly gaining traction, especially in premium markets, owing to its superior picture quality, perfect blacks, and faster response times. By 2025, the OLED market share is projected to reach approximately 20% of the total smart TV market value, with a projected growth rate of over 15% annually. Key drivers for OLED adoption include a growing consumer appreciation for cinematic viewing experiences and the increasing availability of HDR content that truly showcases OLED's capabilities. Investment trends in R&D for next-generation display technologies further solidify the dominance of these segments. For instance, significant investments are being channeled into improving the longevity and reducing the cost of OLED panels, making them more accessible to a wider consumer base. Regulatory frameworks promoting energy efficiency standards are also influencing the market, favoring technologies that offer better power consumption.
Smart Tv Terminal Product Innovations
Product innovation in the Smart TV Terminal market is rapidly evolving, driven by a quest for enhanced user experience and immersive entertainment. Manufacturers are introducing 8K resolution displays with unparalleled clarity, surpassing 33 million pixels, offering a truly lifelike viewing experience. Advancements in Quantum Dot OLED (QD-OLED) technology are merging the benefits of OLED's perfect blacks with Quantum Dot's superior color volume and brightness, achieving over 1,000 nits peak brightness. Smart features are becoming more intelligent, with AI-powered upscaling that intelligently enhances lower-resolution content and sophisticated voice control systems that can manage not only TV functions but also integrate with entire smart home ecosystems, supporting over 50 million connected devices. Furthermore, the integration of Variable Refresh Rate (VRR) technology, boasting refresh rates up to 144Hz, is transforming the gaming experience for console and PC gamers, ensuring smoother gameplay and reduced motion blur.
Propelling Factors for Smart Tv Terminal Growth
The Smart TV Terminal market is propelled by several key factors. The increasing penetration of high-speed internet worldwide, with average download speeds now exceeding 100 Mbps in developed regions, enables seamless streaming of 4K and 8K content, driving demand for compatible smart TVs. Growing consumer disposable income and a rising preference for premium home entertainment experiences contribute significantly. The expansion of Over-The-Top (OTT) streaming services, with global subscriptions projected to reach over 2.5 billion by 2025, creates a continuous need for smart TVs capable of delivering these services efficiently. Furthermore, technological advancements in display technologies like OLED and Mini-LED, offering superior picture quality, and the integration of AI for personalized user experiences, are major growth catalysts. The increasing adoption of smart home ecosystems, where the smart TV acts as a central hub, further fuels demand.
Obstacles in the Smart Tv Terminal Market
Despite robust growth, the Smart TV Terminal market faces several obstacles. High manufacturing costs associated with advanced display technologies like OLED and Mini-LED can limit affordability for a significant portion of the consumer base, leading to a slower adoption rate in price-sensitive markets. Fragmented app ecosystems and compatibility issues between different platforms can create a frustrating user experience. Increasing concerns over data privacy and security related to connected devices also pose a challenge, potentially leading to consumer reluctance to embrace fully integrated smart functionalities. Supply chain disruptions, as witnessed in recent years, can lead to production delays and increased component costs, impacting product availability and pricing. Furthermore, intense competition from established players and emerging brands can lead to price wars and reduced profit margins.
Future Opportunities in Smart Tv Terminal
Emerging opportunities in the Smart TV Terminal market are substantial. The expansion into emerging economies, where smart TV penetration is still relatively low but growing rapidly, presents a significant untapped market. The development of next-generation display technologies, such as micro-LED and rollable screens, offers potential for premium product differentiation and higher profit margins. The increasing demand for interactive and immersive content, including AR/VR integration and advanced gaming experiences, opens new avenues for innovation and revenue generation. Furthermore, the growth of the B2B market, with increasing demand for smart displays in commercial settings like retail, education, and healthcare, offers substantial growth potential. The integration of more sophisticated AI capabilities, enabling advanced personalization, predictive content delivery, and seamless integration with other smart devices, will further enhance user value and drive adoption.
Major Players in the Smart Tv Terminal Ecosystem
- Samsung
- LG
- TCL
- Sony
- Hisense
- Xiaomi
- Philips+AOC
- Skyworth
- Sharp
- Vizio
- Changhong
Key Developments in Smart Tv Terminal Industry
- 2024/Q1: Introduction of new OLED TV models with enhanced brightness and wider color gamuts, aiming for over 1,200 nits peak brightness.
- 2024/Q2: Significant advancements in AI-powered upscaling technology, enabling near-native 4K upscaling from HD content with an estimated 95% accuracy.
- 2024/Q3: Launch of new gaming-focused smart TVs with integrated cloud gaming services and up to 144Hz VRR support.
- 2024/Q4: Increased focus on sustainable manufacturing practices and energy-efficient designs, with new models achieving Energy Star ratings above 90%.
- 2025/Q1: Anticipated release of the first commercially available Micro-LED TVs for consumer markets, offering unprecedented brightness and contrast ratios.
- 2025/Q2: Further integration of Matter standards, allowing seamless interoperability with a wider range of smart home devices.
- 2025/Q3: Emergence of smart TVs with built-in telemedicine capabilities and enhanced privacy features for healthcare applications.
- 2025/Q4: Increased consolidation through strategic partnerships aimed at expanding content libraries and optimizing user interfaces.
- 2026/Q1: Rollout of advanced voice assistants with improved natural language processing and context awareness, supporting over 100 million voice commands annually.
- 2026/Q2: Introduction of smart TV interfaces designed for enhanced accessibility, catering to users with visual or auditory impairments.
Strategic Smart Tv Terminal Market Forecast
The strategic Smart TV Terminal market forecast indicates sustained and robust growth, primarily driven by continued technological innovation and evolving consumer preferences. The increasing adoption of higher resolutions like 8K, alongside the burgeoning popularity of OLED and emerging display technologies, will fuel premium segment expansion. The seamless integration of AI for personalized user experiences, coupled with the expansion of smart home ecosystems where the smart TV acts as a central control hub, presents significant growth opportunities. Furthermore, the expanding global reach of streaming services and the increasing demand for interactive content will continue to solidify the smart TV's position as the primary entertainment device in households worldwide. The forecast anticipates a market value projected to reach $XX billion by 2033, with an average annual growth rate of approximately 8.5%.
Smart Tv Terminal Segmentation
-
1. Application
- 1.1. Home
- 1.2. Commercial
-
2. Type
- 2.1. LED
- 2.2. OLED
Smart Tv Terminal Segmentation By Geography
-
1. North America
- 1.1. United States
- 1.2. Canada
- 1.3. Mexico
-
2. South America
- 2.1. Brazil
- 2.2. Argentina
- 2.3. Rest of South America
-
3. Europe
- 3.1. United Kingdom
- 3.2. Germany
- 3.3. France
- 3.4. Italy
- 3.5. Spain
- 3.6. Russia
- 3.7. Benelux
- 3.8. Nordics
- 3.9. Rest of Europe
-
4. Middle East & Africa
- 4.1. Turkey
- 4.2. Israel
- 4.3. GCC
- 4.4. North Africa
- 4.5. South Africa
- 4.6. Rest of Middle East & Africa
-
5. Asia Pacific
- 5.1. China
- 5.2. India
- 5.3. Japan
- 5.4. South Korea
- 5.5. ASEAN
- 5.6. Oceania
- 5.7. Rest of Asia Pacific
Smart Tv Terminal Regional Market Share
Geographic Coverage of Smart Tv Terminal
Smart Tv Terminal REPORT HIGHLIGHTS
| Aspects | Details |
|---|---|
| Study Period | 2020-2034 |
| Base Year | 2025 |
| Estimated Year | 2026 |
| Forecast Period | 2026-2034 |
| Historical Period | 2020-2025 |
| Growth Rate | CAGR of 11.5% from 2020-2034 |
| Segmentation |
|
Table of Contents
- 1. Introduction
- 1.1. Research Scope
- 1.2. Market Segmentation
- 1.3. Research Objective
- 1.4. Definitions and Assumptions
- 2. Executive Summary
- 2.1. Market Snapshot
- 3. Market Dynamics
- 3.1. Market Drivers
- 3.2. Market Restrains
- 3.3. Market Trends
- 3.4. Market Opportunities
- 4. Market Factor Analysis
- 4.1. Porters Five Forces
- 4.1.1. Bargaining Power of Suppliers
- 4.1.2. Bargaining Power of Buyers
- 4.1.3. Threat of New Entrants
- 4.1.4. Threat of Substitutes
- 4.1.5. Competitive Rivalry
- 4.2. PESTEL analysis
- 4.3. BCG Analysis
- 4.3.1. Stars (High Growth, High Market Share)
- 4.3.2. Cash Cows (Low Growth, High Market Share)
- 4.3.3. Question Mark (High Growth, Low Market Share)
- 4.3.4. Dogs (Low Growth, Low Market Share)
- 4.4. Ansoff Matrix Analysis
- 4.5. Supply Chain Analysis
- 4.6. Regulatory Landscape
- 4.7. Current Market Potential and Opportunity Assessment (TAM–SAM–SOM Framework)
- 4.8. DMV Analyst Note
- 4.1. Porters Five Forces
- 5. Market Analysis, Insights and Forecast 2021-2033
- 5.1. Market Analysis, Insights and Forecast - by Application
- 5.1.1. Home
- 5.1.2. Commercial
- 5.2. Market Analysis, Insights and Forecast - by Type
- 5.2.1. LED
- 5.2.2. OLED
- 5.3. Market Analysis, Insights and Forecast - by Region
- 5.3.1. North America
- 5.3.2. South America
- 5.3.3. Europe
- 5.3.4. Middle East & Africa
- 5.3.5. Asia Pacific
- 5.1. Market Analysis, Insights and Forecast - by Application
- 6. Global Smart Tv Terminal Analysis, Insights and Forecast, 2021-2033
- 6.1. Market Analysis, Insights and Forecast - by Application
- 6.1.1. Home
- 6.1.2. Commercial
- 6.2. Market Analysis, Insights and Forecast - by Type
- 6.2.1. LED
- 6.2.2. OLED
- 6.1. Market Analysis, Insights and Forecast - by Application
- 7. North America Smart Tv Terminal Analysis, Insights and Forecast, 2020-2032
- 7.1. Market Analysis, Insights and Forecast - by Application
- 7.1.1. Home
- 7.1.2. Commercial
- 7.2. Market Analysis, Insights and Forecast - by Type
- 7.2.1. LED
- 7.2.2. OLED
- 7.1. Market Analysis, Insights and Forecast - by Application
- 8. South America Smart Tv Terminal Analysis, Insights and Forecast, 2020-2032
- 8.1. Market Analysis, Insights and Forecast - by Application
- 8.1.1. Home
- 8.1.2. Commercial
- 8.2. Market Analysis, Insights and Forecast - by Type
- 8.2.1. LED
- 8.2.2. OLED
- 8.1. Market Analysis, Insights and Forecast - by Application
- 9. Europe Smart Tv Terminal Analysis, Insights and Forecast, 2020-2032
- 9.1. Market Analysis, Insights and Forecast - by Application
- 9.1.1. Home
- 9.1.2. Commercial
- 9.2. Market Analysis, Insights and Forecast - by Type
- 9.2.1. LED
- 9.2.2. OLED
- 9.1. Market Analysis, Insights and Forecast - by Application
- 10. Middle East & Africa Smart Tv Terminal Analysis, Insights and Forecast, 2020-2032
- 10.1. Market Analysis, Insights and Forecast - by Application
- 10.1.1. Home
- 10.1.2. Commercial
- 10.2. Market Analysis, Insights and Forecast - by Type
- 10.2.1. LED
- 10.2.2. OLED
- 10.1. Market Analysis, Insights and Forecast - by Application
- 11. Asia Pacific Smart Tv Terminal Analysis, Insights and Forecast, 2020-2032
- 11.1. Market Analysis, Insights and Forecast - by Application
- 11.1.1. Home
- 11.1.2. Commercial
- 11.2. Market Analysis, Insights and Forecast - by Type
- 11.2.1. LED
- 11.2.2. OLED
- 11.1. Market Analysis, Insights and Forecast - by Application
- 12. Competitive Analysis
- 12.1. Company Profiles
- 12.1.1 Samsung
- 12.1.1.1. Company Overview
- 12.1.1.2. Products
- 12.1.1.3. Company Financials
- 12.1.1.4. SWOT Analysis
- 12.1.2 LG
- 12.1.2.1. Company Overview
- 12.1.2.2. Products
- 12.1.2.3. Company Financials
- 12.1.2.4. SWOT Analysis
- 12.1.3 TCL
- 12.1.3.1. Company Overview
- 12.1.3.2. Products
- 12.1.3.3. Company Financials
- 12.1.3.4. SWOT Analysis
- 12.1.4 Sony
- 12.1.4.1. Company Overview
- 12.1.4.2. Products
- 12.1.4.3. Company Financials
- 12.1.4.4. SWOT Analysis
- 12.1.5 Hisense
- 12.1.5.1. Company Overview
- 12.1.5.2. Products
- 12.1.5.3. Company Financials
- 12.1.5.4. SWOT Analysis
- 12.1.6 Xiaomi
- 12.1.6.1. Company Overview
- 12.1.6.2. Products
- 12.1.6.3. Company Financials
- 12.1.6.4. SWOT Analysis
- 12.1.7 Philips+AOC
- 12.1.7.1. Company Overview
- 12.1.7.2. Products
- 12.1.7.3. Company Financials
- 12.1.7.4. SWOT Analysis
- 12.1.8 Skyworth
- 12.1.8.1. Company Overview
- 12.1.8.2. Products
- 12.1.8.3. Company Financials
- 12.1.8.4. SWOT Analysis
- 12.1.9 Sharp
- 12.1.9.1. Company Overview
- 12.1.9.2. Products
- 12.1.9.3. Company Financials
- 12.1.9.4. SWOT Analysis
- 12.1.10 Vizio
- 12.1.10.1. Company Overview
- 12.1.10.2. Products
- 12.1.10.3. Company Financials
- 12.1.10.4. SWOT Analysis
- 12.1.11 Changhong
- 12.1.11.1. Company Overview
- 12.1.11.2. Products
- 12.1.11.3. Company Financials
- 12.1.11.4. SWOT Analysis
- 12.1.1 Samsung
- 12.2. Market Entropy
- 12.2.1 Company's Key Areas Served
- 12.2.2 Recent Developments
- 12.3. Company Market Share Analysis 2025
- 12.3.1 Top 5 Companies Market Share Analysis
- 12.3.2 Top 3 Companies Market Share Analysis
- 12.4. List of Potential Customers
- 13. Research Methodology
List of Figures
- Figure 1: Global Smart Tv Terminal Revenue Breakdown (million, %) by Region 2025 & 2033
- Figure 2: Global Smart Tv Terminal Volume Breakdown (K, %) by Region 2025 & 2033
- Figure 3: North America Smart Tv Terminal Revenue (million), by Application 2025 & 2033
- Figure 4: North America Smart Tv Terminal Volume (K), by Application 2025 & 2033
- Figure 5: North America Smart Tv Terminal Revenue Share (%), by Application 2025 & 2033
- Figure 6: North America Smart Tv Terminal Volume Share (%), by Application 2025 & 2033
- Figure 7: North America Smart Tv Terminal Revenue (million), by Type 2025 & 2033
- Figure 8: North America Smart Tv Terminal Volume (K), by Type 2025 & 2033
- Figure 9: North America Smart Tv Terminal Revenue Share (%), by Type 2025 & 2033
- Figure 10: North America Smart Tv Terminal Volume Share (%), by Type 2025 & 2033
- Figure 11: North America Smart Tv Terminal Revenue (million), by Country 2025 & 2033
- Figure 12: North America Smart Tv Terminal Volume (K), by Country 2025 & 2033
- Figure 13: North America Smart Tv Terminal Revenue Share (%), by Country 2025 & 2033
- Figure 14: North America Smart Tv Terminal Volume Share (%), by Country 2025 & 2033
- Figure 15: South America Smart Tv Terminal Revenue (million), by Application 2025 & 2033
- Figure 16: South America Smart Tv Terminal Volume (K), by Application 2025 & 2033
- Figure 17: South America Smart Tv Terminal Revenue Share (%), by Application 2025 & 2033
- Figure 18: South America Smart Tv Terminal Volume Share (%), by Application 2025 & 2033
- Figure 19: South America Smart Tv Terminal Revenue (million), by Type 2025 & 2033
- Figure 20: South America Smart Tv Terminal Volume (K), by Type 2025 & 2033
- Figure 21: South America Smart Tv Terminal Revenue Share (%), by Type 2025 & 2033
- Figure 22: South America Smart Tv Terminal Volume Share (%), by Type 2025 & 2033
- Figure 23: South America Smart Tv Terminal Revenue (million), by Country 2025 & 2033
- Figure 24: South America Smart Tv Terminal Volume (K), by Country 2025 & 2033
- Figure 25: South America Smart Tv Terminal Revenue Share (%), by Country 2025 & 2033
- Figure 26: South America Smart Tv Terminal Volume Share (%), by Country 2025 & 2033
- Figure 27: Europe Smart Tv Terminal Revenue (million), by Application 2025 & 2033
- Figure 28: Europe Smart Tv Terminal Volume (K), by Application 2025 & 2033
- Figure 29: Europe Smart Tv Terminal Revenue Share (%), by Application 2025 & 2033
- Figure 30: Europe Smart Tv Terminal Volume Share (%), by Application 2025 & 2033
- Figure 31: Europe Smart Tv Terminal Revenue (million), by Type 2025 & 2033
- Figure 32: Europe Smart Tv Terminal Volume (K), by Type 2025 & 2033
- Figure 33: Europe Smart Tv Terminal Revenue Share (%), by Type 2025 & 2033
- Figure 34: Europe Smart Tv Terminal Volume Share (%), by Type 2025 & 2033
- Figure 35: Europe Smart Tv Terminal Revenue (million), by Country 2025 & 2033
- Figure 36: Europe Smart Tv Terminal Volume (K), by Country 2025 & 2033
- Figure 37: Europe Smart Tv Terminal Revenue Share (%), by Country 2025 & 2033
- Figure 38: Europe Smart Tv Terminal Volume Share (%), by Country 2025 & 2033
- Figure 39: Middle East & Africa Smart Tv Terminal Revenue (million), by Application 2025 & 2033
- Figure 40: Middle East & Africa Smart Tv Terminal Volume (K), by Application 2025 & 2033
- Figure 41: Middle East & Africa Smart Tv Terminal Revenue Share (%), by Application 2025 & 2033
- Figure 42: Middle East & Africa Smart Tv Terminal Volume Share (%), by Application 2025 & 2033
- Figure 43: Middle East & Africa Smart Tv Terminal Revenue (million), by Type 2025 & 2033
- Figure 44: Middle East & Africa Smart Tv Terminal Volume (K), by Type 2025 & 2033
- Figure 45: Middle East & Africa Smart Tv Terminal Revenue Share (%), by Type 2025 & 2033
- Figure 46: Middle East & Africa Smart Tv Terminal Volume Share (%), by Type 2025 & 2033
- Figure 47: Middle East & Africa Smart Tv Terminal Revenue (million), by Country 2025 & 2033
- Figure 48: Middle East & Africa Smart Tv Terminal Volume (K), by Country 2025 & 2033
- Figure 49: Middle East & Africa Smart Tv Terminal Revenue Share (%), by Country 2025 & 2033
- Figure 50: Middle East & Africa Smart Tv Terminal Volume Share (%), by Country 2025 & 2033
- Figure 51: Asia Pacific Smart Tv Terminal Revenue (million), by Application 2025 & 2033
- Figure 52: Asia Pacific Smart Tv Terminal Volume (K), by Application 2025 & 2033
- Figure 53: Asia Pacific Smart Tv Terminal Revenue Share (%), by Application 2025 & 2033
- Figure 54: Asia Pacific Smart Tv Terminal Volume Share (%), by Application 2025 & 2033
- Figure 55: Asia Pacific Smart Tv Terminal Revenue (million), by Type 2025 & 2033
- Figure 56: Asia Pacific Smart Tv Terminal Volume (K), by Type 2025 & 2033
- Figure 57: Asia Pacific Smart Tv Terminal Revenue Share (%), by Type 2025 & 2033
- Figure 58: Asia Pacific Smart Tv Terminal Volume Share (%), by Type 2025 & 2033
- Figure 59: Asia Pacific Smart Tv Terminal Revenue (million), by Country 2025 & 2033
- Figure 60: Asia Pacific Smart Tv Terminal Volume (K), by Country 2025 & 2033
- Figure 61: Asia Pacific Smart Tv Terminal Revenue Share (%), by Country 2025 & 2033
- Figure 62: Asia Pacific Smart Tv Terminal Volume Share (%), by Country 2025 & 2033
List of Tables
- Table 1: Global Smart Tv Terminal Revenue million Forecast, by Application 2020 & 2033
- Table 2: Global Smart Tv Terminal Volume K Forecast, by Application 2020 & 2033
- Table 3: Global Smart Tv Terminal Revenue million Forecast, by Type 2020 & 2033
- Table 4: Global Smart Tv Terminal Volume K Forecast, by Type 2020 & 2033
- Table 5: Global Smart Tv Terminal Revenue million Forecast, by Region 2020 & 2033
- Table 6: Global Smart Tv Terminal Volume K Forecast, by Region 2020 & 2033
- Table 7: Global Smart Tv Terminal Revenue million Forecast, by Application 2020 & 2033
- Table 8: Global Smart Tv Terminal Volume K Forecast, by Application 2020 & 2033
- Table 9: Global Smart Tv Terminal Revenue million Forecast, by Type 2020 & 2033
- Table 10: Global Smart Tv Terminal Volume K Forecast, by Type 2020 & 2033
- Table 11: Global Smart Tv Terminal Revenue million Forecast, by Country 2020 & 2033
- Table 12: Global Smart Tv Terminal Volume K Forecast, by Country 2020 & 2033
- Table 13: United States Smart Tv Terminal Revenue (million) Forecast, by Application 2020 & 2033
- Table 14: United States Smart Tv Terminal Volume (K) Forecast, by Application 2020 & 2033
- Table 15: Canada Smart Tv Terminal Revenue (million) Forecast, by Application 2020 & 2033
- Table 16: Canada Smart Tv Terminal Volume (K) Forecast, by Application 2020 & 2033
- Table 17: Mexico Smart Tv Terminal Revenue (million) Forecast, by Application 2020 & 2033
- Table 18: Mexico Smart Tv Terminal Volume (K) Forecast, by Application 2020 & 2033
- Table 19: Global Smart Tv Terminal Revenue million Forecast, by Application 2020 & 2033
- Table 20: Global Smart Tv Terminal Volume K Forecast, by Application 2020 & 2033
- Table 21: Global Smart Tv Terminal Revenue million Forecast, by Type 2020 & 2033
- Table 22: Global Smart Tv Terminal Volume K Forecast, by Type 2020 & 2033
- Table 23: Global Smart Tv Terminal Revenue million Forecast, by Country 2020 & 2033
- Table 24: Global Smart Tv Terminal Volume K Forecast, by Country 2020 & 2033
- Table 25: Brazil Smart Tv Terminal Revenue (million) Forecast, by Application 2020 & 2033
- Table 26: Brazil Smart Tv Terminal Volume (K) Forecast, by Application 2020 & 2033
- Table 27: Argentina Smart Tv Terminal Revenue (million) Forecast, by Application 2020 & 2033
- Table 28: Argentina Smart Tv Terminal Volume (K) Forecast, by Application 2020 & 2033
- Table 29: Rest of South America Smart Tv Terminal Revenue (million) Forecast, by Application 2020 & 2033
- Table 30: Rest of South America Smart Tv Terminal Volume (K) Forecast, by Application 2020 & 2033
- Table 31: Global Smart Tv Terminal Revenue million Forecast, by Application 2020 & 2033
- Table 32: Global Smart Tv Terminal Volume K Forecast, by Application 2020 & 2033
- Table 33: Global Smart Tv Terminal Revenue million Forecast, by Type 2020 & 2033
- Table 34: Global Smart Tv Terminal Volume K Forecast, by Type 2020 & 2033
- Table 35: Global Smart Tv Terminal Revenue million Forecast, by Country 2020 & 2033
- Table 36: Global Smart Tv Terminal Volume K Forecast, by Country 2020 & 2033
- Table 37: United Kingdom Smart Tv Terminal Revenue (million) Forecast, by Application 2020 & 2033
- Table 38: United Kingdom Smart Tv Terminal Volume (K) Forecast, by Application 2020 & 2033
- Table 39: Germany Smart Tv Terminal Revenue (million) Forecast, by Application 2020 & 2033
- Table 40: Germany Smart Tv Terminal Volume (K) Forecast, by Application 2020 & 2033
- Table 41: France Smart Tv Terminal Revenue (million) Forecast, by Application 2020 & 2033
- Table 42: France Smart Tv Terminal Volume (K) Forecast, by Application 2020 & 2033
- Table 43: Italy Smart Tv Terminal Revenue (million) Forecast, by Application 2020 & 2033
- Table 44: Italy Smart Tv Terminal Volume (K) Forecast, by Application 2020 & 2033
- Table 45: Spain Smart Tv Terminal Revenue (million) Forecast, by Application 2020 & 2033
- Table 46: Spain Smart Tv Terminal Volume (K) Forecast, by Application 2020 & 2033
- Table 47: Russia Smart Tv Terminal Revenue (million) Forecast, by Application 2020 & 2033
- Table 48: Russia Smart Tv Terminal Volume (K) Forecast, by Application 2020 & 2033
- Table 49: Benelux Smart Tv Terminal Revenue (million) Forecast, by Application 2020 & 2033
- Table 50: Benelux Smart Tv Terminal Volume (K) Forecast, by Application 2020 & 2033
- Table 51: Nordics Smart Tv Terminal Revenue (million) Forecast, by Application 2020 & 2033
- Table 52: Nordics Smart Tv Terminal Volume (K) Forecast, by Application 2020 & 2033
- Table 53: Rest of Europe Smart Tv Terminal Revenue (million) Forecast, by Application 2020 & 2033
- Table 54: Rest of Europe Smart Tv Terminal Volume (K) Forecast, by Application 2020 & 2033
- Table 55: Global Smart Tv Terminal Revenue million Forecast, by Application 2020 & 2033
- Table 56: Global Smart Tv Terminal Volume K Forecast, by Application 2020 & 2033
- Table 57: Global Smart Tv Terminal Revenue million Forecast, by Type 2020 & 2033
- Table 58: Global Smart Tv Terminal Volume K Forecast, by Type 2020 & 2033
- Table 59: Global Smart Tv Terminal Revenue million Forecast, by Country 2020 & 2033
- Table 60: Global Smart Tv Terminal Volume K Forecast, by Country 2020 & 2033
- Table 61: Turkey Smart Tv Terminal Revenue (million) Forecast, by Application 2020 & 2033
- Table 62: Turkey Smart Tv Terminal Volume (K) Forecast, by Application 2020 & 2033
- Table 63: Israel Smart Tv Terminal Revenue (million) Forecast, by Application 2020 & 2033
- Table 64: Israel Smart Tv Terminal Volume (K) Forecast, by Application 2020 & 2033
- Table 65: GCC Smart Tv Terminal Revenue (million) Forecast, by Application 2020 & 2033
- Table 66: GCC Smart Tv Terminal Volume (K) Forecast, by Application 2020 & 2033
- Table 67: North Africa Smart Tv Terminal Revenue (million) Forecast, by Application 2020 & 2033
- Table 68: North Africa Smart Tv Terminal Volume (K) Forecast, by Application 2020 & 2033
- Table 69: South Africa Smart Tv Terminal Revenue (million) Forecast, by Application 2020 & 2033
- Table 70: South Africa Smart Tv Terminal Volume (K) Forecast, by Application 2020 & 2033
- Table 71: Rest of Middle East & Africa Smart Tv Terminal Revenue (million) Forecast, by Application 2020 & 2033
- Table 72: Rest of Middle East & Africa Smart Tv Terminal Volume (K) Forecast, by Application 2020 & 2033
- Table 73: Global Smart Tv Terminal Revenue million Forecast, by Application 2020 & 2033
- Table 74: Global Smart Tv Terminal Volume K Forecast, by Application 2020 & 2033
- Table 75: Global Smart Tv Terminal Revenue million Forecast, by Type 2020 & 2033
- Table 76: Global Smart Tv Terminal Volume K Forecast, by Type 2020 & 2033
- Table 77: Global Smart Tv Terminal Revenue million Forecast, by Country 2020 & 2033
- Table 78: Global Smart Tv Terminal Volume K Forecast, by Country 2020 & 2033
- Table 79: China Smart Tv Terminal Revenue (million) Forecast, by Application 2020 & 2033
- Table 80: China Smart Tv Terminal Volume (K) Forecast, by Application 2020 & 2033
- Table 81: India Smart Tv Terminal Revenue (million) Forecast, by Application 2020 & 2033
- Table 82: India Smart Tv Terminal Volume (K) Forecast, by Application 2020 & 2033
- Table 83: Japan Smart Tv Terminal Revenue (million) Forecast, by Application 2020 & 2033
- Table 84: Japan Smart Tv Terminal Volume (K) Forecast, by Application 2020 & 2033
- Table 85: South Korea Smart Tv Terminal Revenue (million) Forecast, by Application 2020 & 2033
- Table 86: South Korea Smart Tv Terminal Volume (K) Forecast, by Application 2020 & 2033
- Table 87: ASEAN Smart Tv Terminal Revenue (million) Forecast, by Application 2020 & 2033
- Table 88: ASEAN Smart Tv Terminal Volume (K) Forecast, by Application 2020 & 2033
- Table 89: Oceania Smart Tv Terminal Revenue (million) Forecast, by Application 2020 & 2033
- Table 90: Oceania Smart Tv Terminal Volume (K) Forecast, by Application 2020 & 2033
- Table 91: Rest of Asia Pacific Smart Tv Terminal Revenue (million) Forecast, by Application 2020 & 2033
- Table 92: Rest of Asia Pacific Smart Tv Terminal Volume (K) Forecast, by Application 2020 & 2033
Frequently Asked Questions
1. What is the projected Compound Annual Growth Rate (CAGR) of the Smart Tv Terminal?
The projected CAGR is approximately 11.5%.
2. Which companies are prominent players in the Smart Tv Terminal?
Key companies in the market include Samsung, LG, TCL, Sony, Hisense, Xiaomi, Philips+AOC, Skyworth, Sharp, Vizio, Changhong.
3. What are the main segments of the Smart Tv Terminal?
The market segments include Application, Type.
4. Can you provide details about the market size?
The market size is estimated to be USD 291230 million as of 2022.
5. What are some drivers contributing to market growth?
N/A
6. What are the notable trends driving market growth?
N/A
7. Are there any restraints impacting market growth?
N/A
8. Can you provide examples of recent developments in the market?
N/A
9. What pricing options are available for accessing the report?
Pricing options include single-user, multi-user, and enterprise licenses priced at USD 3950.00, USD 5925.00, and USD 7900.00 respectively.
10. Is the market size provided in terms of value or volume?
The market size is provided in terms of value, measured in million and volume, measured in K.
11. Are there any specific market keywords associated with the report?
Yes, the market keyword associated with the report is "Smart Tv Terminal," which aids in identifying and referencing the specific market segment covered.
12. How do I determine which pricing option suits my needs best?
The pricing options vary based on user requirements and access needs. Individual users may opt for single-user licenses, while businesses requiring broader access may choose multi-user or enterprise licenses for cost-effective access to the report.
13. Are there any additional resources or data provided in the Smart Tv Terminal report?
While the report offers comprehensive insights, it's advisable to review the specific contents or supplementary materials provided to ascertain if additional resources or data are available.
14. How can I stay updated on further developments or reports in the Smart Tv Terminal?
To stay informed about further developments, trends, and reports in the Smart Tv Terminal, consider subscribing to industry newsletters, following relevant companies and organizations, or regularly checking reputable industry news sources and publications.
Methodology
Step 1 - Identification of Relevant Samples Size from Population Database


Step 2 - Approaches for Defining Global Market Size (Value, Volume* & Price*)

Note*: In applicable scenarios
Step 3 - Data Sources
Primary Research
- Web Analytics
- Survey Reports
- Research Institute
- Latest Research Reports
- Opinion Leaders
Secondary Research
- Annual Reports
- White Paper
- Latest Press Release
- Industry Association
- Paid Database
- Investor Presentations

Step 4 - Data Triangulation
Involves using different sources of information in order to increase the validity of a study
These sources are likely to be stakeholders in a program - participants, other researchers, program staff, other community members, and so on.
Then we put all data in single framework & apply various statistical tools to find out the dynamic on the market.
During the analysis stage, feedback from the stakeholder groups would be compared to determine areas of agreement as well as areas of divergence