

Key Insights for Smart Manufacturing Market
The Smart Manufacturing Market is currently valued at an impressive USD 225,390 million, demonstrating the profound impact of digital transformation across global industrial sectors. Projections indicate robust expansion, with the market expected to reach USD 579,985 million by 2033, advancing at a significant Compound Annual Growth Rate (CAGR) of 9.9% over the forecast period. This growth is primarily fueled by a confluence of factors, including the escalating demand for operational efficiency, enhanced productivity, and the imperative for resilient supply chains. Manufacturers are increasingly adopting advanced technologies such as the Industrial IoT Market, Artificial Intelligence in Manufacturing Market, and Robotics Market to optimize production processes, reduce costs, and accelerate time-to-market.

Smart Manufacturing Market Size (In Billion)
The strategic imperative for businesses to embrace Industry 4.0 paradigms continues to be a central driver. The integration of cyber-physical systems, cloud computing, and advanced analytics is transforming traditional factories into intelligent, interconnected ecosystems capable of real-time decision-making and autonomous operation. Furthermore, the rising adoption of Digital Twin Market technologies is enabling virtual simulations of manufacturing processes, products, and performance, allowing for proactive problem-solving and predictive maintenance. Geopolitical shifts and environmental concerns are also compelling industries to re-evaluate their production footprints, leading to investments in highly automated and adaptable smart manufacturing solutions. As companies seek to navigate a complex global landscape, the agility and data-driven insights offered by smart manufacturing systems are becoming indispensable, solidifying the market's trajectory towards sustained growth and widespread industrial integration.

Smart Manufacturing Company Market Share
Software Component Dominance in Smart Manufacturing Market
Within the multifaceted Smart Manufacturing Market, the Software component segment stands out as a critical enabler and often the largest contributor to revenue share. This dominance stems from the fundamental role that specialized software plays in orchestrating, managing, and optimizing every facet of smart factory operations. Unlike hardware, which provides the physical infrastructure, software delivers the intelligence, connectivity, and analytical capabilities that define smart manufacturing. Key sub-segments within this domain include Manufacturing Execution Systems (MES), Enterprise Resource Planning (ERP) integrations, Supervisory Control and Data Acquisition (SCADA) systems, Product Lifecycle Management (PLM) software, and specialized platforms for data analytics, machine learning, and artificial intelligence.
Software solutions are the backbone of the Industrial IoT Market, processing vast streams of data from connected sensors and machines to derive actionable insights. They are also instrumental in controlling the sophisticated kinematics of the Robotics Market and enabling the advanced functionalities of Artificial Intelligence in Manufacturing Market applications, from quality inspection to predictive analytics. The proliferation of the Digital Twin Market is entirely predicated on sophisticated software platforms capable of creating and maintaining virtual replicas of physical assets and processes, simulating their behavior, and predicting performance outcomes. Leading players such as SAP, Oracle, IBM, Siemens, ABB, Schneider Electric, and Rockwell Automation are continually investing in R&D to enhance their Industrial Software Market portfolios, offering integrated suites that bridge IT (Information Technology) and OT (Operational Technology) domains. The increasing trend towards cloud-based software as a service (SaaS) models further solidifies this segment's growth, offering scalability, flexibility, and reduced upfront investment for manufacturers. This continuous evolution and central role in system integration ensure the Software component segment's sustained prominence in the Smart Manufacturing Market.
Key Market Drivers for Smart Manufacturing Market
The growth trajectory of the Smart Manufacturing Market is underpinned by several powerful drivers, each substantiated by current industry trends and metrics:
Accelerated Adoption of Industry 4.0 and Digital Transformation Initiatives: The global manufacturing sector is undergoing an unprecedented digital overhaul, driven by the imperative to remain competitive and innovative. This is evident in the projected surge of Industrial IoT Market device deployments, anticipated to connect billions of operational endpoints worldwide by 2030. This extensive connectivity forms the bedrock for data-driven decision-making, enabling real-time monitoring, control, and optimization across production lines. The integration of advanced analytics and cloud computing further enhances this capability, leading to smarter, more autonomous factories.
Relentless Pursuit of Operational Efficiency and Cost Reduction: Manufacturers are under constant pressure to optimize production costs and improve efficiency amidst rising labor expenses and global competition. The integration of advanced automation technologies, particularly from the Robotics Market, offers a clear path to achieving these goals. Industry analyses consistently demonstrate that the deployment of robotics and intelligent automation solutions can lead to average efficiency gains of 10-15% in specific manufacturing processes, alongside significant reductions in operational expenditure and waste. These systems minimize human error, operate 24/7, and can handle repetitive or hazardous tasks with precision, directly impacting the bottom line.
Enhancing Supply Chain Resilience and Transparency: Recent global disruptions have underscored the vulnerability of traditional supply chains, prompting a strategic shift towards greater visibility and resilience. Approximately 70% of global manufacturers have reported prioritizing end-to-end supply chain visibility and agility since 2020. This has fueled the adoption of Digital Twin Market technologies, which provide comprehensive virtual models of the entire supply chain, enabling predictive risk assessment, optimized logistics, and proactive mitigation strategies. Such integrated systems allow manufacturers to simulate various scenarios, identify bottlenecks, and make informed decisions to ensure continuity and responsiveness, ultimately strengthening the entire value chain within the Smart Manufacturing Market.
Competitive Ecosystem of Smart Manufacturing Market
The Smart Manufacturing Market is characterized by a dynamic and highly competitive landscape, featuring a diverse array of technology providers, industrial automation specialists, and software developers. Key players consistently innovate to offer integrated solutions that address the complex demands of modern manufacturing.
- GE: A multinational conglomerate with a significant presence in industrial automation and digital solutions, offering a comprehensive suite of software and hardware for smart factories.
- ABB: A global technology company specializing in robotics, power, heavy electrical equipment, and automation, providing advanced solutions for industrial efficiency and productivity.
- Siemens: A leading technology powerhouse with extensive offerings in electrification, automation, and digitalization, renowned for its integrated software and hardware platforms for industrial applications.
- SAP: A global leader in enterprise software, providing advanced solutions for enterprise resource planning (ERP), supply chain management, and manufacturing operations management.
- Schneider: A multinational corporation focused on energy management and industrial automation, offering connected technologies and solutions to manage energy and process in a safe, reliable, efficient, and sustainable manner.
- Emerson: A global technology and engineering company providing innovative solutions for customers in industrial, commercial, and residential markets, with a strong focus on process automation.
- Oracle: A multinational computer technology corporation specializing in database software, cloud engineered systems, and enterprise software products, critical for data management in smart factories.
- IBM: A leading global technology and consulting company, offering a broad portfolio of enterprise solutions including AI, cloud computing, and services tailored for industrial digitalization.
- Honeywell: A diversified technology and manufacturing company providing industry-specific solutions that include aerospace products and services, control technologies for buildings and industry, and performance materials.
- Cisco: A global leader in networking hardware, telecommunications equipment, and other high-technology services and products, crucial for secure and reliable industrial network infrastructure.
- Rockwell: A global leader in industrial automation and digital transformation, specializing in control systems, industrial software, and information solutions.
- Yokogawa: A major provider of industrial automation and control solutions, including test and measurement, process control, and information systems for diverse industries.
- Fanuc: A leading global manufacturer of factory automation products, including robots, CNC systems, and Robomachines, playing a pivotal role in the Robotics Market.
- NVIDIA: A leading designer of graphics processing units (GPUs) for the gaming and professional markets, as well as chip units (SoCs) for the mobile computing and automotive markets, increasingly vital for AI and simulation in manufacturing.
- Keyence: A direct sales organization that develops and manufactures automation sensors, vision systems, barcode readers, laser markers, measuring instruments, and digital microscopes.
- Cognex: A leading provider of machine vision systems, software, and sensors used in automated manufacturing to inspect, identify, and guide parts, enhancing quality control and efficiency.
- Stratatys: A leading manufacturer of 3D printers and 3D production systems for personal use, rapid prototyping, and direct digital manufacturing, contributing to the Additive Manufacturing Market.
- 3D Systems: A pioneer and leader in the Additive Manufacturing Market, offering 3D printers, print materials, software, and on-demand manufacturing services for various industrial applications.
- Daifuku: A global leader in material handling systems, providing innovative solutions for automated storage and retrieval systems, conveyors, and sortation equipment for smart warehouses and factories.
Recent Developments & Milestones in Smart Manufacturing Market
The Smart Manufacturing Market is continually evolving, driven by rapid technological advancements and strategic collaborations aimed at enhancing industrial efficiency and connectivity.
- November 2024: A consortium of leading Industrial Automation Market providers and research institutions announced a new open standard for interoperability in factory automation, aiming to streamline data exchange between diverse machinery and software platforms.
- September 2024: Major automotive manufacturers unveiled plans for their first fully autonomous smart factory in North America, integrating advanced Robotics Market and Artificial Intelligence in Manufacturing Market solutions to achieve a 25% increase in production efficiency by 2027.
- June 2024: A prominent industrial software vendor launched an AI-powered predictive maintenance platform, leveraging Industrial IoT Market data to prevent equipment failures and reduce downtime by up to 30% for early adopters.
- April 2024: Governments in several Asia Pacific nations initiated new funding programs totaling USD 1.5 billion to support SMEs in adopting smart manufacturing technologies, focusing on cloud solutions and Industrial Software Market deployment.
- February 2024: Significant advancements were reported in the Additive Manufacturing Market, with new material breakthroughs enabling the 3D printing of high-performance components for aerospace and medical applications with enhanced durability and lightweight properties.
- January 2024: A multinational technology firm announced the successful deployment of a large-scale Digital Twin Market project for a chemical processing plant, resulting in a 15% improvement in operational safety and a 10% reduction in energy consumption within the first year.
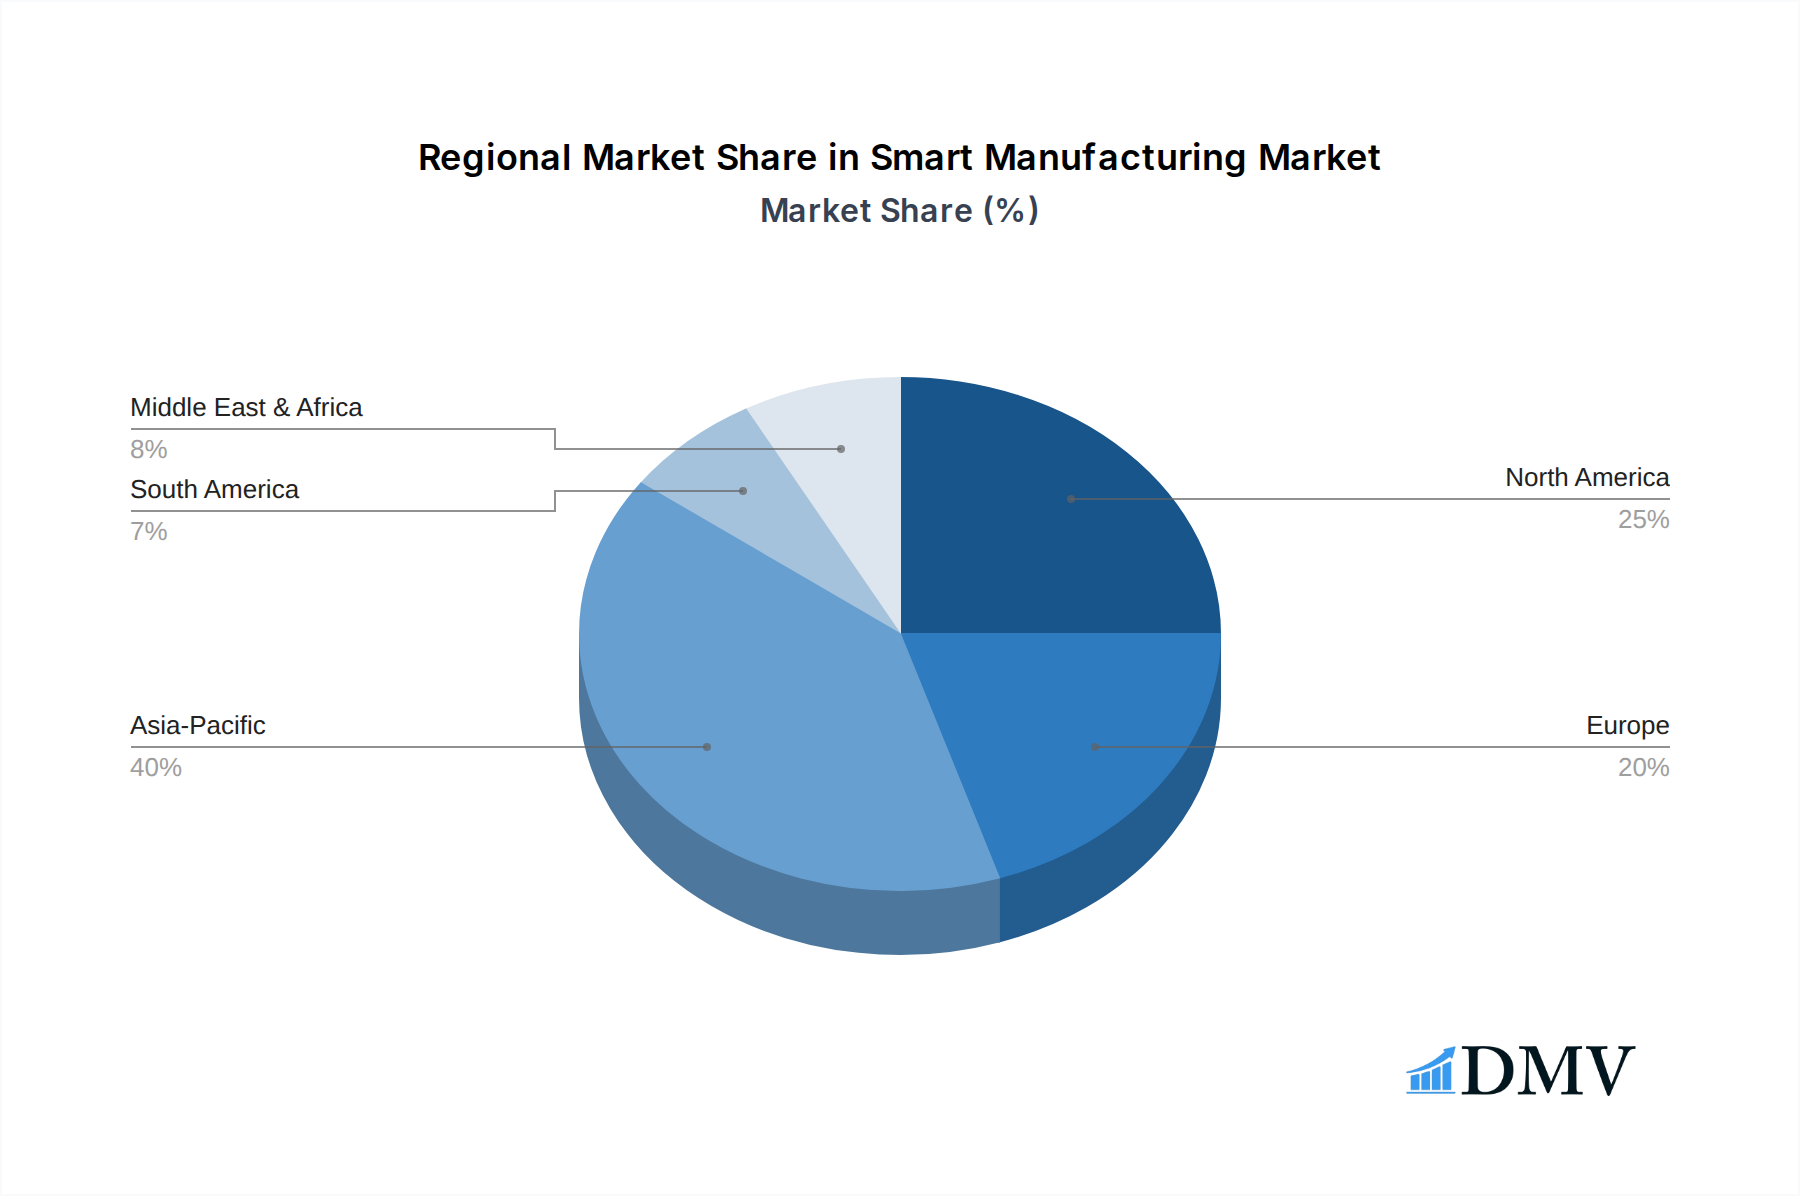
Regional Market Breakdown for Smart Manufacturing Market
The Smart Manufacturing Market exhibits distinct growth patterns and adoption rates across various global regions, reflecting diverse economic conditions, industrial maturity, and policy frameworks.
Asia Pacific currently stands as the fastest-growing region in the Smart Manufacturing Market. Countries like China, India, Japan, and South Korea are at the forefront, driven by extensive government initiatives to modernize manufacturing, rapid industrialization, and substantial investments in new factory infrastructure. The region benefits from a large and expanding manufacturing base across sectors such as Electronics & Semiconductors and Automotive Manufacturing Market. The imperative for digital transformation to improve competitiveness and meet escalating global demand fuels the widespread adoption of the Industrial IoT Market and advanced Industrial Automation Market solutions. This region is projected to maintain a higher-than-average CAGR, capitalizing on its dynamic economic growth and technological absorption capacity.
North America represents a mature yet highly innovative market. The United States and Canada are characterized by high adoption rates of advanced smart manufacturing technologies, particularly in sectors requiring high precision and customization, such as Aerospace & Defense and Pharmaceuticals & Biotechnology. Key drivers include a strong focus on advanced analytics, Artificial Intelligence in Manufacturing Market, and the integration of sophisticated Robotics Market to combat labor shortages and enhance production quality. Government support for reshoring initiatives and investment in research and development further solidifies the region's prominent market share.
Europe demonstrates robust growth, propelled by strong regulatory frameworks, a persistent focus on sustainability, and the "Industry 5.0" vision which emphasizes human-centricity and resilience alongside efficiency. Germany, with its "Plattform Industrie 4.0" initiative, remains a leader in technology adoption, particularly in the machinery and industrial equipment sectors. The region's established industrial base and commitment to integrating advanced Industrial Software Market for optimizing complex supply chains contribute significantly to market expansion.
Middle East & Africa (MEA) is an emerging region within the Smart Manufacturing Market, exhibiting significant potential for growth. Countries like Saudi Arabia and the UAE are investing heavily in economic diversification plans, which include establishing advanced manufacturing hubs and integrating smart technologies. While starting from a lower base, the region is witnessing increased adoption in sectors such as Chemicals & Petrochemicals and Energy & Power, driven by strategic national visions to develop local industrial capabilities and reduce reliance on oil.
Smart Manufacturing Regional Market Share
Regulatory & Policy Landscape Shaping Smart Manufacturing Market
The Smart Manufacturing Market operates within an increasingly complex web of regulations, standards, and governmental policies designed to ensure interoperability, security, safety, and ethical implementation of advanced technologies. International standards bodies such as the International Organization for Standardization (ISO) and the International Electrotechnical Commission (IEC) establish critical benchmarks. For instance, ISO 9001 for quality management systems and IEC 62443 for industrial cybersecurity are widely adopted, setting foundational requirements for smart factory operations. Interoperability standards like OPC Unified Architecture (OPC UA) are crucial for seamless data exchange between diverse machines and software platforms, fostering ecosystem integration. Governments globally are actively shaping this landscape.
In Europe, the "Industry 5.0" strategy is emerging, building on Industry 4.0 by emphasizing human-centricity, sustainability, and resilience. This policy direction influences product design, manufacturing processes, and labor practices, encouraging the development of collaborative robotics and energy-efficient systems. The General Data Protection Regulation (GDPR) also has significant implications for how industrial data, including personal data of employees, is collected, processed, and stored within smart manufacturing environments. In North America, initiatives like the National Institute of Standards and Technology (NIST)'s Manufacturing USA institutes promote research, development, and adoption of advanced manufacturing technologies, fostering public-private partnerships. Asian economies, particularly China, have utilized strategic industrial policies, such as the now-rebranded but influential "Made in China 2025" vision, to accelerate domestic smart manufacturing capabilities. These policies often include incentives for R&D, subsidies for technology adoption, and stringent local content requirements. The cumulative impact of these regulations and policies is to standardize practices, enhance cybersecurity, ensure ethical AI deployment, and create a level playing field, while also potentially posing compliance challenges and market entry barriers for new players in the Smart Manufacturing Market.
Supply Chain & Raw Material Dynamics for Smart Manufacturing Market
The robustness and resilience of the Smart Manufacturing Market are intrinsically linked to its complex supply chain and the availability of critical raw materials. Upstream dependencies are significant, particularly for high-tech components that form the core of smart factory infrastructure. Semiconductor chips, for instance, are indispensable for virtually every aspect of smart manufacturing, from programmable logic controllers (PLCs) and edge devices to sophisticated Industrial Sensors Market and Artificial Intelligence in Manufacturing Market processors. These chips are manufactured in a highly concentrated global supply chain, making the market vulnerable to geopolitical tensions, trade disputes, and natural disasters, as evidenced by recent global chip shortages.
Furthermore, the production of advanced Robotics Market relies on specialized metals and alloys, including rare earth elements for permanent magnets in motors, which often have concentrated mining and processing locations. The burgeoning Additive Manufacturing Market depends on a steady supply of high-quality industrial polymers, metal powders (e.g., titanium, aluminum, stainless steel), and ceramic materials, whose prices and availability can fluctuate based on global demand and geopolitical stability. Key inputs for the Industrial Software Market, while less tangible, include highly skilled labor and access to robust computing infrastructure, often requiring specific rare earths for server components.
Price volatility for these critical inputs, coupled with escalating energy costs, can significantly impact manufacturing overheads and product lead times. Disruptions in the supply of even a single component can halt entire production lines, underscoring the need for advanced supply chain management solutions. Manufacturers are increasingly leveraging Digital Twin Market technology and sophisticated Industrial Software Market platforms to gain real-time visibility into their supply chains, mitigate risks, and diversify sourcing strategies to build greater resilience against future shocks in the Smart Manufacturing Market.
Smart Manufacturing Segmentation
-
1. Component
- 1.1. Hardware
- 1.2. Software
- 1.3. Services
-
2. Manufacturing Process
- 2.1. Discrete Manufacturing
- 2.2. Process Manufacturing
- 2.3. Hybrid Manufacturing
-
3. Enterprise Size
- 3.1. Large Enterprises
- 3.2. Small & Medium Enterprises (SMEs)
-
4. End User Industry
- 4.1. Automotive
- 4.2. Electronics & Semiconductors
- 4.3. Machinery & Industrial Equipment
- 4.4. Aerospace & Defense
- 4.5. Chemicals & Petrochemicals
- 4.6. Pharmaceuticals & Biotechnology
- 4.7. Food & Beverage
- 4.8. Metals & Mining
- 4.9. Energy & Power
- 4.10. Textiles & Apparel
- 4.11. Consumer Goods
- 4.12. Others
Smart Manufacturing Segmentation By Geography
-
1. North America
- 1.1. United States
- 1.2. Canada
- 1.3. Mexico
-
2. South America
- 2.1. Brazil
- 2.2. Argentina
- 2.3. Rest of South America
-
3. Europe
- 3.1. United Kingdom
- 3.2. Germany
- 3.3. France
- 3.4. Italy
- 3.5. Spain
- 3.6. Russia
- 3.7. Benelux
- 3.8. Nordics
- 3.9. Rest of Europe
-
4. Middle East & Africa
- 4.1. Turkey
- 4.2. Israel
- 4.3. GCC
- 4.4. North Africa
- 4.5. South Africa
- 4.6. Rest of Middle East & Africa
-
5. Asia Pacific
- 5.1. China
- 5.2. India
- 5.3. Japan
- 5.4. South Korea
- 5.5. ASEAN
- 5.6. Oceania
- 5.7. Rest of Asia Pacific
Smart Manufacturing Regional Market Share
Geographic Coverage of Smart Manufacturing
Smart Manufacturing REPORT HIGHLIGHTS
| Aspects | Details |
|---|---|
| Study Period | 2020-2034 |
| Base Year | 2025 |
| Estimated Year | 2026 |
| Forecast Period | 2026-2034 |
| Historical Period | 2020-2025 |
| Growth Rate | CAGR of 9.9% from 2020-2034 |
| Segmentation |
|
Table of Contents
- 1. Introduction
- 1.1. Research Scope
- 1.2. Market Segmentation
- 1.3. Research Objective
- 1.4. Definitions and Assumptions
- 2. Executive Summary
- 2.1. Market Snapshot
- 3. Market Dynamics
- 3.1. Market Drivers
- 3.2. Market Restrains
- 3.3. Market Trends
- 3.4. Market Opportunities
- 4. Market Factor Analysis
- 4.1. Porters Five Forces
- 4.1.1. Bargaining Power of Suppliers
- 4.1.2. Bargaining Power of Buyers
- 4.1.3. Threat of New Entrants
- 4.1.4. Threat of Substitutes
- 4.1.5. Competitive Rivalry
- 4.2. PESTEL analysis
- 4.3. BCG Analysis
- 4.3.1. Stars (High Growth, High Market Share)
- 4.3.2. Cash Cows (Low Growth, High Market Share)
- 4.3.3. Question Mark (High Growth, Low Market Share)
- 4.3.4. Dogs (Low Growth, Low Market Share)
- 4.4. Ansoff Matrix Analysis
- 4.5. Supply Chain Analysis
- 4.6. Regulatory Landscape
- 4.7. Current Market Potential and Opportunity Assessment (TAM–SAM–SOM Framework)
- 4.8. DMV Analyst Note
- 4.1. Porters Five Forces
- 5. Market Analysis, Insights and Forecast 2021-2033
- 5.1. Market Analysis, Insights and Forecast - by Component
- 5.1.1. Hardware
- 5.1.2. Software
- 5.1.3. Services
- 5.2. Market Analysis, Insights and Forecast - by Manufacturing Process
- 5.2.1. Discrete Manufacturing
- 5.2.2. Process Manufacturing
- 5.2.3. Hybrid Manufacturing
- 5.3. Market Analysis, Insights and Forecast - by Enterprise Size
- 5.3.1. Large Enterprises
- 5.3.2. Small & Medium Enterprises (SMEs)
- 5.4. Market Analysis, Insights and Forecast - by End User Industry
- 5.4.1. Automotive
- 5.4.2. Electronics & Semiconductors
- 5.4.3. Machinery & Industrial Equipment
- 5.4.4. Aerospace & Defense
- 5.4.5. Chemicals & Petrochemicals
- 5.4.6. Pharmaceuticals & Biotechnology
- 5.4.7. Food & Beverage
- 5.4.8. Metals & Mining
- 5.4.9. Energy & Power
- 5.4.10. Textiles & Apparel
- 5.4.11. Consumer Goods
- 5.4.12. Others
- 5.5. Market Analysis, Insights and Forecast - by Region
- 5.5.1. North America
- 5.5.2. South America
- 5.5.3. Europe
- 5.5.4. Middle East & Africa
- 5.5.5. Asia Pacific
- 5.1. Market Analysis, Insights and Forecast - by Component
- 6. Global Smart Manufacturing Analysis, Insights and Forecast, 2021-2033
- 6.1. Market Analysis, Insights and Forecast - by Component
- 6.1.1. Hardware
- 6.1.2. Software
- 6.1.3. Services
- 6.2. Market Analysis, Insights and Forecast - by Manufacturing Process
- 6.2.1. Discrete Manufacturing
- 6.2.2. Process Manufacturing
- 6.2.3. Hybrid Manufacturing
- 6.3. Market Analysis, Insights and Forecast - by Enterprise Size
- 6.3.1. Large Enterprises
- 6.3.2. Small & Medium Enterprises (SMEs)
- 6.4. Market Analysis, Insights and Forecast - by End User Industry
- 6.4.1. Automotive
- 6.4.2. Electronics & Semiconductors
- 6.4.3. Machinery & Industrial Equipment
- 6.4.4. Aerospace & Defense
- 6.4.5. Chemicals & Petrochemicals
- 6.4.6. Pharmaceuticals & Biotechnology
- 6.4.7. Food & Beverage
- 6.4.8. Metals & Mining
- 6.4.9. Energy & Power
- 6.4.10. Textiles & Apparel
- 6.4.11. Consumer Goods
- 6.4.12. Others
- 6.1. Market Analysis, Insights and Forecast - by Component
- 7. North America Smart Manufacturing Analysis, Insights and Forecast, 2020-2032
- 7.1. Market Analysis, Insights and Forecast - by Component
- 7.1.1. Hardware
- 7.1.2. Software
- 7.1.3. Services
- 7.2. Market Analysis, Insights and Forecast - by Manufacturing Process
- 7.2.1. Discrete Manufacturing
- 7.2.2. Process Manufacturing
- 7.2.3. Hybrid Manufacturing
- 7.3. Market Analysis, Insights and Forecast - by Enterprise Size
- 7.3.1. Large Enterprises
- 7.3.2. Small & Medium Enterprises (SMEs)
- 7.4. Market Analysis, Insights and Forecast - by End User Industry
- 7.4.1. Automotive
- 7.4.2. Electronics & Semiconductors
- 7.4.3. Machinery & Industrial Equipment
- 7.4.4. Aerospace & Defense
- 7.4.5. Chemicals & Petrochemicals
- 7.4.6. Pharmaceuticals & Biotechnology
- 7.4.7. Food & Beverage
- 7.4.8. Metals & Mining
- 7.4.9. Energy & Power
- 7.4.10. Textiles & Apparel
- 7.4.11. Consumer Goods
- 7.4.12. Others
- 7.1. Market Analysis, Insights and Forecast - by Component
- 8. South America Smart Manufacturing Analysis, Insights and Forecast, 2020-2032
- 8.1. Market Analysis, Insights and Forecast - by Component
- 8.1.1. Hardware
- 8.1.2. Software
- 8.1.3. Services
- 8.2. Market Analysis, Insights and Forecast - by Manufacturing Process
- 8.2.1. Discrete Manufacturing
- 8.2.2. Process Manufacturing
- 8.2.3. Hybrid Manufacturing
- 8.3. Market Analysis, Insights and Forecast - by Enterprise Size
- 8.3.1. Large Enterprises
- 8.3.2. Small & Medium Enterprises (SMEs)
- 8.4. Market Analysis, Insights and Forecast - by End User Industry
- 8.4.1. Automotive
- 8.4.2. Electronics & Semiconductors
- 8.4.3. Machinery & Industrial Equipment
- 8.4.4. Aerospace & Defense
- 8.4.5. Chemicals & Petrochemicals
- 8.4.6. Pharmaceuticals & Biotechnology
- 8.4.7. Food & Beverage
- 8.4.8. Metals & Mining
- 8.4.9. Energy & Power
- 8.4.10. Textiles & Apparel
- 8.4.11. Consumer Goods
- 8.4.12. Others
- 8.1. Market Analysis, Insights and Forecast - by Component
- 9. Europe Smart Manufacturing Analysis, Insights and Forecast, 2020-2032
- 9.1. Market Analysis, Insights and Forecast - by Component
- 9.1.1. Hardware
- 9.1.2. Software
- 9.1.3. Services
- 9.2. Market Analysis, Insights and Forecast - by Manufacturing Process
- 9.2.1. Discrete Manufacturing
- 9.2.2. Process Manufacturing
- 9.2.3. Hybrid Manufacturing
- 9.3. Market Analysis, Insights and Forecast - by Enterprise Size
- 9.3.1. Large Enterprises
- 9.3.2. Small & Medium Enterprises (SMEs)
- 9.4. Market Analysis, Insights and Forecast - by End User Industry
- 9.4.1. Automotive
- 9.4.2. Electronics & Semiconductors
- 9.4.3. Machinery & Industrial Equipment
- 9.4.4. Aerospace & Defense
- 9.4.5. Chemicals & Petrochemicals
- 9.4.6. Pharmaceuticals & Biotechnology
- 9.4.7. Food & Beverage
- 9.4.8. Metals & Mining
- 9.4.9. Energy & Power
- 9.4.10. Textiles & Apparel
- 9.4.11. Consumer Goods
- 9.4.12. Others
- 9.1. Market Analysis, Insights and Forecast - by Component
- 10. Middle East & Africa Smart Manufacturing Analysis, Insights and Forecast, 2020-2032
- 10.1. Market Analysis, Insights and Forecast - by Component
- 10.1.1. Hardware
- 10.1.2. Software
- 10.1.3. Services
- 10.2. Market Analysis, Insights and Forecast - by Manufacturing Process
- 10.2.1. Discrete Manufacturing
- 10.2.2. Process Manufacturing
- 10.2.3. Hybrid Manufacturing
- 10.3. Market Analysis, Insights and Forecast - by Enterprise Size
- 10.3.1. Large Enterprises
- 10.3.2. Small & Medium Enterprises (SMEs)
- 10.4. Market Analysis, Insights and Forecast - by End User Industry
- 10.4.1. Automotive
- 10.4.2. Electronics & Semiconductors
- 10.4.3. Machinery & Industrial Equipment
- 10.4.4. Aerospace & Defense
- 10.4.5. Chemicals & Petrochemicals
- 10.4.6. Pharmaceuticals & Biotechnology
- 10.4.7. Food & Beverage
- 10.4.8. Metals & Mining
- 10.4.9. Energy & Power
- 10.4.10. Textiles & Apparel
- 10.4.11. Consumer Goods
- 10.4.12. Others
- 10.1. Market Analysis, Insights and Forecast - by Component
- 11. Asia Pacific Smart Manufacturing Analysis, Insights and Forecast, 2020-2032
- 11.1. Market Analysis, Insights and Forecast - by Component
- 11.1.1. Hardware
- 11.1.2. Software
- 11.1.3. Services
- 11.2. Market Analysis, Insights and Forecast - by Manufacturing Process
- 11.2.1. Discrete Manufacturing
- 11.2.2. Process Manufacturing
- 11.2.3. Hybrid Manufacturing
- 11.3. Market Analysis, Insights and Forecast - by Enterprise Size
- 11.3.1. Large Enterprises
- 11.3.2. Small & Medium Enterprises (SMEs)
- 11.4. Market Analysis, Insights and Forecast - by End User Industry
- 11.4.1. Automotive
- 11.4.2. Electronics & Semiconductors
- 11.4.3. Machinery & Industrial Equipment
- 11.4.4. Aerospace & Defense
- 11.4.5. Chemicals & Petrochemicals
- 11.4.6. Pharmaceuticals & Biotechnology
- 11.4.7. Food & Beverage
- 11.4.8. Metals & Mining
- 11.4.9. Energy & Power
- 11.4.10. Textiles & Apparel
- 11.4.11. Consumer Goods
- 11.4.12. Others
- 11.1. Market Analysis, Insights and Forecast - by Component
- 12. Competitive Analysis
- 12.1. Company Profiles
- 12.1.1 GE
- 12.1.1.1. Company Overview
- 12.1.1.2. Products
- 12.1.1.3. Company Financials
- 12.1.1.4. SWOT Analysis
- 12.1.2 ABB
- 12.1.2.1. Company Overview
- 12.1.2.2. Products
- 12.1.2.3. Company Financials
- 12.1.2.4. SWOT Analysis
- 12.1.3 Siemens
- 12.1.3.1. Company Overview
- 12.1.3.2. Products
- 12.1.3.3. Company Financials
- 12.1.3.4. SWOT Analysis
- 12.1.4 SAP
- 12.1.4.1. Company Overview
- 12.1.4.2. Products
- 12.1.4.3. Company Financials
- 12.1.4.4. SWOT Analysis
- 12.1.5 Schneider
- 12.1.5.1. Company Overview
- 12.1.5.2. Products
- 12.1.5.3. Company Financials
- 12.1.5.4. SWOT Analysis
- 12.1.6 Emerson
- 12.1.6.1. Company Overview
- 12.1.6.2. Products
- 12.1.6.3. Company Financials
- 12.1.6.4. SWOT Analysis
- 12.1.7 Oracle
- 12.1.7.1. Company Overview
- 12.1.7.2. Products
- 12.1.7.3. Company Financials
- 12.1.7.4. SWOT Analysis
- 12.1.8 IBM
- 12.1.8.1. Company Overview
- 12.1.8.2. Products
- 12.1.8.3. Company Financials
- 12.1.8.4. SWOT Analysis
- 12.1.9 Honeywell
- 12.1.9.1. Company Overview
- 12.1.9.2. Products
- 12.1.9.3. Company Financials
- 12.1.9.4. SWOT Analysis
- 12.1.10 Cisco
- 12.1.10.1. Company Overview
- 12.1.10.2. Products
- 12.1.10.3. Company Financials
- 12.1.10.4. SWOT Analysis
- 12.1.11 Rockwell
- 12.1.11.1. Company Overview
- 12.1.11.2. Products
- 12.1.11.3. Company Financials
- 12.1.11.4. SWOT Analysis
- 12.1.12 Yokogawa
- 12.1.12.1. Company Overview
- 12.1.12.2. Products
- 12.1.12.3. Company Financials
- 12.1.12.4. SWOT Analysis
- 12.1.13 Fanuc
- 12.1.13.1. Company Overview
- 12.1.13.2. Products
- 12.1.13.3. Company Financials
- 12.1.13.4. SWOT Analysis
- 12.1.14 NVIDIA
- 12.1.14.1. Company Overview
- 12.1.14.2. Products
- 12.1.14.3. Company Financials
- 12.1.14.4. SWOT Analysis
- 12.1.15 Keyence
- 12.1.15.1. Company Overview
- 12.1.15.2. Products
- 12.1.15.3. Company Financials
- 12.1.15.4. SWOT Analysis
- 12.1.16 Cognex
- 12.1.16.1. Company Overview
- 12.1.16.2. Products
- 12.1.16.3. Company Financials
- 12.1.16.4. SWOT Analysis
- 12.1.17 Stratatys
- 12.1.17.1. Company Overview
- 12.1.17.2. Products
- 12.1.17.3. Company Financials
- 12.1.17.4. SWOT Analysis
- 12.1.18 3D Systems
- 12.1.18.1. Company Overview
- 12.1.18.2. Products
- 12.1.18.3. Company Financials
- 12.1.18.4. SWOT Analysis
- 12.1.19 Daifuku
- 12.1.19.1. Company Overview
- 12.1.19.2. Products
- 12.1.19.3. Company Financials
- 12.1.19.4. SWOT Analysis
- 12.1.1 GE
- 12.2. Market Entropy
- 12.2.1 Company's Key Areas Served
- 12.2.2 Recent Developments
- 12.3. Company Market Share Analysis 2025
- 12.3.1 Top 5 Companies Market Share Analysis
- 12.3.2 Top 3 Companies Market Share Analysis
- 12.4. List of Potential Customers
- 13. Research Methodology
List of Figures
- Figure 1: Global Smart Manufacturing Revenue Breakdown (million, %) by Region 2025 & 2033
- Figure 2: North America Smart Manufacturing Revenue (million), by Component 2025 & 2033
- Figure 3: North America Smart Manufacturing Revenue Share (%), by Component 2025 & 2033
- Figure 4: North America Smart Manufacturing Revenue (million), by Manufacturing Process 2025 & 2033
- Figure 5: North America Smart Manufacturing Revenue Share (%), by Manufacturing Process 2025 & 2033
- Figure 6: North America Smart Manufacturing Revenue (million), by Enterprise Size 2025 & 2033
- Figure 7: North America Smart Manufacturing Revenue Share (%), by Enterprise Size 2025 & 2033
- Figure 8: North America Smart Manufacturing Revenue (million), by End User Industry 2025 & 2033
- Figure 9: North America Smart Manufacturing Revenue Share (%), by End User Industry 2025 & 2033
- Figure 10: North America Smart Manufacturing Revenue (million), by Country 2025 & 2033
- Figure 11: North America Smart Manufacturing Revenue Share (%), by Country 2025 & 2033
- Figure 12: South America Smart Manufacturing Revenue (million), by Component 2025 & 2033
- Figure 13: South America Smart Manufacturing Revenue Share (%), by Component 2025 & 2033
- Figure 14: South America Smart Manufacturing Revenue (million), by Manufacturing Process 2025 & 2033
- Figure 15: South America Smart Manufacturing Revenue Share (%), by Manufacturing Process 2025 & 2033
- Figure 16: South America Smart Manufacturing Revenue (million), by Enterprise Size 2025 & 2033
- Figure 17: South America Smart Manufacturing Revenue Share (%), by Enterprise Size 2025 & 2033
- Figure 18: South America Smart Manufacturing Revenue (million), by End User Industry 2025 & 2033
- Figure 19: South America Smart Manufacturing Revenue Share (%), by End User Industry 2025 & 2033
- Figure 20: South America Smart Manufacturing Revenue (million), by Country 2025 & 2033
- Figure 21: South America Smart Manufacturing Revenue Share (%), by Country 2025 & 2033
- Figure 22: Europe Smart Manufacturing Revenue (million), by Component 2025 & 2033
- Figure 23: Europe Smart Manufacturing Revenue Share (%), by Component 2025 & 2033
- Figure 24: Europe Smart Manufacturing Revenue (million), by Manufacturing Process 2025 & 2033
- Figure 25: Europe Smart Manufacturing Revenue Share (%), by Manufacturing Process 2025 & 2033
- Figure 26: Europe Smart Manufacturing Revenue (million), by Enterprise Size 2025 & 2033
- Figure 27: Europe Smart Manufacturing Revenue Share (%), by Enterprise Size 2025 & 2033
- Figure 28: Europe Smart Manufacturing Revenue (million), by End User Industry 2025 & 2033
- Figure 29: Europe Smart Manufacturing Revenue Share (%), by End User Industry 2025 & 2033
- Figure 30: Europe Smart Manufacturing Revenue (million), by Country 2025 & 2033
- Figure 31: Europe Smart Manufacturing Revenue Share (%), by Country 2025 & 2033
- Figure 32: Middle East & Africa Smart Manufacturing Revenue (million), by Component 2025 & 2033
- Figure 33: Middle East & Africa Smart Manufacturing Revenue Share (%), by Component 2025 & 2033
- Figure 34: Middle East & Africa Smart Manufacturing Revenue (million), by Manufacturing Process 2025 & 2033
- Figure 35: Middle East & Africa Smart Manufacturing Revenue Share (%), by Manufacturing Process 2025 & 2033
- Figure 36: Middle East & Africa Smart Manufacturing Revenue (million), by Enterprise Size 2025 & 2033
- Figure 37: Middle East & Africa Smart Manufacturing Revenue Share (%), by Enterprise Size 2025 & 2033
- Figure 38: Middle East & Africa Smart Manufacturing Revenue (million), by End User Industry 2025 & 2033
- Figure 39: Middle East & Africa Smart Manufacturing Revenue Share (%), by End User Industry 2025 & 2033
- Figure 40: Middle East & Africa Smart Manufacturing Revenue (million), by Country 2025 & 2033
- Figure 41: Middle East & Africa Smart Manufacturing Revenue Share (%), by Country 2025 & 2033
- Figure 42: Asia Pacific Smart Manufacturing Revenue (million), by Component 2025 & 2033
- Figure 43: Asia Pacific Smart Manufacturing Revenue Share (%), by Component 2025 & 2033
- Figure 44: Asia Pacific Smart Manufacturing Revenue (million), by Manufacturing Process 2025 & 2033
- Figure 45: Asia Pacific Smart Manufacturing Revenue Share (%), by Manufacturing Process 2025 & 2033
- Figure 46: Asia Pacific Smart Manufacturing Revenue (million), by Enterprise Size 2025 & 2033
- Figure 47: Asia Pacific Smart Manufacturing Revenue Share (%), by Enterprise Size 2025 & 2033
- Figure 48: Asia Pacific Smart Manufacturing Revenue (million), by End User Industry 2025 & 2033
- Figure 49: Asia Pacific Smart Manufacturing Revenue Share (%), by End User Industry 2025 & 2033
- Figure 50: Asia Pacific Smart Manufacturing Revenue (million), by Country 2025 & 2033
- Figure 51: Asia Pacific Smart Manufacturing Revenue Share (%), by Country 2025 & 2033
List of Tables
- Table 1: Global Smart Manufacturing Revenue million Forecast, by Component 2020 & 2033
- Table 2: Global Smart Manufacturing Revenue million Forecast, by Manufacturing Process 2020 & 2033
- Table 3: Global Smart Manufacturing Revenue million Forecast, by Enterprise Size 2020 & 2033
- Table 4: Global Smart Manufacturing Revenue million Forecast, by End User Industry 2020 & 2033
- Table 5: Global Smart Manufacturing Revenue million Forecast, by Region 2020 & 2033
- Table 6: Global Smart Manufacturing Revenue million Forecast, by Component 2020 & 2033
- Table 7: Global Smart Manufacturing Revenue million Forecast, by Manufacturing Process 2020 & 2033
- Table 8: Global Smart Manufacturing Revenue million Forecast, by Enterprise Size 2020 & 2033
- Table 9: Global Smart Manufacturing Revenue million Forecast, by End User Industry 2020 & 2033
- Table 10: Global Smart Manufacturing Revenue million Forecast, by Country 2020 & 2033
- Table 11: United States Smart Manufacturing Revenue (million) Forecast, by Application 2020 & 2033
- Table 12: Canada Smart Manufacturing Revenue (million) Forecast, by Application 2020 & 2033
- Table 13: Mexico Smart Manufacturing Revenue (million) Forecast, by Application 2020 & 2033
- Table 14: Global Smart Manufacturing Revenue million Forecast, by Component 2020 & 2033
- Table 15: Global Smart Manufacturing Revenue million Forecast, by Manufacturing Process 2020 & 2033
- Table 16: Global Smart Manufacturing Revenue million Forecast, by Enterprise Size 2020 & 2033
- Table 17: Global Smart Manufacturing Revenue million Forecast, by End User Industry 2020 & 2033
- Table 18: Global Smart Manufacturing Revenue million Forecast, by Country 2020 & 2033
- Table 19: Brazil Smart Manufacturing Revenue (million) Forecast, by Application 2020 & 2033
- Table 20: Argentina Smart Manufacturing Revenue (million) Forecast, by Application 2020 & 2033
- Table 21: Rest of South America Smart Manufacturing Revenue (million) Forecast, by Application 2020 & 2033
- Table 22: Global Smart Manufacturing Revenue million Forecast, by Component 2020 & 2033
- Table 23: Global Smart Manufacturing Revenue million Forecast, by Manufacturing Process 2020 & 2033
- Table 24: Global Smart Manufacturing Revenue million Forecast, by Enterprise Size 2020 & 2033
- Table 25: Global Smart Manufacturing Revenue million Forecast, by End User Industry 2020 & 2033
- Table 26: Global Smart Manufacturing Revenue million Forecast, by Country 2020 & 2033
- Table 27: United Kingdom Smart Manufacturing Revenue (million) Forecast, by Application 2020 & 2033
- Table 28: Germany Smart Manufacturing Revenue (million) Forecast, by Application 2020 & 2033
- Table 29: France Smart Manufacturing Revenue (million) Forecast, by Application 2020 & 2033
- Table 30: Italy Smart Manufacturing Revenue (million) Forecast, by Application 2020 & 2033
- Table 31: Spain Smart Manufacturing Revenue (million) Forecast, by Application 2020 & 2033
- Table 32: Russia Smart Manufacturing Revenue (million) Forecast, by Application 2020 & 2033
- Table 33: Benelux Smart Manufacturing Revenue (million) Forecast, by Application 2020 & 2033
- Table 34: Nordics Smart Manufacturing Revenue (million) Forecast, by Application 2020 & 2033
- Table 35: Rest of Europe Smart Manufacturing Revenue (million) Forecast, by Application 2020 & 2033
- Table 36: Global Smart Manufacturing Revenue million Forecast, by Component 2020 & 2033
- Table 37: Global Smart Manufacturing Revenue million Forecast, by Manufacturing Process 2020 & 2033
- Table 38: Global Smart Manufacturing Revenue million Forecast, by Enterprise Size 2020 & 2033
- Table 39: Global Smart Manufacturing Revenue million Forecast, by End User Industry 2020 & 2033
- Table 40: Global Smart Manufacturing Revenue million Forecast, by Country 2020 & 2033
- Table 41: Turkey Smart Manufacturing Revenue (million) Forecast, by Application 2020 & 2033
- Table 42: Israel Smart Manufacturing Revenue (million) Forecast, by Application 2020 & 2033
- Table 43: GCC Smart Manufacturing Revenue (million) Forecast, by Application 2020 & 2033
- Table 44: North Africa Smart Manufacturing Revenue (million) Forecast, by Application 2020 & 2033
- Table 45: South Africa Smart Manufacturing Revenue (million) Forecast, by Application 2020 & 2033
- Table 46: Rest of Middle East & Africa Smart Manufacturing Revenue (million) Forecast, by Application 2020 & 2033
- Table 47: Global Smart Manufacturing Revenue million Forecast, by Component 2020 & 2033
- Table 48: Global Smart Manufacturing Revenue million Forecast, by Manufacturing Process 2020 & 2033
- Table 49: Global Smart Manufacturing Revenue million Forecast, by Enterprise Size 2020 & 2033
- Table 50: Global Smart Manufacturing Revenue million Forecast, by End User Industry 2020 & 2033
- Table 51: Global Smart Manufacturing Revenue million Forecast, by Country 2020 & 2033
- Table 52: China Smart Manufacturing Revenue (million) Forecast, by Application 2020 & 2033
- Table 53: India Smart Manufacturing Revenue (million) Forecast, by Application 2020 & 2033
- Table 54: Japan Smart Manufacturing Revenue (million) Forecast, by Application 2020 & 2033
- Table 55: South Korea Smart Manufacturing Revenue (million) Forecast, by Application 2020 & 2033
- Table 56: ASEAN Smart Manufacturing Revenue (million) Forecast, by Application 2020 & 2033
- Table 57: Oceania Smart Manufacturing Revenue (million) Forecast, by Application 2020 & 2033
- Table 58: Rest of Asia Pacific Smart Manufacturing Revenue (million) Forecast, by Application 2020 & 2033
Frequently Asked Questions
1. What is the projected Compound Annual Growth Rate (CAGR) of the Smart Manufacturing?
The projected CAGR is approximately 9.9%.
2. Which companies are prominent players in the Smart Manufacturing?
Key companies in the market include GE, ABB, Siemens, SAP, Schneider, Emerson, Oracle, IBM, Honeywell, Cisco, Rockwell, Yokogawa, Fanuc, NVIDIA, Keyence, Cognex, Stratatys, 3D Systems, Daifuku.
3. What are the main segments of the Smart Manufacturing?
The market segments include Component, Manufacturing Process, Enterprise Size, End User Industry.
4. Can you provide details about the market size?
The market size is estimated to be USD 225390 million as of 2022.
5. What are some drivers contributing to market growth?
N/A
6. What are the notable trends driving market growth?
N/A
7. Are there any restraints impacting market growth?
N/A
8. Can you provide examples of recent developments in the market?
N/A
9. What pricing options are available for accessing the report?
Pricing options include single-user, multi-user, and enterprise licenses priced at USD 2900.00, USD 4350.00, and USD 5800.00 respectively.
10. Is the market size provided in terms of value or volume?
The market size is provided in terms of value, measured in million.
11. Are there any specific market keywords associated with the report?
Yes, the market keyword associated with the report is "Smart Manufacturing," which aids in identifying and referencing the specific market segment covered.
12. How do I determine which pricing option suits my needs best?
The pricing options vary based on user requirements and access needs. Individual users may opt for single-user licenses, while businesses requiring broader access may choose multi-user or enterprise licenses for cost-effective access to the report.
13. Are there any additional resources or data provided in the Smart Manufacturing report?
While the report offers comprehensive insights, it's advisable to review the specific contents or supplementary materials provided to ascertain if additional resources or data are available.
14. How can I stay updated on further developments or reports in the Smart Manufacturing?
To stay informed about further developments, trends, and reports in the Smart Manufacturing, consider subscribing to industry newsletters, following relevant companies and organizations, or regularly checking reputable industry news sources and publications.
Methodology
Step 1 - Identification of Relevant Samples Size from Population Database


Step 2 - Approaches for Defining Global Market Size (Value, Volume* & Price*)

Note*: In applicable scenarios
Step 3 - Data Sources
Primary Research
- Web Analytics
- Survey Reports
- Research Institute
- Latest Research Reports
- Opinion Leaders
Secondary Research
- Annual Reports
- White Paper
- Latest Press Release
- Industry Association
- Paid Database
- Investor Presentations

Step 4 - Data Triangulation
Involves using different sources of information in order to increase the validity of a study
These sources are likely to be stakeholders in a program - participants, other researchers, program staff, other community members, and so on.
Then we put all data in single framework & apply various statistical tools to find out the dynamic on the market.
During the analysis stage, feedback from the stakeholder groups would be compared to determine areas of agreement as well as areas of divergence