

Key Insights
The global Smart Contracts Software market is poised for exceptional growth, projected to reach $684.3 million by 2025, with a remarkable Compound Annual Growth Rate (CAGR) of 24.2% during the forecast period of 2025-2033. This robust expansion is primarily driven by the increasing adoption of blockchain technology across various industries, the inherent benefits of smart contracts such as automation, transparency, and cost reduction, and the growing demand for enhanced security and efficiency in business processes. The market is segmented into applications for Large Enterprises and SMEs, with Cloud-Based solutions expected to lead in adoption due to their scalability and flexibility, while On-Premises solutions will cater to organizations with stringent data control requirements. Key players like Ethereum, Corda, Hyperledger, and major technology firms such as Microsoft and IBM are heavily investing in developing and refining smart contract platforms, further fueling market innovation and accessibility.
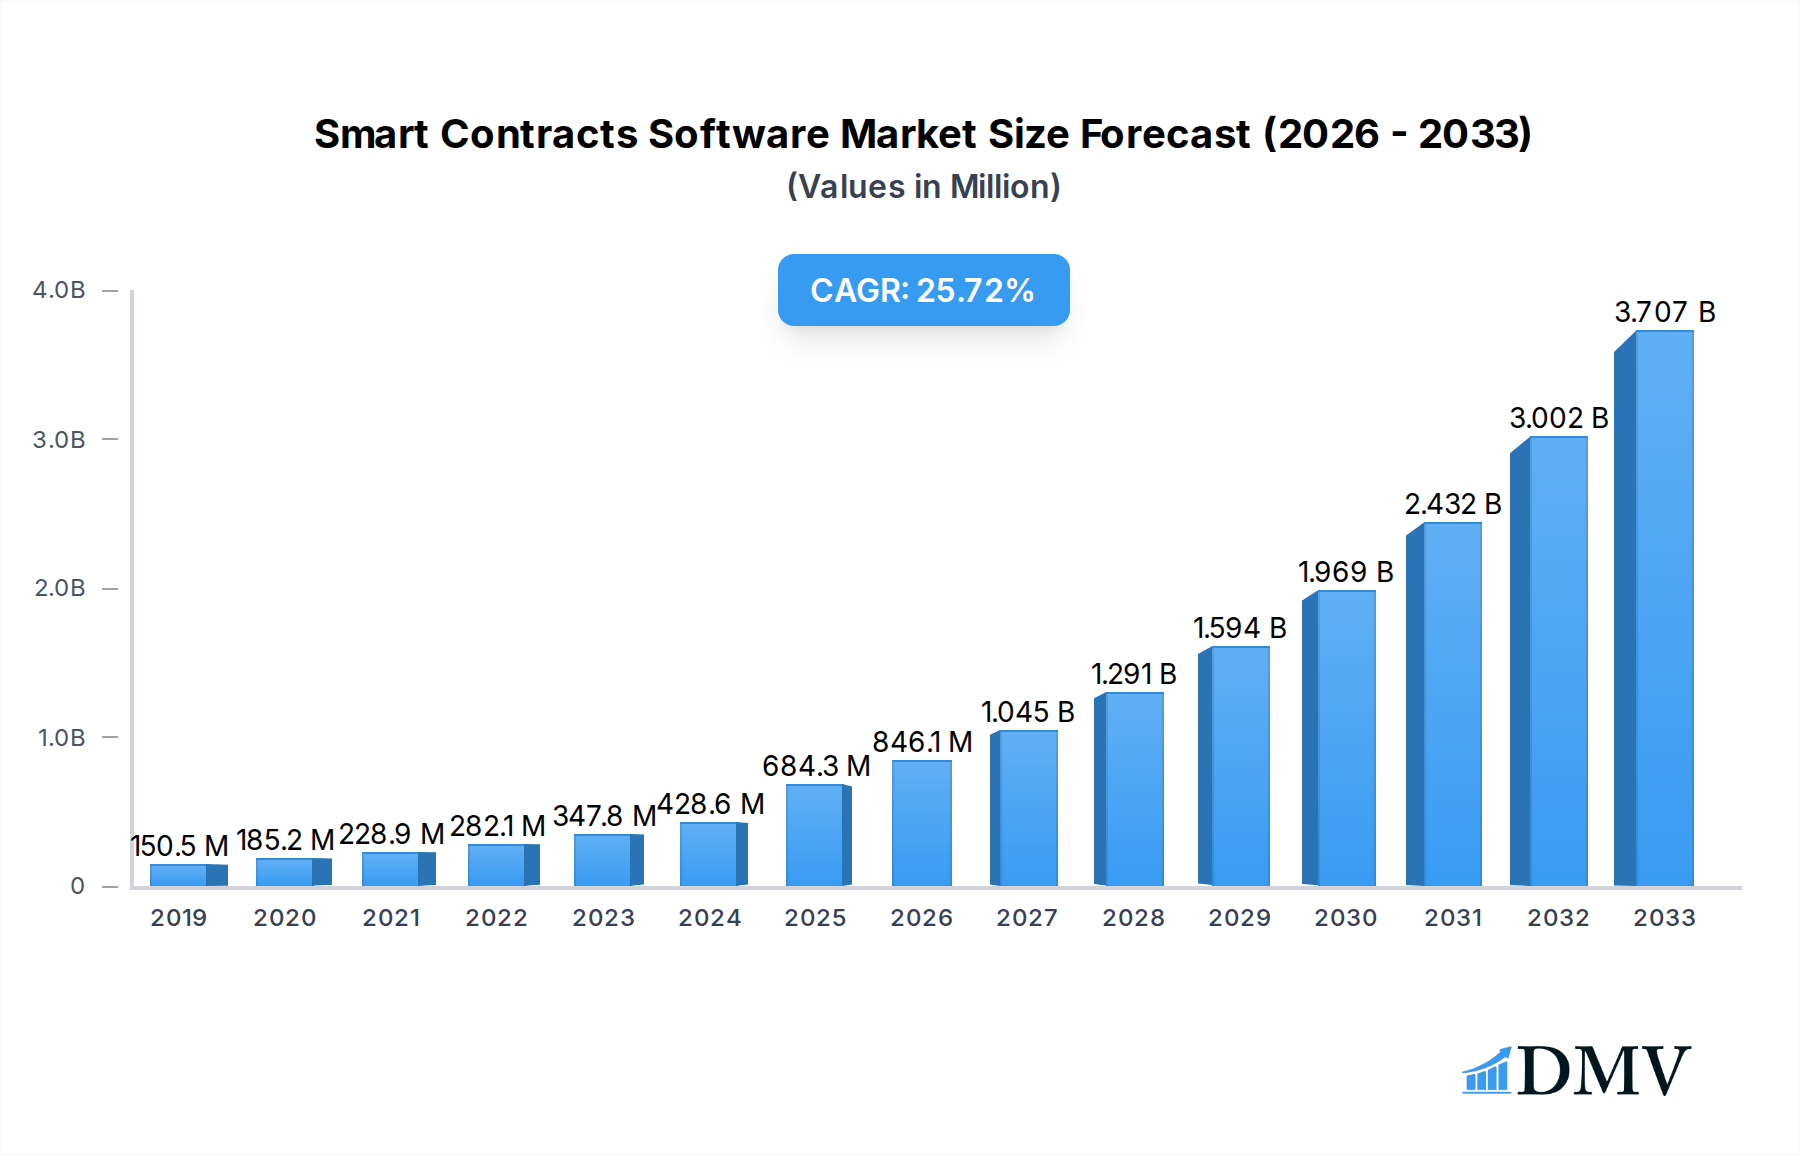
Smart Contracts Software Market Size (In Million)
Emerging trends indicate a surge in smart contract integration within decentralized finance (DeFi), supply chain management, healthcare, and the real estate sectors. The market's rapid ascent is supported by significant advancements in smart contract languages, interoperability solutions, and regulatory frameworks that are increasingly providing clarity and support for blockchain-based agreements. While the market faces restraints such as the complexity of implementation, the need for specialized expertise, and evolving regulatory landscapes in certain regions, the overwhelming advantages of smart contracts are driving their widespread adoption. Geographically, North America and Europe are anticipated to be dominant markets, followed by the Asia Pacific region, which is experiencing rapid digital transformation and a growing appetite for innovative technologies. The substantial projected market size and high CAGR underscore the transformative potential and significant economic impact of smart contracts software in the coming years.

Smart Contracts Software Company Market Share
This comprehensive report offers an in-depth analysis of the global Smart Contracts Software market, providing critical insights into its current state, historical trajectory, and future projections. Designed to empower stakeholders including Large Enterprises and SMEs, this report navigates the evolving landscape of Cloud Based and On Premises smart contract solutions, crucial for industry developments. With a meticulous study period spanning 2019 to 2033, a Base Year of 2025, and a Forecast Period from 2025 to 2033, this research delivers actionable intelligence on market composition, trends, and growth catalysts.
Smart Contracts Software Market Composition & Trends
The Smart Contracts Software market is characterized by a dynamic interplay of innovation, regulatory evolution, and strategic consolidation. Market concentration is influenced by the emergence of robust platforms and the increasing adoption by leading entities. Innovation catalysts are primarily driven by advancements in blockchain technology, particularly within ecosystems like Ethereum, Corda, and Hyperledger, alongside contributions from technology giants such as Microsoft and IBM. Regulatory landscapes are progressively maturing, with governments worldwide exploring frameworks for decentralized applications and automated agreements. Substitute products, while present in traditional contract management, are increasingly being overshadowed by the efficiency and transparency offered by smart contracts. End-user profiles span a broad spectrum, from agile SMEs seeking cost-effective automation to Large Enterprises aiming to streamline complex workflows and mitigate risks. Mergers and acquisitions (M&A) activities are on the rise, reflecting a growing interest in acquiring innovative technologies and expanding market reach. Key M&A deal values are estimated to reach billions, underscoring significant investment in this sector.
- Market Share Distribution: The market exhibits a growing share for platforms leveraging decentralized ledger technology (DLT), with specialized solutions carving out niches.
- Innovation Catalysts: Enhanced security protocols, interoperability solutions, and user-friendly development tools are key drivers.
- Regulatory Landscape: Ongoing development of legal frameworks for smart contract enforceability and data privacy.
- Substitute Products: Traditional legal and administrative contract processes are being directly challenged by smart contract automation.
- End-User Profiles: Adoption driven by financial services, supply chain management, healthcare, and real estate sectors.
- M&A Activities: Strategic acquisitions to integrate AI capabilities, enhance scalability, and expand service offerings. M&A deal values are projected to exceed $500 million in the forecast period.
Smart Contracts Software Industry Evolution
The Smart Contracts Software industry has witnessed a remarkable evolution, transforming from nascent blockchain experiments to a critical component of digital transformation strategies for businesses across all verticals. Throughout the Historical Period of 2019–2024, the market primarily saw initial adoption within cryptocurrency and decentralized finance (DeFi) applications, laying the groundwork for broader acceptance. The Base Year of 2025 marks a significant inflection point, with increasing institutional interest and a clearer understanding of the technology's potential beyond financial use cases. Market growth trajectories are steep, fueled by the inherent benefits of automation, security, and transparency that smart contracts offer. Technological advancements have been relentless, with improvements in scalability solutions for platforms like Ethereum, the development of enterprise-grade blockchain frameworks such as Hyperledger and Corda, and the emergence of specialized smart contract languages and tools. Shifting consumer demands, particularly from Large Enterprises, are increasingly pushing for verifiable, tamper-proof, and self-executing agreements to reduce operational costs, minimize disputes, and accelerate business processes.
The Forecast Period of 2025–2033 is poised for exponential growth. Adoption metrics are expected to surge as more businesses integrate smart contracts into their core operations. For instance, the adoption rate among Fortune 500 companies is projected to increase by over 30% within the next five years. The market is anticipated to expand at a Compound Annual Growth Rate (CAGR) of approximately 25%, reaching a market size estimated at over $10 billion by 2033. This growth will be propelled by advancements in zero-knowledge proofs for enhanced privacy, cross-chain interoperability solutions, and the development of smart contract marketplaces. Companies like BlockApps, Digital Asset, and Icertis are at the forefront of providing enterprise-grade solutions, while platforms like Kadena and æternity blockchain are pushing the boundaries of scalability and functionality. The increasing availability of smart contract development platforms and the growing pool of skilled developers further contribute to this evolutionary path. The integration of artificial intelligence (AI) with smart contracts, exemplified by the work of AnChain.AI, is also set to unlock new levels of automation and predictive capabilities, driving further industry evolution and making smart contracts an indispensable tool for future business operations.
Leading Regions, Countries, or Segments in Smart Contracts Software
The dominance in the Smart Contracts Software market is currently observed within the Large Enterprises segment, driven by their capacity for substantial investment, their need for complex automation, and their ability to navigate the evolving regulatory landscape. This segment's preference for Cloud Based solutions further solidifies its leading position, offering scalability, flexibility, and reduced infrastructure overhead. North America, particularly the United States, stands out as a leading region due to its robust technological infrastructure, significant venture capital investment in blockchain and AI, and a supportive, albeit still developing, regulatory environment for DLT. The presence of major tech hubs and a concentration of forward-thinking corporations fuels rapid adoption.
Key drivers for the dominance of Large Enterprises and Cloud Based solutions in North America include:
- Investment Trends: Significant R&D spending by large corporations on exploring and implementing blockchain-based solutions for supply chain, finance, and compliance. Venture capital funding for smart contract startups in the region consistently ranks highest globally.
- Regulatory Support: While challenges remain, proactive engagement from regulatory bodies in understanding and potentially shaping the future of smart contracts encourages large-scale adoption. Initiatives by bodies like the U.S. Chamber of Commerce highlight the growing interest in leveraging these technologies.
- Technological Maturity: Advanced cloud infrastructure and the availability of sophisticated DLT platforms like Ethereum, Corda, and Hyperledger provide the necessary technological backbone for enterprise-grade smart contract deployments.
- Industry-Specific Demand: Sectors such as finance, insurance, and logistics, which are heavily concentrated in North America, are experiencing immense pressure to improve efficiency and reduce costs, making smart contracts a highly attractive solution. The need for secure and automated cross-border transactions further amplifies this demand.
- Talent Pool: A concentrated availability of skilled blockchain developers and smart contract architects facilitates the development and deployment of complex solutions for large organizations.
While SMEs are increasingly exploring smart contract solutions, their adoption is often phased and dependent on more readily accessible, cost-effective platforms. Similarly, On Premises deployments, while crucial for highly regulated industries or entities with strict data sovereignty requirements, represent a smaller portion of the overall market compared to the agility offered by cloud-based solutions. The interplay of these factors positions Large Enterprises and Cloud Based solutions in North America at the forefront of the Smart Contracts Software market's current trajectory, acting as key influencers of future industry developments.
Smart Contracts Software Product Innovations
Product innovations in Smart Contracts Software are rapidly enhancing its capabilities, focusing on improved security, scalability, and user-friendliness. Recent advancements include the development of more sophisticated smart contract languages and development environments, enabling developers to build complex applications with greater ease and fewer vulnerabilities. Innovations like automated auditing tools and formal verification methods are significantly boosting the reliability and security of deployed smart contracts, mitigating risks associated with execution errors or malicious attacks. Furthermore, the integration of AI with smart contracts is enabling predictive analytics and autonomous decision-making, opening up new applications in areas such as dynamic pricing in supply chains and personalized insurance policies. Interoperability solutions are also a key focus, allowing smart contracts to interact seamlessly across different blockchain networks, thereby expanding their reach and utility. These advancements are directly contributing to increased adoption by both Large Enterprises and SMEs.
Propelling Factors for Smart Contracts Software Growth
Several key factors are propelling the growth of the Smart Contracts Software market. Technologically, the ongoing maturation of blockchain infrastructure, including enhanced scalability solutions for platforms like Ethereum and the development of private and permissioned blockchains by entities like IBM and Microsoft, provides a robust foundation. Economically, the inherent cost savings and efficiency gains from automating complex agreement processes are a significant draw for businesses seeking to optimize operations. Regulatory clarity, although still evolving, is gradually improving, with governments showing increased interest in the potential of DLT to foster transparency and reduce fraud. The growing demand for decentralized applications (dApps) in finance, supply chain, and other sectors further fuels adoption.
- Technological Advancements: Enhanced scalability, security, and interoperability of blockchain networks.
- Economic Benefits: Reduced operational costs, increased efficiency, and elimination of intermediaries.
- Regulatory Support: Gradual development of legal frameworks for smart contract enforceability.
- Industry Demand: Growing need for automation and transparency in sectors like finance, supply chain, and healthcare.
- Rise of dApps: Proliferation of decentralized applications creating new use cases for smart contracts.
Obstacles in the Smart Contracts Software Market
Despite the immense potential, the Smart Contracts Software market faces significant obstacles. Regulatory uncertainty remains a primary concern, with a lack of standardized legal frameworks for the enforceability and dispute resolution of smart contracts across different jurisdictions. The complexity of smart contract development and the scarcity of skilled developers can also be a barrier to adoption, particularly for SMEs. Security vulnerabilities and the risk of bugs in code can lead to substantial financial losses, as demonstrated by past incidents, creating hesitancy among risk-averse organizations. Furthermore, the interoperability challenges between different blockchain networks can limit the seamless execution of cross-chain smart contracts, hindering wider integration. Supply chain disruptions, while not directly caused by smart contracts, can impact the reliable execution of real-world-triggered smart contracts.
- Regulatory Uncertainty: Lack of clear legal status and enforcement mechanisms for smart contracts.
- Technical Complexity: High barrier to entry for development and implementation.
- Security Risks: Potential for coding errors leading to financial losses.
- Interoperability Issues: Challenges in seamless communication between different blockchain networks.
- Talent Shortage: Limited availability of experienced smart contract developers.
Future Opportunities in Smart Contracts Software
Emerging opportunities in the Smart Contracts Software market are vast and ripe for exploration. The increasing adoption of the Internet of Things (IoT) provides a fertile ground for smart contracts, enabling autonomous execution of agreements based on real-world data from connected devices. The growing interest in decentralized finance (DeFi) continues to expand the scope for smart contracts in lending, borrowing, and trading. Furthermore, the development of more advanced AI integration with smart contracts promises to unlock unprecedented levels of automation and predictive capabilities. Cross-chain compatibility solutions are expected to mature, facilitating seamless interaction between different blockchain ecosystems, thereby broadening the application scope. The untapped potential in emerging economies and the increasing demand for transparency and efficiency in supply chain management also present significant growth avenues.
- IoT Integration: Automating agreements based on real-world data from connected devices.
- DeFi Expansion: Enabling new financial instruments and services on blockchain networks.
- AI-Powered Smart Contracts: Enhancing automation, prediction, and decision-making.
- Cross-Chain Interoperability: Facilitating seamless execution across diverse blockchain ecosystems.
- Emerging Markets: Tapping into new geographies and industries seeking DLT solutions.
Major Players in the Smart Contracts Software Ecosystem
- Ethereum
- Corda
- Hyperledger
- Microsoft
- DigiByte Holdings
- æternity blockchain
- AlphaPoint
- AnChain.AI
- BigchainDB
- Bison Trails Co.
- BlockApps
- Block Notary
- Blockstream
- ChromaWay
- Chronicled
- CloudFabrix Software
- Credits
- Digital Asset
- IBM
- Icertis
- Kadena
- Monax
- Neo Team
- Polymath
- Riverr Pte. Ltd.
- Sanjh
- Brickblock Digital Services
- Symbiont
- BlockCAT Technologies
- OpenLaw
Key Developments in Smart Contracts Software Industry
- 2019: Launch of numerous enterprise-grade blockchain solutions and consortia focusing on smart contract development. Increased regulatory discussions around smart contract legality.
- 2020: Significant surge in Decentralized Finance (DeFi) adoption, driving innovation in smart contract use cases for financial instruments. Ethereum 2.0 development gains momentum.
- 2021: Growing interest from traditional enterprises in adopting smart contracts for supply chain management and automation. Advancements in cross-chain interoperability solutions emerge.
- 2022: Focus on smart contract security audits and formal verification tools intensifies. Partnerships between major tech companies and blockchain startups.
- 2023: Increased exploration of smart contracts for non-financial applications like digital identity and intellectual property management. Hyperledger and Corda continue to see enterprise adoption.
- 2024: Development of more intuitive smart contract programming languages and platforms for wider accessibility. Emerging discussions around AI integration with smart contracts.
Strategic Smart Contracts Software Market Forecast
The Smart Contracts Software market is set for robust growth, driven by accelerating adoption across Large Enterprises and SMEs. Key growth catalysts include continuous technological innovation, particularly in scalability, security, and interoperability, alongside the increasing demand for automation and efficiency in business operations. Favorable regulatory developments are expected to provide further impetus, reducing adoption barriers. The burgeoning DeFi sector and the expanding use of smart contracts in supply chain management, IoT, and other nascent applications present substantial future opportunities. Strategic investments in research and development, coupled with a growing talent pool, will solidify the market's expansion trajectory, positioning smart contracts as an indispensable technology for the digital economy. The market potential is projected to reach billions in the coming years, underscoring its strategic importance.
Smart Contracts Software Segmentation
-
1. Application
- 1.1. Large Enterprises
- 1.2. SMEs
-
2. Types
- 2.1. Cloud Based
- 2.2. On Premises
Smart Contracts Software Segmentation By Geography
-
1. North America
- 1.1. United States
- 1.2. Canada
- 1.3. Mexico
-
2. South America
- 2.1. Brazil
- 2.2. Argentina
- 2.3. Rest of South America
-
3. Europe
- 3.1. United Kingdom
- 3.2. Germany
- 3.3. France
- 3.4. Italy
- 3.5. Spain
- 3.6. Russia
- 3.7. Benelux
- 3.8. Nordics
- 3.9. Rest of Europe
-
4. Middle East & Africa
- 4.1. Turkey
- 4.2. Israel
- 4.3. GCC
- 4.4. North Africa
- 4.5. South Africa
- 4.6. Rest of Middle East & Africa
-
5. Asia Pacific
- 5.1. China
- 5.2. India
- 5.3. Japan
- 5.4. South Korea
- 5.5. ASEAN
- 5.6. Oceania
- 5.7. Rest of Asia Pacific
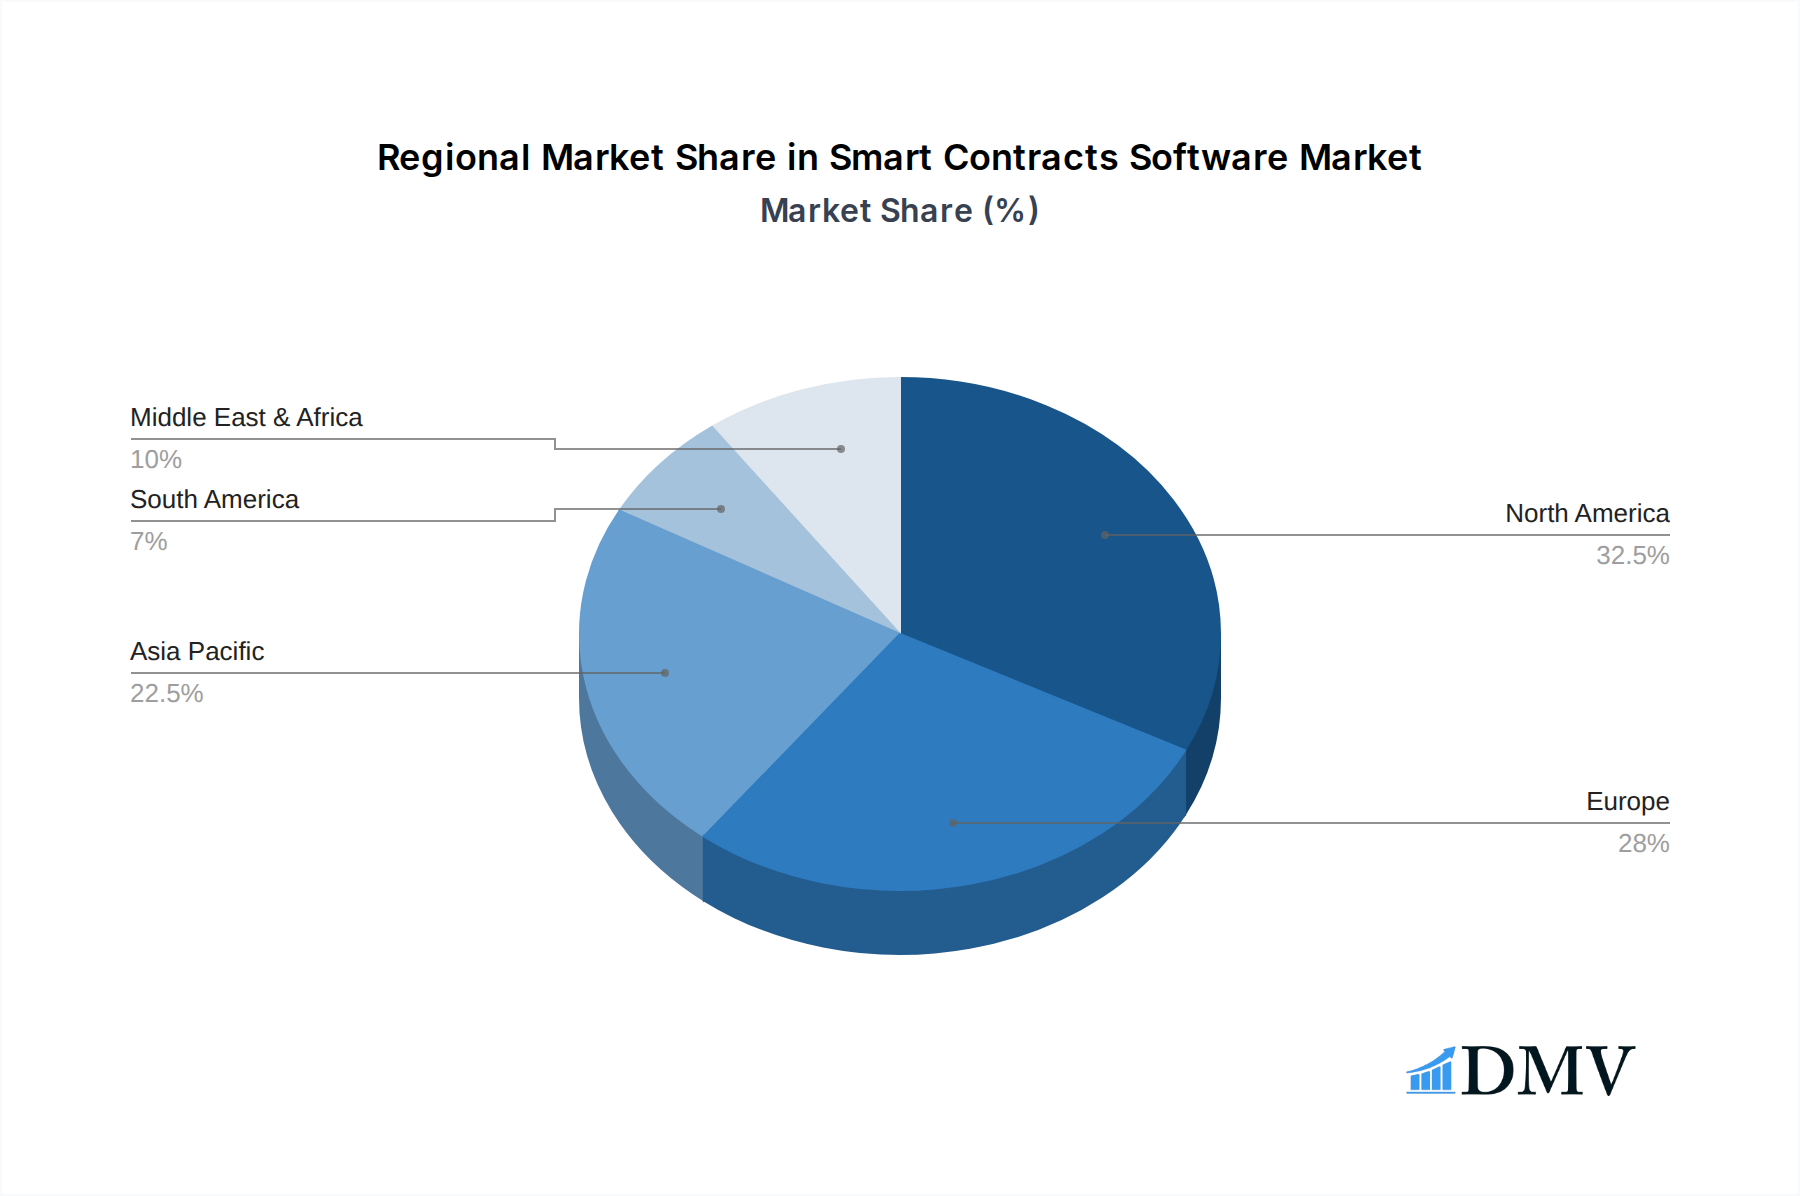
Smart Contracts Software Regional Market Share
Geographic Coverage of Smart Contracts Software
Smart Contracts Software REPORT HIGHLIGHTS
| Aspects | Details |
|---|---|
| Study Period | 2020-2034 |
| Base Year | 2025 |
| Estimated Year | 2026 |
| Forecast Period | 2026-2034 |
| Historical Period | 2020-2025 |
| Growth Rate | CAGR of 24.2% from 2020-2034 |
| Segmentation |
|
Table of Contents
- 1. Introduction
- 1.1. Research Scope
- 1.2. Market Segmentation
- 1.3. Research Methodology
- 1.4. Definitions and Assumptions
- 2. Executive Summary
- 2.1. Introduction
- 3. Market Dynamics
- 3.1. Introduction
- 3.2. Market Drivers
- 3.3. Market Restrains
- 3.4. Market Trends
- 4. Market Factor Analysis
- 4.1. Porters Five Forces
- 4.2. Supply/Value Chain
- 4.3. PESTEL analysis
- 4.4. Market Entropy
- 4.5. Patent/Trademark Analysis
- 5. Global Smart Contracts Software Analysis, Insights and Forecast, 2020-2032
- 5.1. Market Analysis, Insights and Forecast - by Application
- 5.1.1. Large Enterprises
- 5.1.2. SMEs
- 5.2. Market Analysis, Insights and Forecast - by Types
- 5.2.1. Cloud Based
- 5.2.2. On Premises
- 5.3. Market Analysis, Insights and Forecast - by Region
- 5.3.1. North America
- 5.3.2. South America
- 5.3.3. Europe
- 5.3.4. Middle East & Africa
- 5.3.5. Asia Pacific
- 5.1. Market Analysis, Insights and Forecast - by Application
- 6. North America Smart Contracts Software Analysis, Insights and Forecast, 2020-2032
- 6.1. Market Analysis, Insights and Forecast - by Application
- 6.1.1. Large Enterprises
- 6.1.2. SMEs
- 6.2. Market Analysis, Insights and Forecast - by Types
- 6.2.1. Cloud Based
- 6.2.2. On Premises
- 6.1. Market Analysis, Insights and Forecast - by Application
- 7. South America Smart Contracts Software Analysis, Insights and Forecast, 2020-2032
- 7.1. Market Analysis, Insights and Forecast - by Application
- 7.1.1. Large Enterprises
- 7.1.2. SMEs
- 7.2. Market Analysis, Insights and Forecast - by Types
- 7.2.1. Cloud Based
- 7.2.2. On Premises
- 7.1. Market Analysis, Insights and Forecast - by Application
- 8. Europe Smart Contracts Software Analysis, Insights and Forecast, 2020-2032
- 8.1. Market Analysis, Insights and Forecast - by Application
- 8.1.1. Large Enterprises
- 8.1.2. SMEs
- 8.2. Market Analysis, Insights and Forecast - by Types
- 8.2.1. Cloud Based
- 8.2.2. On Premises
- 8.1. Market Analysis, Insights and Forecast - by Application
- 9. Middle East & Africa Smart Contracts Software Analysis, Insights and Forecast, 2020-2032
- 9.1. Market Analysis, Insights and Forecast - by Application
- 9.1.1. Large Enterprises
- 9.1.2. SMEs
- 9.2. Market Analysis, Insights and Forecast - by Types
- 9.2.1. Cloud Based
- 9.2.2. On Premises
- 9.1. Market Analysis, Insights and Forecast - by Application
- 10. Asia Pacific Smart Contracts Software Analysis, Insights and Forecast, 2020-2032
- 10.1. Market Analysis, Insights and Forecast - by Application
- 10.1.1. Large Enterprises
- 10.1.2. SMEs
- 10.2. Market Analysis, Insights and Forecast - by Types
- 10.2.1. Cloud Based
- 10.2.2. On Premises
- 10.1. Market Analysis, Insights and Forecast - by Application
- 11. Competitive Analysis
- 11.1. Global Market Share Analysis 2025
- 11.2. Company Profiles
- 11.2.1 Ethereum
- 11.2.1.1. Overview
- 11.2.1.2. Products
- 11.2.1.3. SWOT Analysis
- 11.2.1.4. Recent Developments
- 11.2.1.5. Financials (Based on Availability)
- 11.2.2 Corda
- 11.2.2.1. Overview
- 11.2.2.2. Products
- 11.2.2.3. SWOT Analysis
- 11.2.2.4. Recent Developments
- 11.2.2.5. Financials (Based on Availability)
- 11.2.3 Hyperledger
- 11.2.3.1. Overview
- 11.2.3.2. Products
- 11.2.3.3. SWOT Analysis
- 11.2.3.4. Recent Developments
- 11.2.3.5. Financials (Based on Availability)
- 11.2.4 Microsoft
- 11.2.4.1. Overview
- 11.2.4.2. Products
- 11.2.4.3. SWOT Analysis
- 11.2.4.4. Recent Developments
- 11.2.4.5. Financials (Based on Availability)
- 11.2.5 DigiByte Holdings
- 11.2.5.1. Overview
- 11.2.5.2. Products
- 11.2.5.3. SWOT Analysis
- 11.2.5.4. Recent Developments
- 11.2.5.5. Financials (Based on Availability)
- 11.2.6 æternity blockchain
- 11.2.6.1. Overview
- 11.2.6.2. Products
- 11.2.6.3. SWOT Analysis
- 11.2.6.4. Recent Developments
- 11.2.6.5. Financials (Based on Availability)
- 11.2.7 AlphaPoint
- 11.2.7.1. Overview
- 11.2.7.2. Products
- 11.2.7.3. SWOT Analysis
- 11.2.7.4. Recent Developments
- 11.2.7.5. Financials (Based on Availability)
- 11.2.8 AnChain.AI
- 11.2.8.1. Overview
- 11.2.8.2. Products
- 11.2.8.3. SWOT Analysis
- 11.2.8.4. Recent Developments
- 11.2.8.5. Financials (Based on Availability)
- 11.2.9 BigchainDB
- 11.2.9.1. Overview
- 11.2.9.2. Products
- 11.2.9.3. SWOT Analysis
- 11.2.9.4. Recent Developments
- 11.2.9.5. Financials (Based on Availability)
- 11.2.10 Bison Trails Co.
- 11.2.10.1. Overview
- 11.2.10.2. Products
- 11.2.10.3. SWOT Analysis
- 11.2.10.4. Recent Developments
- 11.2.10.5. Financials (Based on Availability)
- 11.2.11 BlockApps
- 11.2.11.1. Overview
- 11.2.11.2. Products
- 11.2.11.3. SWOT Analysis
- 11.2.11.4. Recent Developments
- 11.2.11.5. Financials (Based on Availability)
- 11.2.12 Block Notary
- 11.2.12.1. Overview
- 11.2.12.2. Products
- 11.2.12.3. SWOT Analysis
- 11.2.12.4. Recent Developments
- 11.2.12.5. Financials (Based on Availability)
- 11.2.13 Blockstream
- 11.2.13.1. Overview
- 11.2.13.2. Products
- 11.2.13.3. SWOT Analysis
- 11.2.13.4. Recent Developments
- 11.2.13.5. Financials (Based on Availability)
- 11.2.14 ChromaWay
- 11.2.14.1. Overview
- 11.2.14.2. Products
- 11.2.14.3. SWOT Analysis
- 11.2.14.4. Recent Developments
- 11.2.14.5. Financials (Based on Availability)
- 11.2.15 Chronicled
- 11.2.15.1. Overview
- 11.2.15.2. Products
- 11.2.15.3. SWOT Analysis
- 11.2.15.4. Recent Developments
- 11.2.15.5. Financials (Based on Availability)
- 11.2.16 CloudFabrix Software
- 11.2.16.1. Overview
- 11.2.16.2. Products
- 11.2.16.3. SWOT Analysis
- 11.2.16.4. Recent Developments
- 11.2.16.5. Financials (Based on Availability)
- 11.2.17 Credits
- 11.2.17.1. Overview
- 11.2.17.2. Products
- 11.2.17.3. SWOT Analysis
- 11.2.17.4. Recent Developments
- 11.2.17.5. Financials (Based on Availability)
- 11.2.18 Digital Asset
- 11.2.18.1. Overview
- 11.2.18.2. Products
- 11.2.18.3. SWOT Analysis
- 11.2.18.4. Recent Developments
- 11.2.18.5. Financials (Based on Availability)
- 11.2.19 IBM
- 11.2.19.1. Overview
- 11.2.19.2. Products
- 11.2.19.3. SWOT Analysis
- 11.2.19.4. Recent Developments
- 11.2.19.5. Financials (Based on Availability)
- 11.2.20 Icertis
- 11.2.20.1. Overview
- 11.2.20.2. Products
- 11.2.20.3. SWOT Analysis
- 11.2.20.4. Recent Developments
- 11.2.20.5. Financials (Based on Availability)
- 11.2.21 Kadena
- 11.2.21.1. Overview
- 11.2.21.2. Products
- 11.2.21.3. SWOT Analysis
- 11.2.21.4. Recent Developments
- 11.2.21.5. Financials (Based on Availability)
- 11.2.22 Monax
- 11.2.22.1. Overview
- 11.2.22.2. Products
- 11.2.22.3. SWOT Analysis
- 11.2.22.4. Recent Developments
- 11.2.22.5. Financials (Based on Availability)
- 11.2.23 Neo Team
- 11.2.23.1. Overview
- 11.2.23.2. Products
- 11.2.23.3. SWOT Analysis
- 11.2.23.4. Recent Developments
- 11.2.23.5. Financials (Based on Availability)
- 11.2.24 Polymath
- 11.2.24.1. Overview
- 11.2.24.2. Products
- 11.2.24.3. SWOT Analysis
- 11.2.24.4. Recent Developments
- 11.2.24.5. Financials (Based on Availability)
- 11.2.25 Riverr Pte. Ltd.
- 11.2.25.1. Overview
- 11.2.25.2. Products
- 11.2.25.3. SWOT Analysis
- 11.2.25.4. Recent Developments
- 11.2.25.5. Financials (Based on Availability)
- 11.2.26 Sanjh
- 11.2.26.1. Overview
- 11.2.26.2. Products
- 11.2.26.3. SWOT Analysis
- 11.2.26.4. Recent Developments
- 11.2.26.5. Financials (Based on Availability)
- 11.2.27 Brickblock Digital Services
- 11.2.27.1. Overview
- 11.2.27.2. Products
- 11.2.27.3. SWOT Analysis
- 11.2.27.4. Recent Developments
- 11.2.27.5. Financials (Based on Availability)
- 11.2.28 Symbiont
- 11.2.28.1. Overview
- 11.2.28.2. Products
- 11.2.28.3. SWOT Analysis
- 11.2.28.4. Recent Developments
- 11.2.28.5. Financials (Based on Availability)
- 11.2.29 BlockCAT Technologies
- 11.2.29.1. Overview
- 11.2.29.2. Products
- 11.2.29.3. SWOT Analysis
- 11.2.29.4. Recent Developments
- 11.2.29.5. Financials (Based on Availability)
- 11.2.30 OpenLaw
- 11.2.30.1. Overview
- 11.2.30.2. Products
- 11.2.30.3. SWOT Analysis
- 11.2.30.4. Recent Developments
- 11.2.30.5. Financials (Based on Availability)
- 11.2.1 Ethereum
List of Figures
- Figure 1: Global Smart Contracts Software Revenue Breakdown (million, %) by Region 2025 & 2033
- Figure 2: North America Smart Contracts Software Revenue (million), by Application 2025 & 2033
- Figure 3: North America Smart Contracts Software Revenue Share (%), by Application 2025 & 2033
- Figure 4: North America Smart Contracts Software Revenue (million), by Types 2025 & 2033
- Figure 5: North America Smart Contracts Software Revenue Share (%), by Types 2025 & 2033
- Figure 6: North America Smart Contracts Software Revenue (million), by Country 2025 & 2033
- Figure 7: North America Smart Contracts Software Revenue Share (%), by Country 2025 & 2033
- Figure 8: South America Smart Contracts Software Revenue (million), by Application 2025 & 2033
- Figure 9: South America Smart Contracts Software Revenue Share (%), by Application 2025 & 2033
- Figure 10: South America Smart Contracts Software Revenue (million), by Types 2025 & 2033
- Figure 11: South America Smart Contracts Software Revenue Share (%), by Types 2025 & 2033
- Figure 12: South America Smart Contracts Software Revenue (million), by Country 2025 & 2033
- Figure 13: South America Smart Contracts Software Revenue Share (%), by Country 2025 & 2033
- Figure 14: Europe Smart Contracts Software Revenue (million), by Application 2025 & 2033
- Figure 15: Europe Smart Contracts Software Revenue Share (%), by Application 2025 & 2033
- Figure 16: Europe Smart Contracts Software Revenue (million), by Types 2025 & 2033
- Figure 17: Europe Smart Contracts Software Revenue Share (%), by Types 2025 & 2033
- Figure 18: Europe Smart Contracts Software Revenue (million), by Country 2025 & 2033
- Figure 19: Europe Smart Contracts Software Revenue Share (%), by Country 2025 & 2033
- Figure 20: Middle East & Africa Smart Contracts Software Revenue (million), by Application 2025 & 2033
- Figure 21: Middle East & Africa Smart Contracts Software Revenue Share (%), by Application 2025 & 2033
- Figure 22: Middle East & Africa Smart Contracts Software Revenue (million), by Types 2025 & 2033
- Figure 23: Middle East & Africa Smart Contracts Software Revenue Share (%), by Types 2025 & 2033
- Figure 24: Middle East & Africa Smart Contracts Software Revenue (million), by Country 2025 & 2033
- Figure 25: Middle East & Africa Smart Contracts Software Revenue Share (%), by Country 2025 & 2033
- Figure 26: Asia Pacific Smart Contracts Software Revenue (million), by Application 2025 & 2033
- Figure 27: Asia Pacific Smart Contracts Software Revenue Share (%), by Application 2025 & 2033
- Figure 28: Asia Pacific Smart Contracts Software Revenue (million), by Types 2025 & 2033
- Figure 29: Asia Pacific Smart Contracts Software Revenue Share (%), by Types 2025 & 2033
- Figure 30: Asia Pacific Smart Contracts Software Revenue (million), by Country 2025 & 2033
- Figure 31: Asia Pacific Smart Contracts Software Revenue Share (%), by Country 2025 & 2033
List of Tables
- Table 1: Global Smart Contracts Software Revenue million Forecast, by Application 2020 & 2033
- Table 2: Global Smart Contracts Software Revenue million Forecast, by Types 2020 & 2033
- Table 3: Global Smart Contracts Software Revenue million Forecast, by Region 2020 & 2033
- Table 4: Global Smart Contracts Software Revenue million Forecast, by Application 2020 & 2033
- Table 5: Global Smart Contracts Software Revenue million Forecast, by Types 2020 & 2033
- Table 6: Global Smart Contracts Software Revenue million Forecast, by Country 2020 & 2033
- Table 7: United States Smart Contracts Software Revenue (million) Forecast, by Application 2020 & 2033
- Table 8: Canada Smart Contracts Software Revenue (million) Forecast, by Application 2020 & 2033
- Table 9: Mexico Smart Contracts Software Revenue (million) Forecast, by Application 2020 & 2033
- Table 10: Global Smart Contracts Software Revenue million Forecast, by Application 2020 & 2033
- Table 11: Global Smart Contracts Software Revenue million Forecast, by Types 2020 & 2033
- Table 12: Global Smart Contracts Software Revenue million Forecast, by Country 2020 & 2033
- Table 13: Brazil Smart Contracts Software Revenue (million) Forecast, by Application 2020 & 2033
- Table 14: Argentina Smart Contracts Software Revenue (million) Forecast, by Application 2020 & 2033
- Table 15: Rest of South America Smart Contracts Software Revenue (million) Forecast, by Application 2020 & 2033
- Table 16: Global Smart Contracts Software Revenue million Forecast, by Application 2020 & 2033
- Table 17: Global Smart Contracts Software Revenue million Forecast, by Types 2020 & 2033
- Table 18: Global Smart Contracts Software Revenue million Forecast, by Country 2020 & 2033
- Table 19: United Kingdom Smart Contracts Software Revenue (million) Forecast, by Application 2020 & 2033
- Table 20: Germany Smart Contracts Software Revenue (million) Forecast, by Application 2020 & 2033
- Table 21: France Smart Contracts Software Revenue (million) Forecast, by Application 2020 & 2033
- Table 22: Italy Smart Contracts Software Revenue (million) Forecast, by Application 2020 & 2033
- Table 23: Spain Smart Contracts Software Revenue (million) Forecast, by Application 2020 & 2033
- Table 24: Russia Smart Contracts Software Revenue (million) Forecast, by Application 2020 & 2033
- Table 25: Benelux Smart Contracts Software Revenue (million) Forecast, by Application 2020 & 2033
- Table 26: Nordics Smart Contracts Software Revenue (million) Forecast, by Application 2020 & 2033
- Table 27: Rest of Europe Smart Contracts Software Revenue (million) Forecast, by Application 2020 & 2033
- Table 28: Global Smart Contracts Software Revenue million Forecast, by Application 2020 & 2033
- Table 29: Global Smart Contracts Software Revenue million Forecast, by Types 2020 & 2033
- Table 30: Global Smart Contracts Software Revenue million Forecast, by Country 2020 & 2033
- Table 31: Turkey Smart Contracts Software Revenue (million) Forecast, by Application 2020 & 2033
- Table 32: Israel Smart Contracts Software Revenue (million) Forecast, by Application 2020 & 2033
- Table 33: GCC Smart Contracts Software Revenue (million) Forecast, by Application 2020 & 2033
- Table 34: North Africa Smart Contracts Software Revenue (million) Forecast, by Application 2020 & 2033
- Table 35: South Africa Smart Contracts Software Revenue (million) Forecast, by Application 2020 & 2033
- Table 36: Rest of Middle East & Africa Smart Contracts Software Revenue (million) Forecast, by Application 2020 & 2033
- Table 37: Global Smart Contracts Software Revenue million Forecast, by Application 2020 & 2033
- Table 38: Global Smart Contracts Software Revenue million Forecast, by Types 2020 & 2033
- Table 39: Global Smart Contracts Software Revenue million Forecast, by Country 2020 & 2033
- Table 40: China Smart Contracts Software Revenue (million) Forecast, by Application 2020 & 2033
- Table 41: India Smart Contracts Software Revenue (million) Forecast, by Application 2020 & 2033
- Table 42: Japan Smart Contracts Software Revenue (million) Forecast, by Application 2020 & 2033
- Table 43: South Korea Smart Contracts Software Revenue (million) Forecast, by Application 2020 & 2033
- Table 44: ASEAN Smart Contracts Software Revenue (million) Forecast, by Application 2020 & 2033
- Table 45: Oceania Smart Contracts Software Revenue (million) Forecast, by Application 2020 & 2033
- Table 46: Rest of Asia Pacific Smart Contracts Software Revenue (million) Forecast, by Application 2020 & 2033
Frequently Asked Questions
1. What is the projected Compound Annual Growth Rate (CAGR) of the Smart Contracts Software?
The projected CAGR is approximately 24.2%.
2. Which companies are prominent players in the Smart Contracts Software?
Key companies in the market include Ethereum, Corda, Hyperledger, Microsoft, DigiByte Holdings, æternity blockchain, AlphaPoint, AnChain.AI, BigchainDB, Bison Trails Co., BlockApps, Block Notary, Blockstream, ChromaWay, Chronicled, CloudFabrix Software, Credits, Digital Asset, IBM, Icertis, Kadena, Monax, Neo Team, Polymath, Riverr Pte. Ltd., Sanjh, Brickblock Digital Services, Symbiont, BlockCAT Technologies, OpenLaw.
3. What are the main segments of the Smart Contracts Software?
The market segments include Application, Types.
4. Can you provide details about the market size?
The market size is estimated to be USD 684.3 million as of 2022.
5. What are some drivers contributing to market growth?
N/A
6. What are the notable trends driving market growth?
N/A
7. Are there any restraints impacting market growth?
N/A
8. Can you provide examples of recent developments in the market?
N/A
9. What pricing options are available for accessing the report?
Pricing options include single-user, multi-user, and enterprise licenses priced at USD 4900.00, USD 7350.00, and USD 9800.00 respectively.
10. Is the market size provided in terms of value or volume?
The market size is provided in terms of value, measured in million.
11. Are there any specific market keywords associated with the report?
Yes, the market keyword associated with the report is "Smart Contracts Software," which aids in identifying and referencing the specific market segment covered.
12. How do I determine which pricing option suits my needs best?
The pricing options vary based on user requirements and access needs. Individual users may opt for single-user licenses, while businesses requiring broader access may choose multi-user or enterprise licenses for cost-effective access to the report.
13. Are there any additional resources or data provided in the Smart Contracts Software report?
While the report offers comprehensive insights, it's advisable to review the specific contents or supplementary materials provided to ascertain if additional resources or data are available.
14. How can I stay updated on further developments or reports in the Smart Contracts Software?
To stay informed about further developments, trends, and reports in the Smart Contracts Software, consider subscribing to industry newsletters, following relevant companies and organizations, or regularly checking reputable industry news sources and publications.
Methodology
Step 1 - Identification of Relevant Samples Size from Population Database


Step 2 - Approaches for Defining Global Market Size (Value, Volume* & Price*)

Note*: In applicable scenarios
Step 3 - Data Sources
Primary Research
- Web Analytics
- Survey Reports
- Research Institute
- Latest Research Reports
- Opinion Leaders
Secondary Research
- Annual Reports
- White Paper
- Latest Press Release
- Industry Association
- Paid Database
- Investor Presentations

Step 4 - Data Triangulation
Involves using different sources of information in order to increase the validity of a study
These sources are likely to be stakeholders in a program - participants, other researchers, program staff, other community members, and so on.
Then we put all data in single framework & apply various statistical tools to find out the dynamic on the market.
During the analysis stage, feedback from the stakeholder groups would be compared to determine areas of agreement as well as areas of divergence