

Key Insights
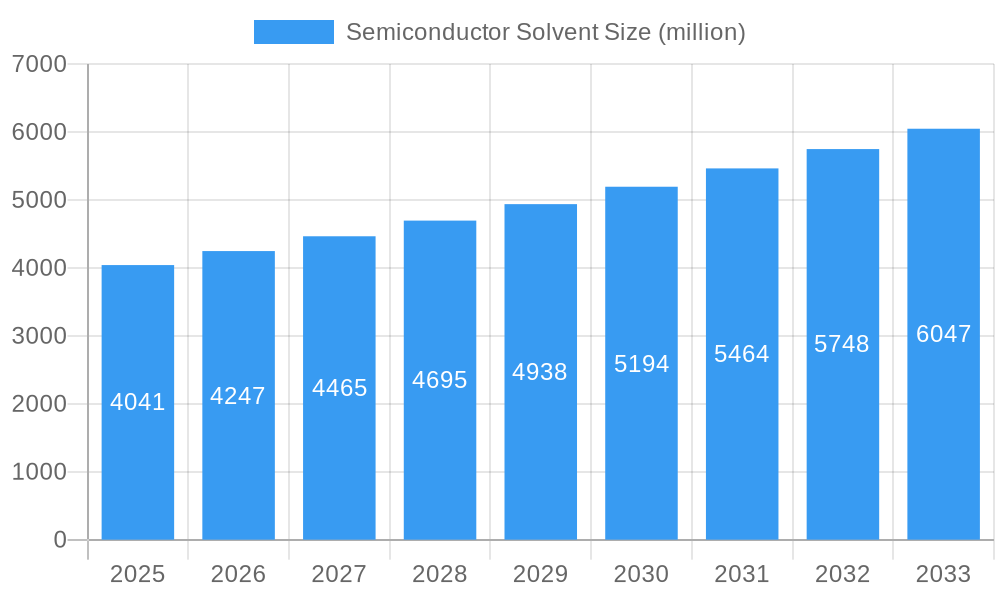
The semiconductor solvent market, valued at $4041 million in 2025, is projected to experience robust growth, driven by the escalating demand for advanced semiconductor devices in various applications, including 5G infrastructure, artificial intelligence, and the Internet of Things (IoT). The market's Compound Annual Growth Rate (CAGR) of 5.1% from 2019 to 2033 indicates a steady expansion. Key drivers include the increasing sophistication of semiconductor manufacturing processes necessitating high-purity solvents and the miniaturization of electronic components demanding specialized cleaning and etching solutions. Furthermore, government initiatives promoting technological advancements and investments in research and development within the semiconductor industry are bolstering market growth. While the market faces potential restraints such as stringent environmental regulations and fluctuating raw material prices, the continuous innovation in solvent technology, including the development of sustainable and environmentally friendly alternatives, is expected to mitigate these challenges. Leading players like Mitsubishi Chemical, Stella Chemifa, and BASF are actively shaping the market through strategic partnerships, product innovation, and geographic expansion.
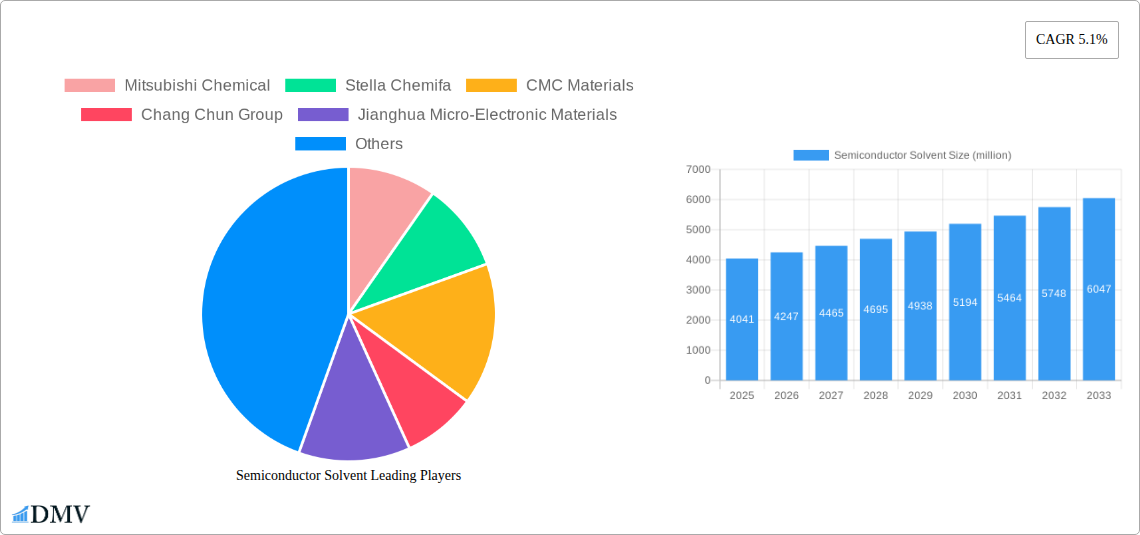
Semiconductor Solvent Market Size (In Billion)
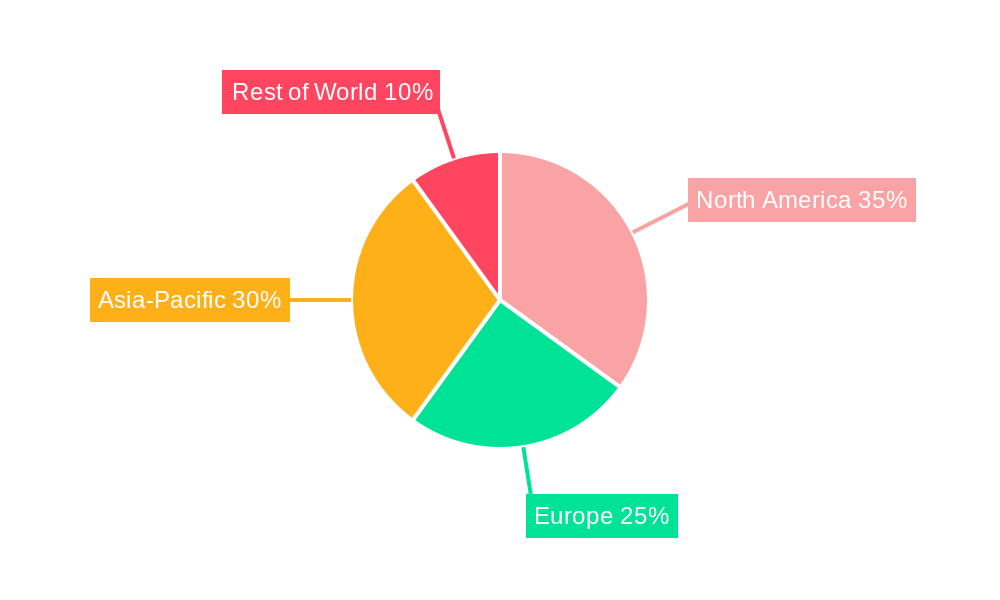
The forecast period of 2025-2033 presents significant opportunities for market expansion, particularly in emerging economies experiencing rapid technological growth. Regional variations in market share are anticipated, with North America and Asia-Pacific expected to dominate due to significant semiconductor manufacturing hubs and robust demand. However, the market will likely see increased competition as new players enter the market and existing companies consolidate their market positions through mergers and acquisitions. The continued development of advanced semiconductor nodes and the rising adoption of advanced packaging technologies will further stimulate demand for high-performance semiconductor solvents, shaping future market trends. The growth trajectory suggests a consistently expanding market with significant potential for investment and innovation in the coming decade.
Semiconductor Solvent Company Market Share
Semiconductor Solvent Market Report: A Comprehensive Analysis (2019-2033)
This insightful report provides a comprehensive analysis of the global semiconductor solvent market, offering a detailed examination of market dynamics, growth drivers, and future opportunities from 2019 to 2033. The study covers key players like Mitsubishi Chemical, Stella Chemifa, CMC Materials, Chang Chun Group, Jianghua Micro-Electronic Materials, Crystal Clear Electronic Material, Honeywell, BASF, and Avantor, providing crucial insights for stakeholders across the semiconductor value chain. With a base year of 2025 and a forecast period spanning 2025-2033, this report is an invaluable resource for strategic decision-making. The market is projected to reach xx million by 2033, showcasing significant growth potential.
Semiconductor Solvent Market Composition & Trends
This section delves into the intricate structure of the semiconductor solvent market, analyzing market concentration, innovative advancements, regulatory frameworks, substitute products, end-user profiles, and mergers & acquisitions (M&A) activities. We examine the market share distribution among key players, revealing the competitive landscape and identifying dominant forces. For instance, the combined market share of the top three players, estimated at xx million in 2025, is expected to fluctuate due to ongoing M&A activities. Deal values have reached into the hundreds of millions in recent years, significantly impacting market dynamics.
- Market Concentration: Highly concentrated, with top 5 players controlling approximately xx% of the market in 2025.
- Innovation Catalysts: Stringent purity requirements and the push for advanced node semiconductor manufacturing drive continuous innovation.
- Regulatory Landscape: Stringent environmental regulations impacting solvent selection and disposal methods.
- Substitute Products: Limited viable substitutes, enhancing the market's resilience.
- End-User Profiles: Primarily integrated device manufacturers (IDMs) and outsourced semiconductor assembly and test (OSAT) companies.
- M&A Activities: Significant M&A activity observed in the historical period (2019-2024), with deal values exceeding xx million annually. These activities are expected to continue driving market consolidation.
Semiconductor Solvent Industry Evolution
This section provides a detailed analysis of the semiconductor solvent market's evolutionary trajectory, tracing its growth, technological breakthroughs, and changing consumer demands from 2019 to 2033. The market experienced a Compound Annual Growth Rate (CAGR) of xx% during the historical period (2019-2024), driven primarily by the booming demand for advanced semiconductor devices. Technological advancements such as the adoption of EUV lithography and the rise of 3D packaging have significantly influenced solvent demand. Further growth is anticipated with the rise of AI and 5G technologies, driving a projected CAGR of xx% during the forecast period (2025-2033). Adoption rates of new solvent technologies are expected to increase by xx% annually over the forecast period. Specific data points on growth rates and adoption metrics for various solvent types are included within the full report.
Leading Regions, Countries, or Segments in Semiconductor Solvent
This section identifies the leading regions, countries, or segments within the semiconductor solvent market. Asia, particularly East Asia (Taiwan, South Korea, and China), holds the dominant position, accounting for over xx% of the global market in 2025. This dominance is fueled by the concentration of major semiconductor manufacturing facilities in this region.
- Key Drivers in East Asia:
- Massive investments in semiconductor fabrication plants (fabs).
- Supportive government policies promoting domestic semiconductor industries.
- Strong presence of leading semiconductor manufacturers.
The detailed analysis within the full report explores the specific factors contributing to the dominance of East Asia, providing insights into investment trends, regional regulations, and the concentration of manufacturing hubs. The report also examines the growth potential of other regions, such as North America and Europe, considering their unique market dynamics.
Semiconductor Solvent Product Innovations
Recent years have witnessed significant innovations in semiconductor solvents, focusing on improved purity, reduced environmental impact, and enhanced performance. Manufacturers are developing specialized solvents tailored to the needs of advanced semiconductor manufacturing processes, addressing the stringent requirements of EUV lithography and other cutting-edge technologies. These innovations include the introduction of solvents with lower volatile organic compound (VOC) content and improved compatibility with advanced materials. The unique selling propositions of these new solvents often center around higher purity levels, leading to enhanced yield and reduced defects in semiconductor manufacturing.
Propelling Factors for Semiconductor Solvent Growth
The growth of the semiconductor solvent market is propelled by several key factors. The ever-increasing demand for advanced semiconductors in electronics, automotive, and industrial applications is a primary driver. Technological advancements, particularly in advanced node semiconductor manufacturing, necessitate specialized solvents with higher purity levels. Furthermore, supportive government policies and substantial investments in the semiconductor industry fuel market expansion. The increasing adoption of 5G and AI technologies further strengthens the demand for high-quality semiconductor devices, consequently boosting the demand for semiconductor solvents.
Obstacles in the Semiconductor Solvent Market
The semiconductor solvent market faces certain challenges. Stringent environmental regulations impose constraints on solvent usage and disposal, increasing costs for manufacturers. Supply chain disruptions, particularly the impact of geopolitical uncertainties, can lead to material shortages and price volatility. Intense competition among established players and new entrants also puts pressure on profit margins. The estimated impact of these constraints on market growth is quantified within the full report.
Future Opportunities in Semiconductor Solvent
Future opportunities lie in the development of eco-friendly solvents and the expansion into new applications. The rising demand for advanced packaging technologies presents a significant growth avenue. Further advancements in materials science and semiconductor manufacturing processes will continue to shape solvent requirements, creating opportunities for specialized solvent development and innovation. Exploring new markets, such as emerging economies with growing semiconductor industries, presents further expansion opportunities.
Major Players in the Semiconductor Solvent Ecosystem
- Mitsubishi Chemical
- Stella Chemifa
- CMC Materials
- Chang Chun Group
- Jianghua Micro-Electronic Materials
- Crystal Clear Electronic Material
- Honeywell
- BASF
- Avantor
Key Developments in Semiconductor Solvent Industry
- 2022-Q4: Avantor announced a significant expansion of its semiconductor solvent production capacity.
- 2023-Q1: Mitsubishi Chemical launched a new line of high-purity solvents optimized for EUV lithography.
- 2023-Q2: A major merger between two smaller semiconductor solvent manufacturers reshaped the market landscape. (Further details are provided in the full report)
Strategic Semiconductor Solvent Market Forecast
The semiconductor solvent market is poised for robust growth, driven by sustained demand from the electronics and automotive sectors. Technological advancements in semiconductor manufacturing, particularly the development of advanced nodes, will continue to drive demand for high-purity solvents. The emergence of new applications in areas such as AI and 5G technology further strengthens the market outlook. The forecast anticipates substantial market expansion, with a projected value exceeding xx million by 2033, creating significant opportunities for players in this dynamic market.
Semiconductor Solvent Segmentation
-
1. Application
- 1.1. IDM Companies
- 1.2. Foundry Companies
-
2. Type
- 2.1. Ultra High Purity Reagents
- 2.2. Functional Chemicals
Semiconductor Solvent Segmentation By Geography
-
1. North America
- 1.1. United States
- 1.2. Canada
- 1.3. Mexico
-
2. South America
- 2.1. Brazil
- 2.2. Argentina
- 2.3. Rest of South America
-
3. Europe
- 3.1. United Kingdom
- 3.2. Germany
- 3.3. France
- 3.4. Italy
- 3.5. Spain
- 3.6. Russia
- 3.7. Benelux
- 3.8. Nordics
- 3.9. Rest of Europe
-
4. Middle East & Africa
- 4.1. Turkey
- 4.2. Israel
- 4.3. GCC
- 4.4. North Africa
- 4.5. South Africa
- 4.6. Rest of Middle East & Africa
-
5. Asia Pacific
- 5.1. China
- 5.2. India
- 5.3. Japan
- 5.4. South Korea
- 5.5. ASEAN
- 5.6. Oceania
- 5.7. Rest of Asia Pacific
Semiconductor Solvent Regional Market Share
Geographic Coverage of Semiconductor Solvent
Semiconductor Solvent REPORT HIGHLIGHTS
| Aspects | Details |
|---|---|
| Study Period | 2020-2034 |
| Base Year | 2025 |
| Estimated Year | 2026 |
| Forecast Period | 2026-2034 |
| Historical Period | 2020-2025 |
| Growth Rate | CAGR of 5.1% from 2020-2034 |
| Segmentation |
|
Table of Contents
- 1. Introduction
- 1.1. Research Scope
- 1.2. Market Segmentation
- 1.3. Research Objective
- 1.4. Definitions and Assumptions
- 2. Executive Summary
- 2.1. Market Snapshot
- 3. Market Dynamics
- 3.1. Market Drivers
- 3.2. Market Restrains
- 3.3. Market Trends
- 3.4. Market Opportunities
- 4. Market Factor Analysis
- 4.1. Porters Five Forces
- 4.1.1. Bargaining Power of Suppliers
- 4.1.2. Bargaining Power of Buyers
- 4.1.3. Threat of New Entrants
- 4.1.4. Threat of Substitutes
- 4.1.5. Competitive Rivalry
- 4.2. PESTEL analysis
- 4.3. BCG Analysis
- 4.3.1. Stars (High Growth, High Market Share)
- 4.3.2. Cash Cows (Low Growth, High Market Share)
- 4.3.3. Question Mark (High Growth, Low Market Share)
- 4.3.4. Dogs (Low Growth, Low Market Share)
- 4.4. Ansoff Matrix Analysis
- 4.5. Supply Chain Analysis
- 4.6. Regulatory Landscape
- 4.7. Current Market Potential and Opportunity Assessment (TAM–SAM–SOM Framework)
- 4.8. DMV Analyst Note
- 4.1. Porters Five Forces
- 5. Market Analysis, Insights and Forecast 2021-2033
- 5.1. Market Analysis, Insights and Forecast - by Application
- 5.1.1. IDM Companies
- 5.1.2. Foundry Companies
- 5.2. Market Analysis, Insights and Forecast - by Type
- 5.2.1. Ultra High Purity Reagents
- 5.2.2. Functional Chemicals
- 5.3. Market Analysis, Insights and Forecast - by Region
- 5.3.1. North America
- 5.3.2. South America
- 5.3.3. Europe
- 5.3.4. Middle East & Africa
- 5.3.5. Asia Pacific
- 5.1. Market Analysis, Insights and Forecast - by Application
- 6. Global Semiconductor Solvent Analysis, Insights and Forecast, 2021-2033
- 6.1. Market Analysis, Insights and Forecast - by Application
- 6.1.1. IDM Companies
- 6.1.2. Foundry Companies
- 6.2. Market Analysis, Insights and Forecast - by Type
- 6.2.1. Ultra High Purity Reagents
- 6.2.2. Functional Chemicals
- 6.1. Market Analysis, Insights and Forecast - by Application
- 7. North America Semiconductor Solvent Analysis, Insights and Forecast, 2020-2032
- 7.1. Market Analysis, Insights and Forecast - by Application
- 7.1.1. IDM Companies
- 7.1.2. Foundry Companies
- 7.2. Market Analysis, Insights and Forecast - by Type
- 7.2.1. Ultra High Purity Reagents
- 7.2.2. Functional Chemicals
- 7.1. Market Analysis, Insights and Forecast - by Application
- 8. South America Semiconductor Solvent Analysis, Insights and Forecast, 2020-2032
- 8.1. Market Analysis, Insights and Forecast - by Application
- 8.1.1. IDM Companies
- 8.1.2. Foundry Companies
- 8.2. Market Analysis, Insights and Forecast - by Type
- 8.2.1. Ultra High Purity Reagents
- 8.2.2. Functional Chemicals
- 8.1. Market Analysis, Insights and Forecast - by Application
- 9. Europe Semiconductor Solvent Analysis, Insights and Forecast, 2020-2032
- 9.1. Market Analysis, Insights and Forecast - by Application
- 9.1.1. IDM Companies
- 9.1.2. Foundry Companies
- 9.2. Market Analysis, Insights and Forecast - by Type
- 9.2.1. Ultra High Purity Reagents
- 9.2.2. Functional Chemicals
- 9.1. Market Analysis, Insights and Forecast - by Application
- 10. Middle East & Africa Semiconductor Solvent Analysis, Insights and Forecast, 2020-2032
- 10.1. Market Analysis, Insights and Forecast - by Application
- 10.1.1. IDM Companies
- 10.1.2. Foundry Companies
- 10.2. Market Analysis, Insights and Forecast - by Type
- 10.2.1. Ultra High Purity Reagents
- 10.2.2. Functional Chemicals
- 10.1. Market Analysis, Insights and Forecast - by Application
- 11. Asia Pacific Semiconductor Solvent Analysis, Insights and Forecast, 2020-2032
- 11.1. Market Analysis, Insights and Forecast - by Application
- 11.1.1. IDM Companies
- 11.1.2. Foundry Companies
- 11.2. Market Analysis, Insights and Forecast - by Type
- 11.2.1. Ultra High Purity Reagents
- 11.2.2. Functional Chemicals
- 11.1. Market Analysis, Insights and Forecast - by Application
- 12. Competitive Analysis
- 12.1. Company Profiles
- 12.1.1 Mitsubishi Chemical
- 12.1.1.1. Company Overview
- 12.1.1.2. Products
- 12.1.1.3. Company Financials
- 12.1.1.4. SWOT Analysis
- 12.1.2 Stella Chemifa
- 12.1.2.1. Company Overview
- 12.1.2.2. Products
- 12.1.2.3. Company Financials
- 12.1.2.4. SWOT Analysis
- 12.1.3 CMC Materials
- 12.1.3.1. Company Overview
- 12.1.3.2. Products
- 12.1.3.3. Company Financials
- 12.1.3.4. SWOT Analysis
- 12.1.4 Chang Chun Group
- 12.1.4.1. Company Overview
- 12.1.4.2. Products
- 12.1.4.3. Company Financials
- 12.1.4.4. SWOT Analysis
- 12.1.5 Jianghua Micro-Electronic Materials
- 12.1.5.1. Company Overview
- 12.1.5.2. Products
- 12.1.5.3. Company Financials
- 12.1.5.4. SWOT Analysis
- 12.1.6 Crystal Clear Electronic Material
- 12.1.6.1. Company Overview
- 12.1.6.2. Products
- 12.1.6.3. Company Financials
- 12.1.6.4. SWOT Analysis
- 12.1.7 Honeywell
- 12.1.7.1. Company Overview
- 12.1.7.2. Products
- 12.1.7.3. Company Financials
- 12.1.7.4. SWOT Analysis
- 12.1.8 BASF
- 12.1.8.1. Company Overview
- 12.1.8.2. Products
- 12.1.8.3. Company Financials
- 12.1.8.4. SWOT Analysis
- 12.1.9 Avantor
- 12.1.9.1. Company Overview
- 12.1.9.2. Products
- 12.1.9.3. Company Financials
- 12.1.9.4. SWOT Analysis
- 12.1.1 Mitsubishi Chemical
- 12.2. Market Entropy
- 12.2.1 Company's Key Areas Served
- 12.2.2 Recent Developments
- 12.3. Company Market Share Analysis 2025
- 12.3.1 Top 5 Companies Market Share Analysis
- 12.3.2 Top 3 Companies Market Share Analysis
- 12.4. List of Potential Customers
- 13. Research Methodology
List of Figures
- Figure 1: Global Semiconductor Solvent Revenue Breakdown (million, %) by Region 2025 & 2033
- Figure 2: Global Semiconductor Solvent Volume Breakdown (K, %) by Region 2025 & 2033
- Figure 3: North America Semiconductor Solvent Revenue (million), by Application 2025 & 2033
- Figure 4: North America Semiconductor Solvent Volume (K), by Application 2025 & 2033
- Figure 5: North America Semiconductor Solvent Revenue Share (%), by Application 2025 & 2033
- Figure 6: North America Semiconductor Solvent Volume Share (%), by Application 2025 & 2033
- Figure 7: North America Semiconductor Solvent Revenue (million), by Type 2025 & 2033
- Figure 8: North America Semiconductor Solvent Volume (K), by Type 2025 & 2033
- Figure 9: North America Semiconductor Solvent Revenue Share (%), by Type 2025 & 2033
- Figure 10: North America Semiconductor Solvent Volume Share (%), by Type 2025 & 2033
- Figure 11: North America Semiconductor Solvent Revenue (million), by Country 2025 & 2033
- Figure 12: North America Semiconductor Solvent Volume (K), by Country 2025 & 2033
- Figure 13: North America Semiconductor Solvent Revenue Share (%), by Country 2025 & 2033
- Figure 14: North America Semiconductor Solvent Volume Share (%), by Country 2025 & 2033
- Figure 15: South America Semiconductor Solvent Revenue (million), by Application 2025 & 2033
- Figure 16: South America Semiconductor Solvent Volume (K), by Application 2025 & 2033
- Figure 17: South America Semiconductor Solvent Revenue Share (%), by Application 2025 & 2033
- Figure 18: South America Semiconductor Solvent Volume Share (%), by Application 2025 & 2033
- Figure 19: South America Semiconductor Solvent Revenue (million), by Type 2025 & 2033
- Figure 20: South America Semiconductor Solvent Volume (K), by Type 2025 & 2033
- Figure 21: South America Semiconductor Solvent Revenue Share (%), by Type 2025 & 2033
- Figure 22: South America Semiconductor Solvent Volume Share (%), by Type 2025 & 2033
- Figure 23: South America Semiconductor Solvent Revenue (million), by Country 2025 & 2033
- Figure 24: South America Semiconductor Solvent Volume (K), by Country 2025 & 2033
- Figure 25: South America Semiconductor Solvent Revenue Share (%), by Country 2025 & 2033
- Figure 26: South America Semiconductor Solvent Volume Share (%), by Country 2025 & 2033
- Figure 27: Europe Semiconductor Solvent Revenue (million), by Application 2025 & 2033
- Figure 28: Europe Semiconductor Solvent Volume (K), by Application 2025 & 2033
- Figure 29: Europe Semiconductor Solvent Revenue Share (%), by Application 2025 & 2033
- Figure 30: Europe Semiconductor Solvent Volume Share (%), by Application 2025 & 2033
- Figure 31: Europe Semiconductor Solvent Revenue (million), by Type 2025 & 2033
- Figure 32: Europe Semiconductor Solvent Volume (K), by Type 2025 & 2033
- Figure 33: Europe Semiconductor Solvent Revenue Share (%), by Type 2025 & 2033
- Figure 34: Europe Semiconductor Solvent Volume Share (%), by Type 2025 & 2033
- Figure 35: Europe Semiconductor Solvent Revenue (million), by Country 2025 & 2033
- Figure 36: Europe Semiconductor Solvent Volume (K), by Country 2025 & 2033
- Figure 37: Europe Semiconductor Solvent Revenue Share (%), by Country 2025 & 2033
- Figure 38: Europe Semiconductor Solvent Volume Share (%), by Country 2025 & 2033
- Figure 39: Middle East & Africa Semiconductor Solvent Revenue (million), by Application 2025 & 2033
- Figure 40: Middle East & Africa Semiconductor Solvent Volume (K), by Application 2025 & 2033
- Figure 41: Middle East & Africa Semiconductor Solvent Revenue Share (%), by Application 2025 & 2033
- Figure 42: Middle East & Africa Semiconductor Solvent Volume Share (%), by Application 2025 & 2033
- Figure 43: Middle East & Africa Semiconductor Solvent Revenue (million), by Type 2025 & 2033
- Figure 44: Middle East & Africa Semiconductor Solvent Volume (K), by Type 2025 & 2033
- Figure 45: Middle East & Africa Semiconductor Solvent Revenue Share (%), by Type 2025 & 2033
- Figure 46: Middle East & Africa Semiconductor Solvent Volume Share (%), by Type 2025 & 2033
- Figure 47: Middle East & Africa Semiconductor Solvent Revenue (million), by Country 2025 & 2033
- Figure 48: Middle East & Africa Semiconductor Solvent Volume (K), by Country 2025 & 2033
- Figure 49: Middle East & Africa Semiconductor Solvent Revenue Share (%), by Country 2025 & 2033
- Figure 50: Middle East & Africa Semiconductor Solvent Volume Share (%), by Country 2025 & 2033
- Figure 51: Asia Pacific Semiconductor Solvent Revenue (million), by Application 2025 & 2033
- Figure 52: Asia Pacific Semiconductor Solvent Volume (K), by Application 2025 & 2033
- Figure 53: Asia Pacific Semiconductor Solvent Revenue Share (%), by Application 2025 & 2033
- Figure 54: Asia Pacific Semiconductor Solvent Volume Share (%), by Application 2025 & 2033
- Figure 55: Asia Pacific Semiconductor Solvent Revenue (million), by Type 2025 & 2033
- Figure 56: Asia Pacific Semiconductor Solvent Volume (K), by Type 2025 & 2033
- Figure 57: Asia Pacific Semiconductor Solvent Revenue Share (%), by Type 2025 & 2033
- Figure 58: Asia Pacific Semiconductor Solvent Volume Share (%), by Type 2025 & 2033
- Figure 59: Asia Pacific Semiconductor Solvent Revenue (million), by Country 2025 & 2033
- Figure 60: Asia Pacific Semiconductor Solvent Volume (K), by Country 2025 & 2033
- Figure 61: Asia Pacific Semiconductor Solvent Revenue Share (%), by Country 2025 & 2033
- Figure 62: Asia Pacific Semiconductor Solvent Volume Share (%), by Country 2025 & 2033
List of Tables
- Table 1: Global Semiconductor Solvent Revenue million Forecast, by Application 2020 & 2033
- Table 2: Global Semiconductor Solvent Volume K Forecast, by Application 2020 & 2033
- Table 3: Global Semiconductor Solvent Revenue million Forecast, by Type 2020 & 2033
- Table 4: Global Semiconductor Solvent Volume K Forecast, by Type 2020 & 2033
- Table 5: Global Semiconductor Solvent Revenue million Forecast, by Region 2020 & 2033
- Table 6: Global Semiconductor Solvent Volume K Forecast, by Region 2020 & 2033
- Table 7: Global Semiconductor Solvent Revenue million Forecast, by Application 2020 & 2033
- Table 8: Global Semiconductor Solvent Volume K Forecast, by Application 2020 & 2033
- Table 9: Global Semiconductor Solvent Revenue million Forecast, by Type 2020 & 2033
- Table 10: Global Semiconductor Solvent Volume K Forecast, by Type 2020 & 2033
- Table 11: Global Semiconductor Solvent Revenue million Forecast, by Country 2020 & 2033
- Table 12: Global Semiconductor Solvent Volume K Forecast, by Country 2020 & 2033
- Table 13: United States Semiconductor Solvent Revenue (million) Forecast, by Application 2020 & 2033
- Table 14: United States Semiconductor Solvent Volume (K) Forecast, by Application 2020 & 2033
- Table 15: Canada Semiconductor Solvent Revenue (million) Forecast, by Application 2020 & 2033
- Table 16: Canada Semiconductor Solvent Volume (K) Forecast, by Application 2020 & 2033
- Table 17: Mexico Semiconductor Solvent Revenue (million) Forecast, by Application 2020 & 2033
- Table 18: Mexico Semiconductor Solvent Volume (K) Forecast, by Application 2020 & 2033
- Table 19: Global Semiconductor Solvent Revenue million Forecast, by Application 2020 & 2033
- Table 20: Global Semiconductor Solvent Volume K Forecast, by Application 2020 & 2033
- Table 21: Global Semiconductor Solvent Revenue million Forecast, by Type 2020 & 2033
- Table 22: Global Semiconductor Solvent Volume K Forecast, by Type 2020 & 2033
- Table 23: Global Semiconductor Solvent Revenue million Forecast, by Country 2020 & 2033
- Table 24: Global Semiconductor Solvent Volume K Forecast, by Country 2020 & 2033
- Table 25: Brazil Semiconductor Solvent Revenue (million) Forecast, by Application 2020 & 2033
- Table 26: Brazil Semiconductor Solvent Volume (K) Forecast, by Application 2020 & 2033
- Table 27: Argentina Semiconductor Solvent Revenue (million) Forecast, by Application 2020 & 2033
- Table 28: Argentina Semiconductor Solvent Volume (K) Forecast, by Application 2020 & 2033
- Table 29: Rest of South America Semiconductor Solvent Revenue (million) Forecast, by Application 2020 & 2033
- Table 30: Rest of South America Semiconductor Solvent Volume (K) Forecast, by Application 2020 & 2033
- Table 31: Global Semiconductor Solvent Revenue million Forecast, by Application 2020 & 2033
- Table 32: Global Semiconductor Solvent Volume K Forecast, by Application 2020 & 2033
- Table 33: Global Semiconductor Solvent Revenue million Forecast, by Type 2020 & 2033
- Table 34: Global Semiconductor Solvent Volume K Forecast, by Type 2020 & 2033
- Table 35: Global Semiconductor Solvent Revenue million Forecast, by Country 2020 & 2033
- Table 36: Global Semiconductor Solvent Volume K Forecast, by Country 2020 & 2033
- Table 37: United Kingdom Semiconductor Solvent Revenue (million) Forecast, by Application 2020 & 2033
- Table 38: United Kingdom Semiconductor Solvent Volume (K) Forecast, by Application 2020 & 2033
- Table 39: Germany Semiconductor Solvent Revenue (million) Forecast, by Application 2020 & 2033
- Table 40: Germany Semiconductor Solvent Volume (K) Forecast, by Application 2020 & 2033
- Table 41: France Semiconductor Solvent Revenue (million) Forecast, by Application 2020 & 2033
- Table 42: France Semiconductor Solvent Volume (K) Forecast, by Application 2020 & 2033
- Table 43: Italy Semiconductor Solvent Revenue (million) Forecast, by Application 2020 & 2033
- Table 44: Italy Semiconductor Solvent Volume (K) Forecast, by Application 2020 & 2033
- Table 45: Spain Semiconductor Solvent Revenue (million) Forecast, by Application 2020 & 2033
- Table 46: Spain Semiconductor Solvent Volume (K) Forecast, by Application 2020 & 2033
- Table 47: Russia Semiconductor Solvent Revenue (million) Forecast, by Application 2020 & 2033
- Table 48: Russia Semiconductor Solvent Volume (K) Forecast, by Application 2020 & 2033
- Table 49: Benelux Semiconductor Solvent Revenue (million) Forecast, by Application 2020 & 2033
- Table 50: Benelux Semiconductor Solvent Volume (K) Forecast, by Application 2020 & 2033
- Table 51: Nordics Semiconductor Solvent Revenue (million) Forecast, by Application 2020 & 2033
- Table 52: Nordics Semiconductor Solvent Volume (K) Forecast, by Application 2020 & 2033
- Table 53: Rest of Europe Semiconductor Solvent Revenue (million) Forecast, by Application 2020 & 2033
- Table 54: Rest of Europe Semiconductor Solvent Volume (K) Forecast, by Application 2020 & 2033
- Table 55: Global Semiconductor Solvent Revenue million Forecast, by Application 2020 & 2033
- Table 56: Global Semiconductor Solvent Volume K Forecast, by Application 2020 & 2033
- Table 57: Global Semiconductor Solvent Revenue million Forecast, by Type 2020 & 2033
- Table 58: Global Semiconductor Solvent Volume K Forecast, by Type 2020 & 2033
- Table 59: Global Semiconductor Solvent Revenue million Forecast, by Country 2020 & 2033
- Table 60: Global Semiconductor Solvent Volume K Forecast, by Country 2020 & 2033
- Table 61: Turkey Semiconductor Solvent Revenue (million) Forecast, by Application 2020 & 2033
- Table 62: Turkey Semiconductor Solvent Volume (K) Forecast, by Application 2020 & 2033
- Table 63: Israel Semiconductor Solvent Revenue (million) Forecast, by Application 2020 & 2033
- Table 64: Israel Semiconductor Solvent Volume (K) Forecast, by Application 2020 & 2033
- Table 65: GCC Semiconductor Solvent Revenue (million) Forecast, by Application 2020 & 2033
- Table 66: GCC Semiconductor Solvent Volume (K) Forecast, by Application 2020 & 2033
- Table 67: North Africa Semiconductor Solvent Revenue (million) Forecast, by Application 2020 & 2033
- Table 68: North Africa Semiconductor Solvent Volume (K) Forecast, by Application 2020 & 2033
- Table 69: South Africa Semiconductor Solvent Revenue (million) Forecast, by Application 2020 & 2033
- Table 70: South Africa Semiconductor Solvent Volume (K) Forecast, by Application 2020 & 2033
- Table 71: Rest of Middle East & Africa Semiconductor Solvent Revenue (million) Forecast, by Application 2020 & 2033
- Table 72: Rest of Middle East & Africa Semiconductor Solvent Volume (K) Forecast, by Application 2020 & 2033
- Table 73: Global Semiconductor Solvent Revenue million Forecast, by Application 2020 & 2033
- Table 74: Global Semiconductor Solvent Volume K Forecast, by Application 2020 & 2033
- Table 75: Global Semiconductor Solvent Revenue million Forecast, by Type 2020 & 2033
- Table 76: Global Semiconductor Solvent Volume K Forecast, by Type 2020 & 2033
- Table 77: Global Semiconductor Solvent Revenue million Forecast, by Country 2020 & 2033
- Table 78: Global Semiconductor Solvent Volume K Forecast, by Country 2020 & 2033
- Table 79: China Semiconductor Solvent Revenue (million) Forecast, by Application 2020 & 2033
- Table 80: China Semiconductor Solvent Volume (K) Forecast, by Application 2020 & 2033
- Table 81: India Semiconductor Solvent Revenue (million) Forecast, by Application 2020 & 2033
- Table 82: India Semiconductor Solvent Volume (K) Forecast, by Application 2020 & 2033
- Table 83: Japan Semiconductor Solvent Revenue (million) Forecast, by Application 2020 & 2033
- Table 84: Japan Semiconductor Solvent Volume (K) Forecast, by Application 2020 & 2033
- Table 85: South Korea Semiconductor Solvent Revenue (million) Forecast, by Application 2020 & 2033
- Table 86: South Korea Semiconductor Solvent Volume (K) Forecast, by Application 2020 & 2033
- Table 87: ASEAN Semiconductor Solvent Revenue (million) Forecast, by Application 2020 & 2033
- Table 88: ASEAN Semiconductor Solvent Volume (K) Forecast, by Application 2020 & 2033
- Table 89: Oceania Semiconductor Solvent Revenue (million) Forecast, by Application 2020 & 2033
- Table 90: Oceania Semiconductor Solvent Volume (K) Forecast, by Application 2020 & 2033
- Table 91: Rest of Asia Pacific Semiconductor Solvent Revenue (million) Forecast, by Application 2020 & 2033
- Table 92: Rest of Asia Pacific Semiconductor Solvent Volume (K) Forecast, by Application 2020 & 2033
Frequently Asked Questions
1. What is the projected Compound Annual Growth Rate (CAGR) of the Semiconductor Solvent?
The projected CAGR is approximately 5.1%.
2. Which companies are prominent players in the Semiconductor Solvent?
Key companies in the market include Mitsubishi Chemical, Stella Chemifa, CMC Materials, Chang Chun Group, Jianghua Micro-Electronic Materials, Crystal Clear Electronic Material, Honeywell, BASF, Avantor.
3. What are the main segments of the Semiconductor Solvent?
The market segments include Application, Type.
4. Can you provide details about the market size?
The market size is estimated to be USD 4041 million as of 2022.
5. What are some drivers contributing to market growth?
N/A
6. What are the notable trends driving market growth?
N/A
7. Are there any restraints impacting market growth?
N/A
8. Can you provide examples of recent developments in the market?
N/A
9. What pricing options are available for accessing the report?
Pricing options include single-user, multi-user, and enterprise licenses priced at USD 3950.00, USD 5925.00, and USD 7900.00 respectively.
10. Is the market size provided in terms of value or volume?
The market size is provided in terms of value, measured in million and volume, measured in K.
11. Are there any specific market keywords associated with the report?
Yes, the market keyword associated with the report is "Semiconductor Solvent," which aids in identifying and referencing the specific market segment covered.
12. How do I determine which pricing option suits my needs best?
The pricing options vary based on user requirements and access needs. Individual users may opt for single-user licenses, while businesses requiring broader access may choose multi-user or enterprise licenses for cost-effective access to the report.
13. Are there any additional resources or data provided in the Semiconductor Solvent report?
While the report offers comprehensive insights, it's advisable to review the specific contents or supplementary materials provided to ascertain if additional resources or data are available.
14. How can I stay updated on further developments or reports in the Semiconductor Solvent?
To stay informed about further developments, trends, and reports in the Semiconductor Solvent, consider subscribing to industry newsletters, following relevant companies and organizations, or regularly checking reputable industry news sources and publications.
Methodology
Step 1 - Identification of Relevant Samples Size from Population Database


Step 2 - Approaches for Defining Global Market Size (Value, Volume* & Price*)

Note*: In applicable scenarios
Step 3 - Data Sources
Primary Research
- Web Analytics
- Survey Reports
- Research Institute
- Latest Research Reports
- Opinion Leaders
Secondary Research
- Annual Reports
- White Paper
- Latest Press Release
- Industry Association
- Paid Database
- Investor Presentations

Step 4 - Data Triangulation
Involves using different sources of information in order to increase the validity of a study
These sources are likely to be stakeholders in a program - participants, other researchers, program staff, other community members, and so on.
Then we put all data in single framework & apply various statistical tools to find out the dynamic on the market.
During the analysis stage, feedback from the stakeholder groups would be compared to determine areas of agreement as well as areas of divergence