

Key Insights
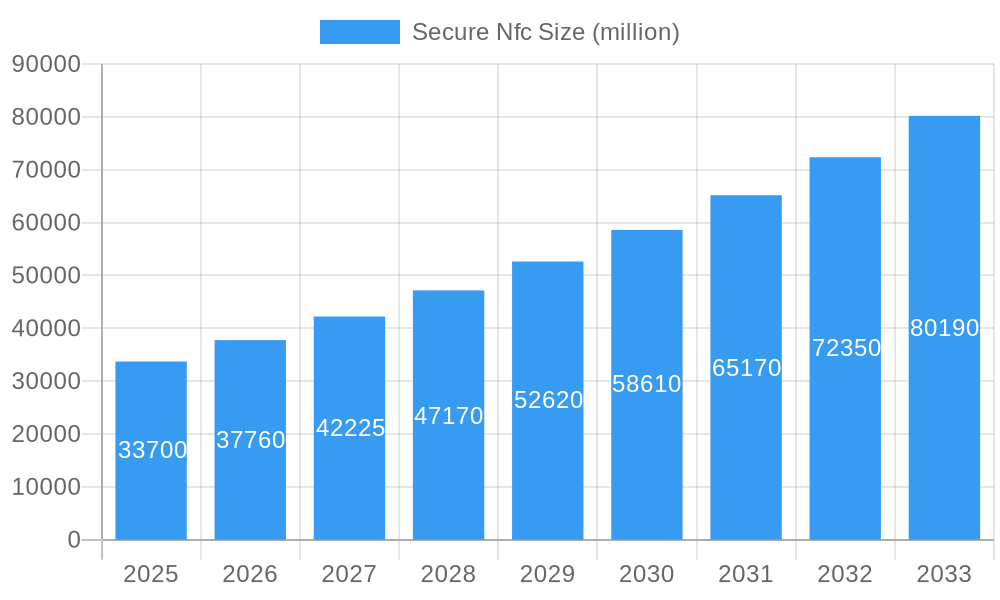
The Secure NFC market is poised for significant expansion, projected to reach an estimated $33.7 billion by 2025, driven by a robust CAGR of 13.1% through 2033. This substantial growth is fueled by the increasing adoption of contactless technologies across a diverse range of applications, including the rapidly evolving Automotive & Transportation sector, where NFC is integral for secure vehicle access and payments. The Consumer Electronics segment also continues to be a major contributor, with NFC enabling seamless connectivity and transaction capabilities in smartphones, wearables, and other smart devices. Furthermore, the Retail industry is leveraging NFC for enhanced payment experiences and inventory management, while BFSI institutions are increasingly deploying NFC for secure contactless transactions and identification. The Healthcare sector is also emerging as a key growth area, with NFC facilitating patient identification and secure data access.
Secure Nfc Market Size (In Billion)
The market's trajectory is further bolstered by advancements in NFC technology, particularly the development of higher-capacity byte formats (like 888 Bytes) enabling more complex data storage and transactions, and the continuous innovation from leading companies such as Broadcom Inc., HID Global, Intel Corporation, and Qualcomm Technologies, Inc. These players are actively developing and integrating advanced NFC solutions, addressing the growing demand for enhanced security features. While the proliferation of NFC-enabled devices and the convenience of contactless interactions are significant drivers, potential restraints may include the need for stringent security protocols to combat evolving cyber threats and the initial investment costs associated with widespread infrastructure upgrades. Nonetheless, the overarching trend towards a more connected and secure digital ecosystem strongly supports the sustained expansion of the Secure NFC market.
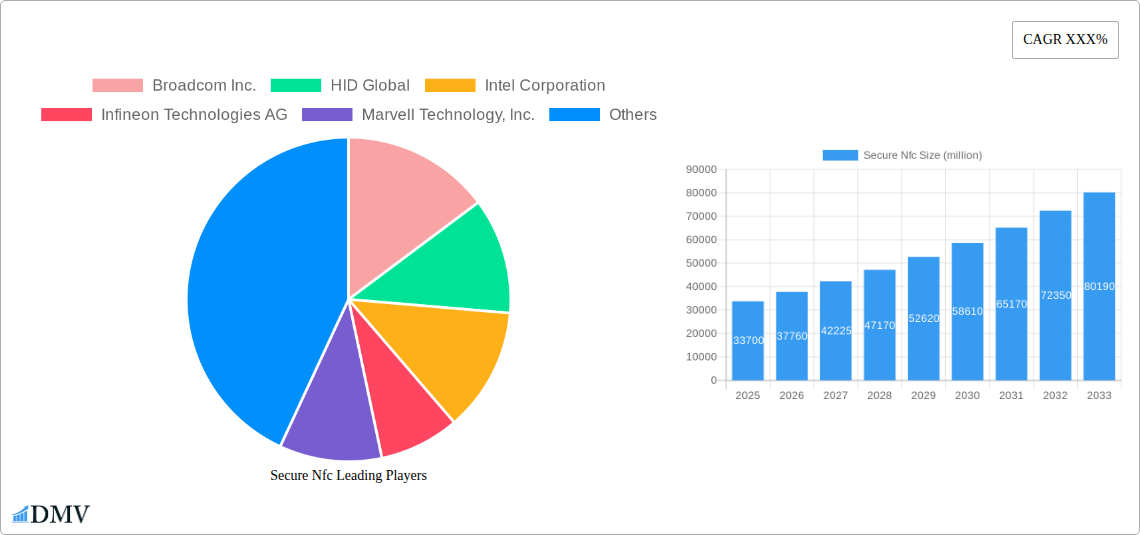
Secure Nfc Company Market Share
Secure NFC Market Composition & Trends
The Secure NFC market is characterized by a dynamic and evolving landscape, with an estimated market size projected to reach $XX billion by 2033. This report delves into the intricate composition of this burgeoning sector, examining the forces that shape its trajectory. We will dissect market concentration, identifying key players and their strategic positioning, alongside an analysis of innovation catalysts driving technological advancements. Understanding the regulatory frameworks and their impact on market access and product development is paramount. Furthermore, we will explore the threat of substitute products, assess the diverse end-user profiles across critical applications, and scrutinize recent and anticipated Mergers & Acquisitions (M&A) activities.
- Market Share Distribution: Analysis of market share held by leading companies, including Broadcom Inc., HID Global, Intel Corporation, Infineon Technologies AG, Marvell Technology, Inc., MediaTek Inc., Nordic Semiconductor, NXP Semiconductors N.V., Qualcomm Technologies, Inc., Renesas Electronics Corporation, Samsung Electronics Co., Ltd., Sony Corporation, STMicroelectronics N.V., and Texas Instruments Incorporated.
- M&A Deal Values: Quantifiable data on the financial scale of mergers and acquisitions, highlighting consolidation trends and strategic partnerships within the ecosystem.
- Innovation Catalysts: Identification of key technological breakthroughs and research initiatives propelling market growth.
- Regulatory Landscapes: Examination of government policies, industry standards, and compliance requirements influencing market entry and operations.
- Substitute Products Analysis: Evaluation of alternative technologies and their potential to displace NFC solutions.
- End-User Profiles: Detailed segmentation of consumer and enterprise needs across various applications.
Secure NFC Industry Evolution
The Secure NFC industry has witnessed a remarkable evolution from 2019 to 2024, a period marked by foundational growth and increasing adoption. This report provides an in-depth analysis of the market's growth trajectories, projecting a significant expansion from an estimated $XX billion in 2025 to a projected $XX billion by 2033. Technological advancements have been the linchpin of this evolution, with the seamless integration of secure NFC capabilities into a widening array of devices. From enhanced payment systems to sophisticated access control and untethered device-to-device communication, NFC’s versatility has unlocked new frontiers. Consumer demand has been a powerful catalyst, driven by the pursuit of convenience, enhanced security, and intuitive user experiences. The widespread adoption of smartphones with integrated NFC capabilities has democratized access to these secure technologies, fostering a ripple effect across various sectors. Key growth rates have seen a consistent upward trend, with adoption metrics indicating a strong market penetration in consumer electronics and burgeoning interest in sectors like Automotive & Transportation and BFSI. The base year of 2025 sets a crucial benchmark for understanding the current market dynamics and forecasting future potential. The report will meticulously trace these developments, providing specific data points on adoption rates, technological integration timelines, and the impact of evolving consumer preferences on market segmentation and product development throughout the forecast period of 2025–2033. This comprehensive analysis will equip stakeholders with a clear understanding of the industry's past achievements and future potential.
Leading Regions, Countries, or Segments in Secure NFC
The global Secure NFC market is experiencing a significant surge, with its dominance shaped by a confluence of technological adoption, regulatory support, and burgeoning consumer demand. The Consumer Electronics segment, projected to account for a substantial XX% of the market share by 2033, stands as a primary driver of this growth. This segment's dominance is fueled by the pervasive integration of secure NFC into smartphones, wearables, and smart home devices, offering unparalleled convenience and security for contactless payments, device pairing, and access control. North America and Asia Pacific are identified as the leading regions, driven by robust technological infrastructure, high disposable incomes, and a strong appetite for innovative consumer products. The 144 Bytes and 504 Bytes NFC tag types are experiencing widespread adoption within this segment due to their cost-effectiveness and suitability for a myriad of everyday applications.
- Consumer Electronics Dominance: The widespread integration of secure NFC into smartphones, wearables, and smart home devices is a key factor, creating a substantial market for contactless payments, secure authentication, and seamless device interactions.
- Application Growth in Automotive & Transportation: Increasing adoption of NFC for vehicle access, in-car payments, and enhanced driver experience is a significant growth area, projecting a XX% market expansion by 2033.
- BFSI Sector Expansion: The robust deployment of NFC for secure contactless payments and authentication in the banking, financial services, and insurance sectors continues to drive market growth, with an estimated market value of $XX billion by 2033.
- Healthcare Innovations: The utilization of secure NFC for patient identification, medical device authentication, and secure data transfer presents a growing opportunity, contributing an estimated XX% to the overall market by 2033.
- Retail Applications: The implementation of NFC for loyalty programs, inventory management, and enhanced customer experiences in the retail sector is a consistent growth driver.
- Building & Infrastructure Integration: Growing adoption of NFC for smart building access, secure entry systems, and facility management contributes to market expansion.
- Type Dominance: The 144 Bytes and 504 Bytes NFC types are favored for their balance of capacity, cost, and application suitability, while 888 Bytes offers advanced capabilities for specialized applications.
- Investment Trends: Significant R&D investments from leading companies like NXP Semiconductors N.V., Samsung Electronics Co., Ltd., and Broadcom Inc. are fueling innovation and market penetration.
- Regulatory Support: Favorable government regulations and industry standards in regions like North America and Europe are accelerating the adoption of secure NFC solutions.
Secure NFC Product Innovations
Secure NFC technology continues to witness groundbreaking product innovations, enhancing security, functionality, and user experience across diverse applications. Recent advancements include the development of ultra-low power NFC chips enabling extended battery life in wearable devices, and sophisticated encryption algorithms for unparalleled data protection in contactless payments. Furthermore, the integration of secure NFC into advanced biometric authentication systems is revolutionizing access control, offering a seamless blend of convenience and robust security. The performance metrics of these innovations are noteworthy, with reduced latency in transaction times and enhanced read range capabilities. Unique selling propositions lie in the miniaturization of NFC modules, allowing for integration into even the smallest form factors, and the development of highly secure, tamper-proof NFC tags for critical asset tracking and supply chain management.
Propelling Factors for Secure NFC Growth
The secure NFC market is experiencing robust growth propelled by several key factors. The increasing demand for contactless payment solutions, driven by convenience and hygiene concerns, stands as a primary growth engine. Technological advancements, particularly the proliferation of NFC-enabled smartphones and the development of more secure and efficient NFC chips by companies like NXP Semiconductors N.V. and Broadcom Inc., are expanding the market's reach. Furthermore, supportive government initiatives and industry standards promoting secure transactions and data exchange are fostering wider adoption. The growing integration of NFC in the Automotive & Transportation sector for vehicle access and payments, alongside its expanding use in Consumer Electronics and Healthcare for enhanced user experiences and data security, further fuels this expansion.
Obstacles in the Secure NFC Market
Despite its strong growth potential, the secure NFC market faces certain obstacles. Regulatory hurdles and varying compliance standards across different regions can slow down market penetration and product development. Supply chain disruptions, as witnessed in recent global events, can impact the availability and cost of critical components, affecting production timelines. Furthermore, the presence of established alternative technologies and the ongoing development of competing secure communication protocols pose competitive pressures. Security concerns, although addressed by robust encryption, remain a point of vigilance for some users, requiring continuous education and demonstration of secure implementation.
Future Opportunities in Secure NFC
The future of the secure NFC market is ripe with emerging opportunities. The expansion into new markets, such as the burgeoning Internet of Things (IoT) ecosystem, presents significant potential for secure device authentication and communication. Advancements in NFC technology, including enhanced security features and longer read ranges, will unlock novel applications in industrial automation and smart infrastructure. The growing consumer trend towards personalized experiences and seamless digital interactions will further drive demand for NFC-enabled solutions across retail, healthcare, and entertainment sectors. Strategic collaborations between hardware manufacturers, software developers, and service providers will be crucial in capitalizing on these opportunities.
Major Players in the Secure NFC Ecosystem
- Broadcom Inc.
- HID Global
- Intel Corporation
- Infineon Technologies AG
- Marvell Technology, Inc.
- MediaTek Inc.
- Nordic Semiconductor
- NXP Semiconductors N.V.
- Qualcomm Technologies, Inc.
- Renesas Electronics Corporation
- Samsung Electronics Co., Ltd.
- Sony Corporation
- STMicroelectronics N.V.
- Texas Instruments Incorporated
Key Developments in Secure NFC Industry
- 2023/11: NXP Semiconductors N.V. launches a new generation of secure NFC controllers with enhanced security features for automotive applications.
- 2023/10: HID Global announces an expanded portfolio of secure NFC tags for industrial asset tracking.
- 2023/09: Samsung Electronics Co., Ltd. integrates advanced secure NFC capabilities into its latest flagship smartphone series.
- 2023/08: Infineon Technologies AG introduces cost-effective secure NFC chips for consumer electronics.
- 2023/07: Broadcom Inc. collaborates with payment processors to enhance the security of NFC-based transactions.
- 2023/06: Qualcomm Technologies, Inc. showcases seamless device-to-device connectivity using secure NFC in its latest chipset.
- 2023/05: STMicroelectronics N.V. unveils new secure NFC readers with improved read range and lower power consumption.
- 2023/04: Marvell Technology, Inc. announces advancements in NFC technology for secure IoT device authentication.
- 2023/03: Renesas Electronics Corporation expands its secure NFC offerings for smart home devices.
- 2023/02: Sony Corporation introduces innovative NFC-enabled sensors for medical applications.
- 2023/01: Nordic Semiconductor highlights the growing use of its low-power NFC solutions in wearable technology.
- 2022/12: Intel Corporation demonstrates enhanced NFC security protocols for enterprise solutions.
- 2022/11: Major industry players collaborate on new standards for secure NFC data exchange.
Strategic Secure NFC Market Forecast
The strategic Secure NFC market forecast indicates sustained and significant growth, driven by accelerating technological innovation and expanding application footprints. The increasing consumer preference for contactless and secure interactions across payment, access, and data sharing will continue to be a primary growth catalyst. Strategic investments in R&D by leading companies like NXP Semiconductors N.V. and Samsung Electronics Co., Ltd. are set to unlock new use cases in emerging sectors such as the metaverse and advanced IoT environments. The forecast anticipates that the convergence of secure NFC with other advanced technologies like AI and biometrics will further enhance its value proposition, solidifying its position as a cornerstone of secure digital experiences for billions of users worldwide.
Secure Nfc Segmentation
-
1. Application
- 1.1. Automotive & Transportation
- 1.2. Consumer Electronics
- 1.3. Retail
- 1.4. BFSI
- 1.5. Healthcare
- 1.6. Building & Infrastructure
- 1.7. Others
-
2. Type
- 2.1. 144 Bytes
- 2.2. 504 Bytes
- 2.3. 888 Bytes
Secure Nfc Segmentation By Geography
-
1. North America
- 1.1. United States
- 1.2. Canada
- 1.3. Mexico
-
2. South America
- 2.1. Brazil
- 2.2. Argentina
- 2.3. Rest of South America
-
3. Europe
- 3.1. United Kingdom
- 3.2. Germany
- 3.3. France
- 3.4. Italy
- 3.5. Spain
- 3.6. Russia
- 3.7. Benelux
- 3.8. Nordics
- 3.9. Rest of Europe
-
4. Middle East & Africa
- 4.1. Turkey
- 4.2. Israel
- 4.3. GCC
- 4.4. North Africa
- 4.5. South Africa
- 4.6. Rest of Middle East & Africa
-
5. Asia Pacific
- 5.1. China
- 5.2. India
- 5.3. Japan
- 5.4. South Korea
- 5.5. ASEAN
- 5.6. Oceania
- 5.7. Rest of Asia Pacific
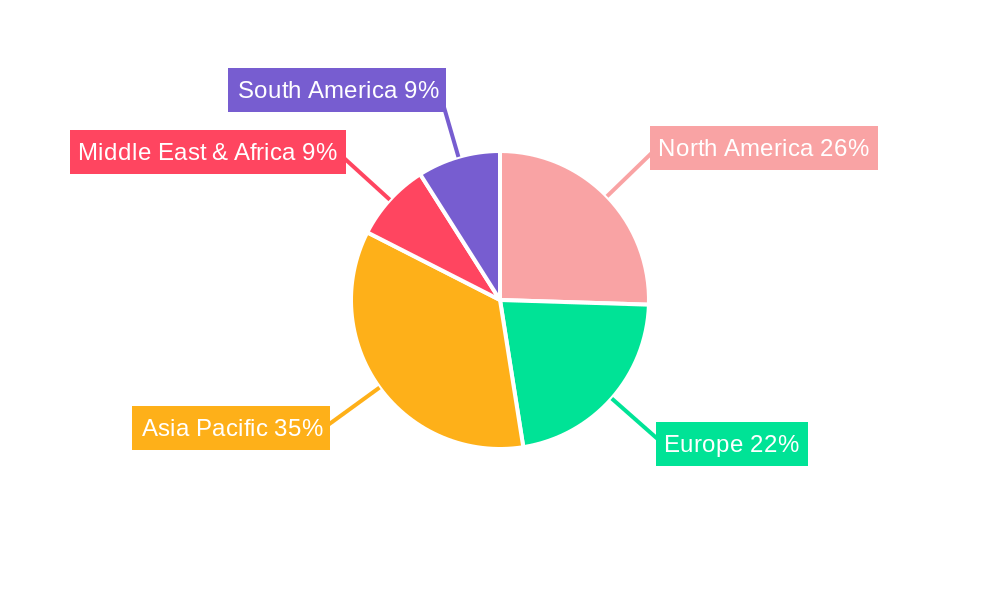
Secure Nfc Regional Market Share
Geographic Coverage of Secure Nfc
Secure Nfc REPORT HIGHLIGHTS
| Aspects | Details |
|---|---|
| Study Period | 2020-2034 |
| Base Year | 2025 |
| Estimated Year | 2026 |
| Forecast Period | 2026-2034 |
| Historical Period | 2020-2025 |
| Growth Rate | CAGR of 9.8% from 2020-2034 |
| Segmentation |
|
Table of Contents
- 1. Introduction
- 1.1. Research Scope
- 1.2. Market Segmentation
- 1.3. Research Objective
- 1.4. Definitions and Assumptions
- 2. Executive Summary
- 2.1. Market Snapshot
- 3. Market Dynamics
- 3.1. Market Drivers
- 3.2. Market Restrains
- 3.3. Market Trends
- 3.4. Market Opportunities
- 4. Market Factor Analysis
- 4.1. Porters Five Forces
- 4.1.1. Bargaining Power of Suppliers
- 4.1.2. Bargaining Power of Buyers
- 4.1.3. Threat of New Entrants
- 4.1.4. Threat of Substitutes
- 4.1.5. Competitive Rivalry
- 4.2. PESTEL analysis
- 4.3. BCG Analysis
- 4.3.1. Stars (High Growth, High Market Share)
- 4.3.2. Cash Cows (Low Growth, High Market Share)
- 4.3.3. Question Mark (High Growth, Low Market Share)
- 4.3.4. Dogs (Low Growth, Low Market Share)
- 4.4. Ansoff Matrix Analysis
- 4.5. Supply Chain Analysis
- 4.6. Regulatory Landscape
- 4.7. Current Market Potential and Opportunity Assessment (TAM–SAM–SOM Framework)
- 4.8. DMV Analyst Note
- 4.1. Porters Five Forces
- 5. Market Analysis, Insights and Forecast 2021-2033
- 5.1. Market Analysis, Insights and Forecast - by Application
- 5.1.1. Automotive & Transportation
- 5.1.2. Consumer Electronics
- 5.1.3. Retail
- 5.1.4. BFSI
- 5.1.5. Healthcare
- 5.1.6. Building & Infrastructure
- 5.1.7. Others
- 5.2. Market Analysis, Insights and Forecast - by Type
- 5.2.1. 144 Bytes
- 5.2.2. 504 Bytes
- 5.2.3. 888 Bytes
- 5.3. Market Analysis, Insights and Forecast - by Region
- 5.3.1. North America
- 5.3.2. South America
- 5.3.3. Europe
- 5.3.4. Middle East & Africa
- 5.3.5. Asia Pacific
- 5.1. Market Analysis, Insights and Forecast - by Application
- 6. Global Secure Nfc Analysis, Insights and Forecast, 2021-2033
- 6.1. Market Analysis, Insights and Forecast - by Application
- 6.1.1. Automotive & Transportation
- 6.1.2. Consumer Electronics
- 6.1.3. Retail
- 6.1.4. BFSI
- 6.1.5. Healthcare
- 6.1.6. Building & Infrastructure
- 6.1.7. Others
- 6.2. Market Analysis, Insights and Forecast - by Type
- 6.2.1. 144 Bytes
- 6.2.2. 504 Bytes
- 6.2.3. 888 Bytes
- 6.1. Market Analysis, Insights and Forecast - by Application
- 7. North America Secure Nfc Analysis, Insights and Forecast, 2020-2032
- 7.1. Market Analysis, Insights and Forecast - by Application
- 7.1.1. Automotive & Transportation
- 7.1.2. Consumer Electronics
- 7.1.3. Retail
- 7.1.4. BFSI
- 7.1.5. Healthcare
- 7.1.6. Building & Infrastructure
- 7.1.7. Others
- 7.2. Market Analysis, Insights and Forecast - by Type
- 7.2.1. 144 Bytes
- 7.2.2. 504 Bytes
- 7.2.3. 888 Bytes
- 7.1. Market Analysis, Insights and Forecast - by Application
- 8. South America Secure Nfc Analysis, Insights and Forecast, 2020-2032
- 8.1. Market Analysis, Insights and Forecast - by Application
- 8.1.1. Automotive & Transportation
- 8.1.2. Consumer Electronics
- 8.1.3. Retail
- 8.1.4. BFSI
- 8.1.5. Healthcare
- 8.1.6. Building & Infrastructure
- 8.1.7. Others
- 8.2. Market Analysis, Insights and Forecast - by Type
- 8.2.1. 144 Bytes
- 8.2.2. 504 Bytes
- 8.2.3. 888 Bytes
- 8.1. Market Analysis, Insights and Forecast - by Application
- 9. Europe Secure Nfc Analysis, Insights and Forecast, 2020-2032
- 9.1. Market Analysis, Insights and Forecast - by Application
- 9.1.1. Automotive & Transportation
- 9.1.2. Consumer Electronics
- 9.1.3. Retail
- 9.1.4. BFSI
- 9.1.5. Healthcare
- 9.1.6. Building & Infrastructure
- 9.1.7. Others
- 9.2. Market Analysis, Insights and Forecast - by Type
- 9.2.1. 144 Bytes
- 9.2.2. 504 Bytes
- 9.2.3. 888 Bytes
- 9.1. Market Analysis, Insights and Forecast - by Application
- 10. Middle East & Africa Secure Nfc Analysis, Insights and Forecast, 2020-2032
- 10.1. Market Analysis, Insights and Forecast - by Application
- 10.1.1. Automotive & Transportation
- 10.1.2. Consumer Electronics
- 10.1.3. Retail
- 10.1.4. BFSI
- 10.1.5. Healthcare
- 10.1.6. Building & Infrastructure
- 10.1.7. Others
- 10.2. Market Analysis, Insights and Forecast - by Type
- 10.2.1. 144 Bytes
- 10.2.2. 504 Bytes
- 10.2.3. 888 Bytes
- 10.1. Market Analysis, Insights and Forecast - by Application
- 11. Asia Pacific Secure Nfc Analysis, Insights and Forecast, 2020-2032
- 11.1. Market Analysis, Insights and Forecast - by Application
- 11.1.1. Automotive & Transportation
- 11.1.2. Consumer Electronics
- 11.1.3. Retail
- 11.1.4. BFSI
- 11.1.5. Healthcare
- 11.1.6. Building & Infrastructure
- 11.1.7. Others
- 11.2. Market Analysis, Insights and Forecast - by Type
- 11.2.1. 144 Bytes
- 11.2.2. 504 Bytes
- 11.2.3. 888 Bytes
- 11.1. Market Analysis, Insights and Forecast - by Application
- 12. Competitive Analysis
- 12.1. Company Profiles
- 12.1.1 Broadcom Inc.
- 12.1.1.1. Company Overview
- 12.1.1.2. Products
- 12.1.1.3. Company Financials
- 12.1.1.4. SWOT Analysis
- 12.1.2 HID Global
- 12.1.2.1. Company Overview
- 12.1.2.2. Products
- 12.1.2.3. Company Financials
- 12.1.2.4. SWOT Analysis
- 12.1.3 Intel Corporation
- 12.1.3.1. Company Overview
- 12.1.3.2. Products
- 12.1.3.3. Company Financials
- 12.1.3.4. SWOT Analysis
- 12.1.4 Infineon Technologies AG
- 12.1.4.1. Company Overview
- 12.1.4.2. Products
- 12.1.4.3. Company Financials
- 12.1.4.4. SWOT Analysis
- 12.1.5 Marvell Technology Inc.
- 12.1.5.1. Company Overview
- 12.1.5.2. Products
- 12.1.5.3. Company Financials
- 12.1.5.4. SWOT Analysis
- 12.1.6 MediaTek Inc.
- 12.1.6.1. Company Overview
- 12.1.6.2. Products
- 12.1.6.3. Company Financials
- 12.1.6.4. SWOT Analysis
- 12.1.7 Nordic Semiconductor
- 12.1.7.1. Company Overview
- 12.1.7.2. Products
- 12.1.7.3. Company Financials
- 12.1.7.4. SWOT Analysis
- 12.1.8 NXP Semiconductors N.V.
- 12.1.8.1. Company Overview
- 12.1.8.2. Products
- 12.1.8.3. Company Financials
- 12.1.8.4. SWOT Analysis
- 12.1.9 Qualcomm Technologies Inc.
- 12.1.9.1. Company Overview
- 12.1.9.2. Products
- 12.1.9.3. Company Financials
- 12.1.9.4. SWOT Analysis
- 12.1.10 Renesas Electronics Corporation
- 12.1.10.1. Company Overview
- 12.1.10.2. Products
- 12.1.10.3. Company Financials
- 12.1.10.4. SWOT Analysis
- 12.1.11 Samsung Electronics Co. Ltd.
- 12.1.11.1. Company Overview
- 12.1.11.2. Products
- 12.1.11.3. Company Financials
- 12.1.11.4. SWOT Analysis
- 12.1.12 Sony Corporation
- 12.1.12.1. Company Overview
- 12.1.12.2. Products
- 12.1.12.3. Company Financials
- 12.1.12.4. SWOT Analysis
- 12.1.13 STMicroelectronics N.V.
- 12.1.13.1. Company Overview
- 12.1.13.2. Products
- 12.1.13.3. Company Financials
- 12.1.13.4. SWOT Analysis
- 12.1.14 Texas Instruments Incorporated
- 12.1.14.1. Company Overview
- 12.1.14.2. Products
- 12.1.14.3. Company Financials
- 12.1.14.4. SWOT Analysis
- 12.1.1 Broadcom Inc.
- 12.2. Market Entropy
- 12.2.1 Company's Key Areas Served
- 12.2.2 Recent Developments
- 12.3. Company Market Share Analysis 2025
- 12.3.1 Top 5 Companies Market Share Analysis
- 12.3.2 Top 3 Companies Market Share Analysis
- 12.4. List of Potential Customers
- 13. Research Methodology
List of Figures
- Figure 1: Global Secure Nfc Revenue Breakdown (undefined, %) by Region 2025 & 2033
- Figure 2: Global Secure Nfc Volume Breakdown (K, %) by Region 2025 & 2033
- Figure 3: North America Secure Nfc Revenue (undefined), by Application 2025 & 2033
- Figure 4: North America Secure Nfc Volume (K), by Application 2025 & 2033
- Figure 5: North America Secure Nfc Revenue Share (%), by Application 2025 & 2033
- Figure 6: North America Secure Nfc Volume Share (%), by Application 2025 & 2033
- Figure 7: North America Secure Nfc Revenue (undefined), by Type 2025 & 2033
- Figure 8: North America Secure Nfc Volume (K), by Type 2025 & 2033
- Figure 9: North America Secure Nfc Revenue Share (%), by Type 2025 & 2033
- Figure 10: North America Secure Nfc Volume Share (%), by Type 2025 & 2033
- Figure 11: North America Secure Nfc Revenue (undefined), by Country 2025 & 2033
- Figure 12: North America Secure Nfc Volume (K), by Country 2025 & 2033
- Figure 13: North America Secure Nfc Revenue Share (%), by Country 2025 & 2033
- Figure 14: North America Secure Nfc Volume Share (%), by Country 2025 & 2033
- Figure 15: South America Secure Nfc Revenue (undefined), by Application 2025 & 2033
- Figure 16: South America Secure Nfc Volume (K), by Application 2025 & 2033
- Figure 17: South America Secure Nfc Revenue Share (%), by Application 2025 & 2033
- Figure 18: South America Secure Nfc Volume Share (%), by Application 2025 & 2033
- Figure 19: South America Secure Nfc Revenue (undefined), by Type 2025 & 2033
- Figure 20: South America Secure Nfc Volume (K), by Type 2025 & 2033
- Figure 21: South America Secure Nfc Revenue Share (%), by Type 2025 & 2033
- Figure 22: South America Secure Nfc Volume Share (%), by Type 2025 & 2033
- Figure 23: South America Secure Nfc Revenue (undefined), by Country 2025 & 2033
- Figure 24: South America Secure Nfc Volume (K), by Country 2025 & 2033
- Figure 25: South America Secure Nfc Revenue Share (%), by Country 2025 & 2033
- Figure 26: South America Secure Nfc Volume Share (%), by Country 2025 & 2033
- Figure 27: Europe Secure Nfc Revenue (undefined), by Application 2025 & 2033
- Figure 28: Europe Secure Nfc Volume (K), by Application 2025 & 2033
- Figure 29: Europe Secure Nfc Revenue Share (%), by Application 2025 & 2033
- Figure 30: Europe Secure Nfc Volume Share (%), by Application 2025 & 2033
- Figure 31: Europe Secure Nfc Revenue (undefined), by Type 2025 & 2033
- Figure 32: Europe Secure Nfc Volume (K), by Type 2025 & 2033
- Figure 33: Europe Secure Nfc Revenue Share (%), by Type 2025 & 2033
- Figure 34: Europe Secure Nfc Volume Share (%), by Type 2025 & 2033
- Figure 35: Europe Secure Nfc Revenue (undefined), by Country 2025 & 2033
- Figure 36: Europe Secure Nfc Volume (K), by Country 2025 & 2033
- Figure 37: Europe Secure Nfc Revenue Share (%), by Country 2025 & 2033
- Figure 38: Europe Secure Nfc Volume Share (%), by Country 2025 & 2033
- Figure 39: Middle East & Africa Secure Nfc Revenue (undefined), by Application 2025 & 2033
- Figure 40: Middle East & Africa Secure Nfc Volume (K), by Application 2025 & 2033
- Figure 41: Middle East & Africa Secure Nfc Revenue Share (%), by Application 2025 & 2033
- Figure 42: Middle East & Africa Secure Nfc Volume Share (%), by Application 2025 & 2033
- Figure 43: Middle East & Africa Secure Nfc Revenue (undefined), by Type 2025 & 2033
- Figure 44: Middle East & Africa Secure Nfc Volume (K), by Type 2025 & 2033
- Figure 45: Middle East & Africa Secure Nfc Revenue Share (%), by Type 2025 & 2033
- Figure 46: Middle East & Africa Secure Nfc Volume Share (%), by Type 2025 & 2033
- Figure 47: Middle East & Africa Secure Nfc Revenue (undefined), by Country 2025 & 2033
- Figure 48: Middle East & Africa Secure Nfc Volume (K), by Country 2025 & 2033
- Figure 49: Middle East & Africa Secure Nfc Revenue Share (%), by Country 2025 & 2033
- Figure 50: Middle East & Africa Secure Nfc Volume Share (%), by Country 2025 & 2033
- Figure 51: Asia Pacific Secure Nfc Revenue (undefined), by Application 2025 & 2033
- Figure 52: Asia Pacific Secure Nfc Volume (K), by Application 2025 & 2033
- Figure 53: Asia Pacific Secure Nfc Revenue Share (%), by Application 2025 & 2033
- Figure 54: Asia Pacific Secure Nfc Volume Share (%), by Application 2025 & 2033
- Figure 55: Asia Pacific Secure Nfc Revenue (undefined), by Type 2025 & 2033
- Figure 56: Asia Pacific Secure Nfc Volume (K), by Type 2025 & 2033
- Figure 57: Asia Pacific Secure Nfc Revenue Share (%), by Type 2025 & 2033
- Figure 58: Asia Pacific Secure Nfc Volume Share (%), by Type 2025 & 2033
- Figure 59: Asia Pacific Secure Nfc Revenue (undefined), by Country 2025 & 2033
- Figure 60: Asia Pacific Secure Nfc Volume (K), by Country 2025 & 2033
- Figure 61: Asia Pacific Secure Nfc Revenue Share (%), by Country 2025 & 2033
- Figure 62: Asia Pacific Secure Nfc Volume Share (%), by Country 2025 & 2033
List of Tables
- Table 1: Global Secure Nfc Revenue undefined Forecast, by Application 2020 & 2033
- Table 2: Global Secure Nfc Volume K Forecast, by Application 2020 & 2033
- Table 3: Global Secure Nfc Revenue undefined Forecast, by Type 2020 & 2033
- Table 4: Global Secure Nfc Volume K Forecast, by Type 2020 & 2033
- Table 5: Global Secure Nfc Revenue undefined Forecast, by Region 2020 & 2033
- Table 6: Global Secure Nfc Volume K Forecast, by Region 2020 & 2033
- Table 7: Global Secure Nfc Revenue undefined Forecast, by Application 2020 & 2033
- Table 8: Global Secure Nfc Volume K Forecast, by Application 2020 & 2033
- Table 9: Global Secure Nfc Revenue undefined Forecast, by Type 2020 & 2033
- Table 10: Global Secure Nfc Volume K Forecast, by Type 2020 & 2033
- Table 11: Global Secure Nfc Revenue undefined Forecast, by Country 2020 & 2033
- Table 12: Global Secure Nfc Volume K Forecast, by Country 2020 & 2033
- Table 13: United States Secure Nfc Revenue (undefined) Forecast, by Application 2020 & 2033
- Table 14: United States Secure Nfc Volume (K) Forecast, by Application 2020 & 2033
- Table 15: Canada Secure Nfc Revenue (undefined) Forecast, by Application 2020 & 2033
- Table 16: Canada Secure Nfc Volume (K) Forecast, by Application 2020 & 2033
- Table 17: Mexico Secure Nfc Revenue (undefined) Forecast, by Application 2020 & 2033
- Table 18: Mexico Secure Nfc Volume (K) Forecast, by Application 2020 & 2033
- Table 19: Global Secure Nfc Revenue undefined Forecast, by Application 2020 & 2033
- Table 20: Global Secure Nfc Volume K Forecast, by Application 2020 & 2033
- Table 21: Global Secure Nfc Revenue undefined Forecast, by Type 2020 & 2033
- Table 22: Global Secure Nfc Volume K Forecast, by Type 2020 & 2033
- Table 23: Global Secure Nfc Revenue undefined Forecast, by Country 2020 & 2033
- Table 24: Global Secure Nfc Volume K Forecast, by Country 2020 & 2033
- Table 25: Brazil Secure Nfc Revenue (undefined) Forecast, by Application 2020 & 2033
- Table 26: Brazil Secure Nfc Volume (K) Forecast, by Application 2020 & 2033
- Table 27: Argentina Secure Nfc Revenue (undefined) Forecast, by Application 2020 & 2033
- Table 28: Argentina Secure Nfc Volume (K) Forecast, by Application 2020 & 2033
- Table 29: Rest of South America Secure Nfc Revenue (undefined) Forecast, by Application 2020 & 2033
- Table 30: Rest of South America Secure Nfc Volume (K) Forecast, by Application 2020 & 2033
- Table 31: Global Secure Nfc Revenue undefined Forecast, by Application 2020 & 2033
- Table 32: Global Secure Nfc Volume K Forecast, by Application 2020 & 2033
- Table 33: Global Secure Nfc Revenue undefined Forecast, by Type 2020 & 2033
- Table 34: Global Secure Nfc Volume K Forecast, by Type 2020 & 2033
- Table 35: Global Secure Nfc Revenue undefined Forecast, by Country 2020 & 2033
- Table 36: Global Secure Nfc Volume K Forecast, by Country 2020 & 2033
- Table 37: United Kingdom Secure Nfc Revenue (undefined) Forecast, by Application 2020 & 2033
- Table 38: United Kingdom Secure Nfc Volume (K) Forecast, by Application 2020 & 2033
- Table 39: Germany Secure Nfc Revenue (undefined) Forecast, by Application 2020 & 2033
- Table 40: Germany Secure Nfc Volume (K) Forecast, by Application 2020 & 2033
- Table 41: France Secure Nfc Revenue (undefined) Forecast, by Application 2020 & 2033
- Table 42: France Secure Nfc Volume (K) Forecast, by Application 2020 & 2033
- Table 43: Italy Secure Nfc Revenue (undefined) Forecast, by Application 2020 & 2033
- Table 44: Italy Secure Nfc Volume (K) Forecast, by Application 2020 & 2033
- Table 45: Spain Secure Nfc Revenue (undefined) Forecast, by Application 2020 & 2033
- Table 46: Spain Secure Nfc Volume (K) Forecast, by Application 2020 & 2033
- Table 47: Russia Secure Nfc Revenue (undefined) Forecast, by Application 2020 & 2033
- Table 48: Russia Secure Nfc Volume (K) Forecast, by Application 2020 & 2033
- Table 49: Benelux Secure Nfc Revenue (undefined) Forecast, by Application 2020 & 2033
- Table 50: Benelux Secure Nfc Volume (K) Forecast, by Application 2020 & 2033
- Table 51: Nordics Secure Nfc Revenue (undefined) Forecast, by Application 2020 & 2033
- Table 52: Nordics Secure Nfc Volume (K) Forecast, by Application 2020 & 2033
- Table 53: Rest of Europe Secure Nfc Revenue (undefined) Forecast, by Application 2020 & 2033
- Table 54: Rest of Europe Secure Nfc Volume (K) Forecast, by Application 2020 & 2033
- Table 55: Global Secure Nfc Revenue undefined Forecast, by Application 2020 & 2033
- Table 56: Global Secure Nfc Volume K Forecast, by Application 2020 & 2033
- Table 57: Global Secure Nfc Revenue undefined Forecast, by Type 2020 & 2033
- Table 58: Global Secure Nfc Volume K Forecast, by Type 2020 & 2033
- Table 59: Global Secure Nfc Revenue undefined Forecast, by Country 2020 & 2033
- Table 60: Global Secure Nfc Volume K Forecast, by Country 2020 & 2033
- Table 61: Turkey Secure Nfc Revenue (undefined) Forecast, by Application 2020 & 2033
- Table 62: Turkey Secure Nfc Volume (K) Forecast, by Application 2020 & 2033
- Table 63: Israel Secure Nfc Revenue (undefined) Forecast, by Application 2020 & 2033
- Table 64: Israel Secure Nfc Volume (K) Forecast, by Application 2020 & 2033
- Table 65: GCC Secure Nfc Revenue (undefined) Forecast, by Application 2020 & 2033
- Table 66: GCC Secure Nfc Volume (K) Forecast, by Application 2020 & 2033
- Table 67: North Africa Secure Nfc Revenue (undefined) Forecast, by Application 2020 & 2033
- Table 68: North Africa Secure Nfc Volume (K) Forecast, by Application 2020 & 2033
- Table 69: South Africa Secure Nfc Revenue (undefined) Forecast, by Application 2020 & 2033
- Table 70: South Africa Secure Nfc Volume (K) Forecast, by Application 2020 & 2033
- Table 71: Rest of Middle East & Africa Secure Nfc Revenue (undefined) Forecast, by Application 2020 & 2033
- Table 72: Rest of Middle East & Africa Secure Nfc Volume (K) Forecast, by Application 2020 & 2033
- Table 73: Global Secure Nfc Revenue undefined Forecast, by Application 2020 & 2033
- Table 74: Global Secure Nfc Volume K Forecast, by Application 2020 & 2033
- Table 75: Global Secure Nfc Revenue undefined Forecast, by Type 2020 & 2033
- Table 76: Global Secure Nfc Volume K Forecast, by Type 2020 & 2033
- Table 77: Global Secure Nfc Revenue undefined Forecast, by Country 2020 & 2033
- Table 78: Global Secure Nfc Volume K Forecast, by Country 2020 & 2033
- Table 79: China Secure Nfc Revenue (undefined) Forecast, by Application 2020 & 2033
- Table 80: China Secure Nfc Volume (K) Forecast, by Application 2020 & 2033
- Table 81: India Secure Nfc Revenue (undefined) Forecast, by Application 2020 & 2033
- Table 82: India Secure Nfc Volume (K) Forecast, by Application 2020 & 2033
- Table 83: Japan Secure Nfc Revenue (undefined) Forecast, by Application 2020 & 2033
- Table 84: Japan Secure Nfc Volume (K) Forecast, by Application 2020 & 2033
- Table 85: South Korea Secure Nfc Revenue (undefined) Forecast, by Application 2020 & 2033
- Table 86: South Korea Secure Nfc Volume (K) Forecast, by Application 2020 & 2033
- Table 87: ASEAN Secure Nfc Revenue (undefined) Forecast, by Application 2020 & 2033
- Table 88: ASEAN Secure Nfc Volume (K) Forecast, by Application 2020 & 2033
- Table 89: Oceania Secure Nfc Revenue (undefined) Forecast, by Application 2020 & 2033
- Table 90: Oceania Secure Nfc Volume (K) Forecast, by Application 2020 & 2033
- Table 91: Rest of Asia Pacific Secure Nfc Revenue (undefined) Forecast, by Application 2020 & 2033
- Table 92: Rest of Asia Pacific Secure Nfc Volume (K) Forecast, by Application 2020 & 2033
Frequently Asked Questions
1. What is the projected Compound Annual Growth Rate (CAGR) of the Secure Nfc?
The projected CAGR is approximately 9.8%.
2. Which companies are prominent players in the Secure Nfc?
Key companies in the market include Broadcom Inc., HID Global, Intel Corporation, Infineon Technologies AG, Marvell Technology, Inc., MediaTek Inc., Nordic Semiconductor, NXP Semiconductors N.V., Qualcomm Technologies, Inc., Renesas Electronics Corporation, Samsung Electronics Co., Ltd., Sony Corporation, STMicroelectronics N.V., Texas Instruments Incorporated.
3. What are the main segments of the Secure Nfc?
The market segments include Application, Type.
4. Can you provide details about the market size?
The market size is estimated to be USD XXX N/A as of 2022.
5. What are some drivers contributing to market growth?
N/A
6. What are the notable trends driving market growth?
N/A
7. Are there any restraints impacting market growth?
N/A
8. Can you provide examples of recent developments in the market?
N/A
9. What pricing options are available for accessing the report?
Pricing options include single-user, multi-user, and enterprise licenses priced at USD 3950.00, USD 5925.00, and USD 7900.00 respectively.
10. Is the market size provided in terms of value or volume?
The market size is provided in terms of value, measured in N/A and volume, measured in K.
11. Are there any specific market keywords associated with the report?
Yes, the market keyword associated with the report is "Secure Nfc," which aids in identifying and referencing the specific market segment covered.
12. How do I determine which pricing option suits my needs best?
The pricing options vary based on user requirements and access needs. Individual users may opt for single-user licenses, while businesses requiring broader access may choose multi-user or enterprise licenses for cost-effective access to the report.
13. Are there any additional resources or data provided in the Secure Nfc report?
While the report offers comprehensive insights, it's advisable to review the specific contents or supplementary materials provided to ascertain if additional resources or data are available.
14. How can I stay updated on further developments or reports in the Secure Nfc?
To stay informed about further developments, trends, and reports in the Secure Nfc, consider subscribing to industry newsletters, following relevant companies and organizations, or regularly checking reputable industry news sources and publications.
Methodology
Step 1 - Identification of Relevant Samples Size from Population Database


Step 2 - Approaches for Defining Global Market Size (Value, Volume* & Price*)

Note*: In applicable scenarios
Step 3 - Data Sources
Primary Research
- Web Analytics
- Survey Reports
- Research Institute
- Latest Research Reports
- Opinion Leaders
Secondary Research
- Annual Reports
- White Paper
- Latest Press Release
- Industry Association
- Paid Database
- Investor Presentations

Step 4 - Data Triangulation
Involves using different sources of information in order to increase the validity of a study
These sources are likely to be stakeholders in a program - participants, other researchers, program staff, other community members, and so on.
Then we put all data in single framework & apply various statistical tools to find out the dynamic on the market.
During the analysis stage, feedback from the stakeholder groups would be compared to determine areas of agreement as well as areas of divergence