

Key Insights
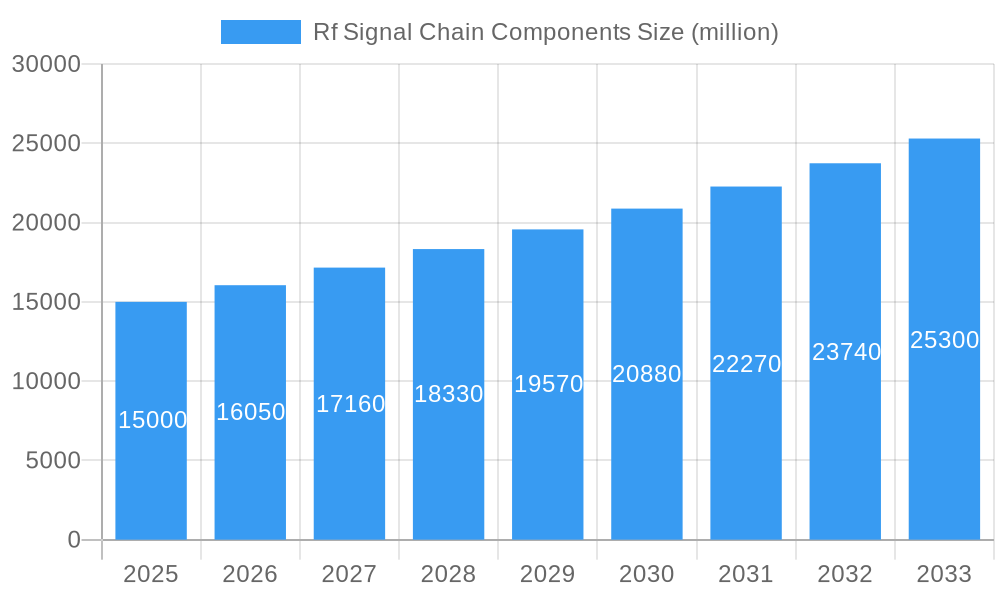
The RF signal chain components market is experiencing robust growth, driven by the increasing demand for high-performance and energy-efficient wireless communication technologies. The proliferation of 5G networks, the Internet of Things (IoT), and advancements in radar systems are key catalysts. The market is segmented by component type (e.g., filters, amplifiers, mixers), application (e.g., cellular infrastructure, automotive, aerospace), and geography. Leading players like Rohde & Schwarz, Qorvo, Murata Manufacturing, Analog Devices, Broadcom, and Skyworks Solutions are strategically investing in research and development to enhance component capabilities and expand their market share. Competition is intense, with companies focusing on innovation, miniaturization, and cost reduction to maintain a competitive edge. We estimate the 2025 market size to be approximately $15 billion, growing at a Compound Annual Growth Rate (CAGR) of 7% from 2025 to 2033, reaching an estimated $28 billion by 2033. This growth is fueled by continuous advancements in semiconductor technology and the increasing integration of RF components into various electronic devices.
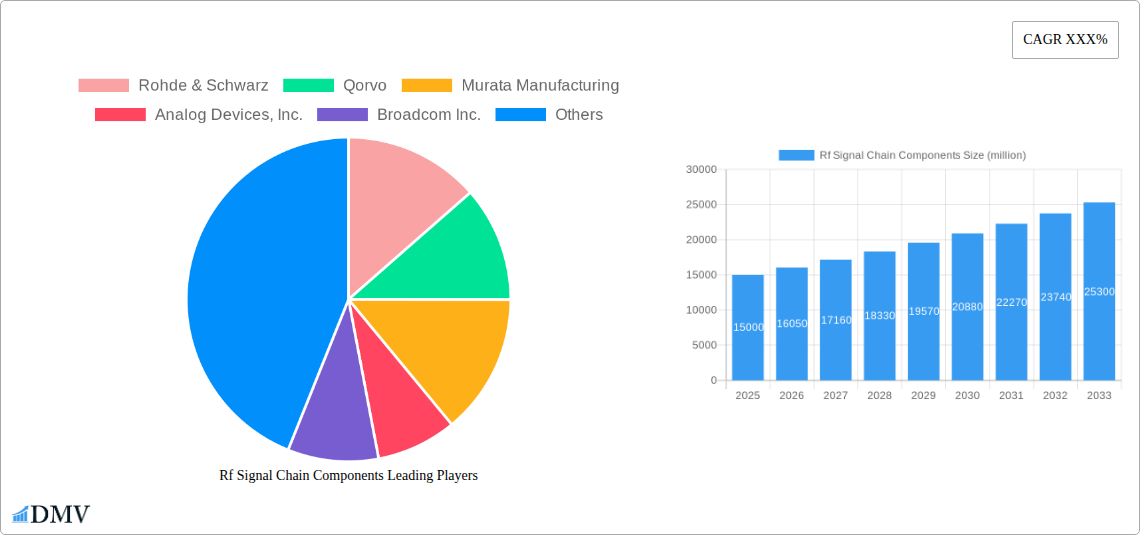
Rf Signal Chain Components Market Size (In Billion)
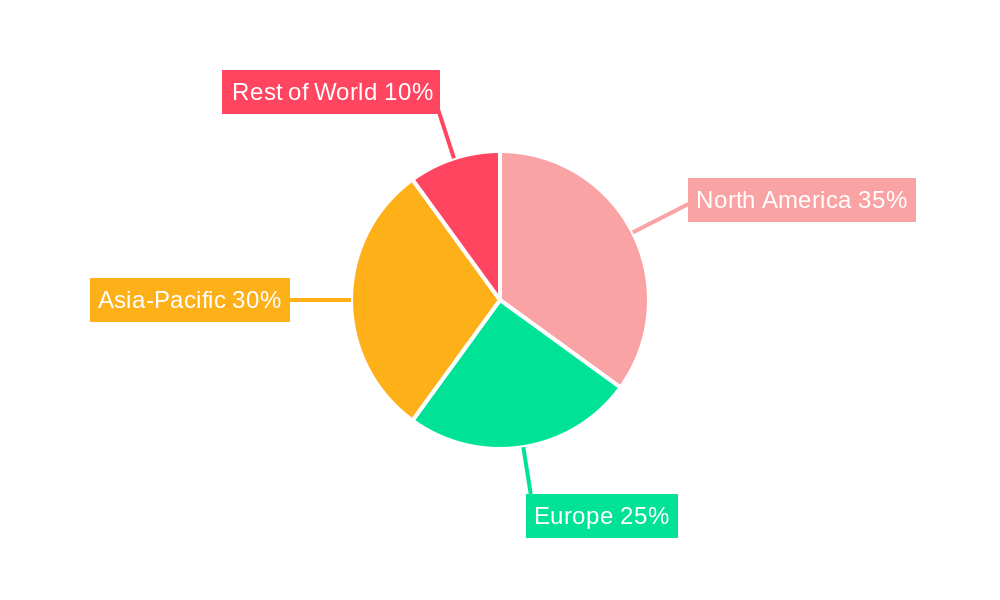
Market restraints include the high cost of advanced components and the complexity of designing and integrating RF signal chains. However, ongoing technological innovations and the increasing demand for high-speed data transmission are expected to mitigate these challenges. The market is witnessing a shift toward the adoption of Software Defined Radio (SDR) technologies, resulting in increased demand for flexible and adaptable RF components. Furthermore, the growing demand for high-frequency applications in automotive radar and 5G infrastructure is driving the development of advanced components with enhanced performance capabilities. Regional variations exist, with North America and Asia-Pacific expected to remain key markets due to the presence of major technology hubs and high investments in wireless infrastructure.
Rf Signal Chain Components Company Market Share
RF Signal Chain Components Market Report: 2019-2033
This comprehensive report provides an in-depth analysis of the RF Signal Chain Components market, projecting a market value exceeding $XX million by 2033. The study period spans from 2019 to 2033, with 2025 serving as both the base and estimated year. This report is crucial for stakeholders seeking to understand market dynamics, technological advancements, and future growth opportunities within this rapidly evolving sector. Key players like Rohde & Schwarz, Qorvo, Murata Manufacturing, Analog Devices, Inc., Broadcom Inc., and Skyworks Solutions, Inc., are thoroughly analyzed, offering valuable insights for strategic decision-making.
Rf Signal Chain Components Market Composition & Trends
The RF Signal Chain Components market exhibits a moderately concentrated landscape, with the top five players holding an estimated xx% market share in 2025. Innovation is driven by increasing demand for higher frequencies, improved power efficiency, and miniaturization across various applications. Stringent regulatory compliance requirements, particularly around spectrum allocation and electromagnetic interference (EMI), shape industry practices. Substitute technologies, such as software-defined radio (SDR) architectures, pose a growing challenge. The primary end-users include the telecommunications, automotive, aerospace, and defense sectors. Significant M&A activity, with deal values exceeding $XX million in the last five years, indicates a consolidating market.
- Market Share Distribution (2025): Rohde & Schwarz (xx%), Qorvo (xx%), Murata Manufacturing (xx%), Analog Devices, Inc. (xx%), Broadcom Inc. (xx%), Skyworks Solutions, Inc. (xx%), Others (xx%).
- M&A Activity (2019-2024): XX deals with a total value exceeding $XX million.
- Key Innovation Catalysts: 5G deployment, IoT growth, advancements in mmWave technology.
- Regulatory Landscape: Strict compliance requirements for EMI and spectrum usage.
Rf Signal Chain Components Industry Evolution
The RF Signal Chain Components market has witnessed robust growth, expanding at a CAGR of xx% during the historical period (2019-2024). This growth trajectory is expected to continue during the forecast period (2025-2033), driven by the increasing adoption of 5G and other wireless technologies, the expansion of the Internet of Things (IoT), and the growing demand for high-performance RF components in diverse applications. Technological advancements, including the development of GaN and SiC-based devices, are pushing the boundaries of performance, efficiency, and size reduction. Consumer demand is shifting towards highly integrated, cost-effective, and energy-efficient solutions. The market is also responding to the increasing need for improved signal quality and increased bandwidth. By 2033, the market is projected to reach a value exceeding $XX million, showcasing a significant expansion over the next decade.
Leading Regions, Countries, or Segments in Rf Signal Chain Components
North America currently dominates the RF Signal Chain Components market, driven primarily by robust investments in advanced wireless infrastructure and strong presence of key players.
- Key Drivers for North American Dominance:
- High levels of R&D investment in advanced RF technologies.
- Strong government support for the telecommunications and defense sectors.
- Early adoption of 5G and other advanced wireless technologies.
- A large pool of skilled engineers and technicians.
- Other regions including Asia-Pacific and Europe also show significant growth potential, fueled by increasing telecommunications infrastructure development and the expanding IoT market.
Rf Signal Chain Components Product Innovations
Recent innovations focus on highly integrated, system-in-package (SiP) solutions that reduce size and complexity while improving performance. Advancements in materials science, such as the utilization of GaN and SiC, lead to increased power efficiency and higher operating frequencies. These innovations enable better signal quality, reduced power consumption, and improved overall system performance. Unique selling propositions center around miniaturization, cost reduction, enhanced power efficiency, and improved reliability.
Propelling Factors for Rf Signal Chain Components Growth
Several factors fuel the growth of the RF Signal Chain Components market. The widespread adoption of 5G technology necessitates higher-performing RF components, driving significant demand. The continued expansion of the IoT, with billions of connected devices, creates a massive market for cost-effective and energy-efficient solutions. Government investments in advanced wireless infrastructure, particularly in developing countries, further bolster market growth.
Obstacles in the Rf Signal Chain Components Market
The RF Signal Chain Components market faces challenges including supply chain disruptions, particularly concerning rare earth elements used in certain components. Intense competition among established players and emerging entrants puts pressure on pricing and margins. Complex regulatory landscapes, with differing standards across various regions, add complexity to product development and market access. These factors could potentially impede market growth if not effectively managed.
Future Opportunities in Rf Signal Chain Components
Significant opportunities lie in the development of components for mmWave applications, enabling faster data rates and greater bandwidth. The integration of AI and machine learning into RF systems promises enhanced signal processing and improved network efficiency. Expansion into new markets such as autonomous vehicles and industrial automation offers significant growth potential.
Major Players in the Rf Signal Chain Components Ecosystem
Key Developments in Rf Signal Chain Components Industry
- 2022-10: Qorvo launched a new series of high-performance RF amplifiers for 5G applications.
- 2023-03: Murata Manufacturing announced a strategic partnership with a leading semiconductor manufacturer to develop next-generation RF filters.
- 2023-06: Analog Devices, Inc. acquired a smaller RF component company, expanding its product portfolio. (Further developments would be added here)
Strategic Rf Signal Chain Components Market Forecast
The RF Signal Chain Components market is poised for sustained growth, driven by ongoing technological advancements, expanding applications across various sectors, and increased investments in wireless infrastructure. The convergence of 5G, IoT, and AI presents significant opportunities for innovation and market expansion, leading to a highly dynamic and promising future for this critical technology segment. The market is projected to exceed $XX million by 2033, offering significant returns for companies engaged in this sector.
Rf Signal Chain Components Segmentation
-
1. Application
- 1.1. Consumer Electronics
- 1.2. Telecommunications Infrastructure
- 1.3. Other
-
2. Type
- 2.1. Filter
- 2.2. Diplexer
Rf Signal Chain Components Segmentation By Geography
-
1. North America
- 1.1. United States
- 1.2. Canada
- 1.3. Mexico
-
2. South America
- 2.1. Brazil
- 2.2. Argentina
- 2.3. Rest of South America
-
3. Europe
- 3.1. United Kingdom
- 3.2. Germany
- 3.3. France
- 3.4. Italy
- 3.5. Spain
- 3.6. Russia
- 3.7. Benelux
- 3.8. Nordics
- 3.9. Rest of Europe
-
4. Middle East & Africa
- 4.1. Turkey
- 4.2. Israel
- 4.3. GCC
- 4.4. North Africa
- 4.5. South Africa
- 4.6. Rest of Middle East & Africa
-
5. Asia Pacific
- 5.1. China
- 5.2. India
- 5.3. Japan
- 5.4. South Korea
- 5.5. ASEAN
- 5.6. Oceania
- 5.7. Rest of Asia Pacific
Rf Signal Chain Components Regional Market Share
Geographic Coverage of Rf Signal Chain Components
Rf Signal Chain Components REPORT HIGHLIGHTS
| Aspects | Details |
|---|---|
| Study Period | 2020-2034 |
| Base Year | 2025 |
| Estimated Year | 2026 |
| Forecast Period | 2026-2034 |
| Historical Period | 2020-2025 |
| Growth Rate | CAGR of XXX% from 2020-2034 |
| Segmentation |
|
Table of Contents
- 1. Introduction
- 1.1. Research Scope
- 1.2. Market Segmentation
- 1.3. Research Objective
- 1.4. Definitions and Assumptions
- 2. Executive Summary
- 2.1. Market Snapshot
- 3. Market Dynamics
- 3.1. Market Drivers
- 3.2. Market Restrains
- 3.3. Market Trends
- 3.4. Market Opportunities
- 4. Market Factor Analysis
- 4.1. Porters Five Forces
- 4.1.1. Bargaining Power of Suppliers
- 4.1.2. Bargaining Power of Buyers
- 4.1.3. Threat of New Entrants
- 4.1.4. Threat of Substitutes
- 4.1.5. Competitive Rivalry
- 4.2. PESTEL analysis
- 4.3. BCG Analysis
- 4.3.1. Stars (High Growth, High Market Share)
- 4.3.2. Cash Cows (Low Growth, High Market Share)
- 4.3.3. Question Mark (High Growth, Low Market Share)
- 4.3.4. Dogs (Low Growth, Low Market Share)
- 4.4. Ansoff Matrix Analysis
- 4.5. Supply Chain Analysis
- 4.6. Regulatory Landscape
- 4.7. Current Market Potential and Opportunity Assessment (TAM–SAM–SOM Framework)
- 4.8. DMV Analyst Note
- 4.1. Porters Five Forces
- 5. Market Analysis, Insights and Forecast 2021-2033
- 5.1. Market Analysis, Insights and Forecast - by Application
- 5.1.1. Consumer Electronics
- 5.1.2. Telecommunications Infrastructure
- 5.1.3. Other
- 5.2. Market Analysis, Insights and Forecast - by Type
- 5.2.1. Filter
- 5.2.2. Diplexer
- 5.3. Market Analysis, Insights and Forecast - by Region
- 5.3.1. North America
- 5.3.2. South America
- 5.3.3. Europe
- 5.3.4. Middle East & Africa
- 5.3.5. Asia Pacific
- 5.1. Market Analysis, Insights and Forecast - by Application
- 6. Global Rf Signal Chain Components Analysis, Insights and Forecast, 2021-2033
- 6.1. Market Analysis, Insights and Forecast - by Application
- 6.1.1. Consumer Electronics
- 6.1.2. Telecommunications Infrastructure
- 6.1.3. Other
- 6.2. Market Analysis, Insights and Forecast - by Type
- 6.2.1. Filter
- 6.2.2. Diplexer
- 6.1. Market Analysis, Insights and Forecast - by Application
- 7. North America Rf Signal Chain Components Analysis, Insights and Forecast, 2020-2032
- 7.1. Market Analysis, Insights and Forecast - by Application
- 7.1.1. Consumer Electronics
- 7.1.2. Telecommunications Infrastructure
- 7.1.3. Other
- 7.2. Market Analysis, Insights and Forecast - by Type
- 7.2.1. Filter
- 7.2.2. Diplexer
- 7.1. Market Analysis, Insights and Forecast - by Application
- 8. South America Rf Signal Chain Components Analysis, Insights and Forecast, 2020-2032
- 8.1. Market Analysis, Insights and Forecast - by Application
- 8.1.1. Consumer Electronics
- 8.1.2. Telecommunications Infrastructure
- 8.1.3. Other
- 8.2. Market Analysis, Insights and Forecast - by Type
- 8.2.1. Filter
- 8.2.2. Diplexer
- 8.1. Market Analysis, Insights and Forecast - by Application
- 9. Europe Rf Signal Chain Components Analysis, Insights and Forecast, 2020-2032
- 9.1. Market Analysis, Insights and Forecast - by Application
- 9.1.1. Consumer Electronics
- 9.1.2. Telecommunications Infrastructure
- 9.1.3. Other
- 9.2. Market Analysis, Insights and Forecast - by Type
- 9.2.1. Filter
- 9.2.2. Diplexer
- 9.1. Market Analysis, Insights and Forecast - by Application
- 10. Middle East & Africa Rf Signal Chain Components Analysis, Insights and Forecast, 2020-2032
- 10.1. Market Analysis, Insights and Forecast - by Application
- 10.1.1. Consumer Electronics
- 10.1.2. Telecommunications Infrastructure
- 10.1.3. Other
- 10.2. Market Analysis, Insights and Forecast - by Type
- 10.2.1. Filter
- 10.2.2. Diplexer
- 10.1. Market Analysis, Insights and Forecast - by Application
- 11. Asia Pacific Rf Signal Chain Components Analysis, Insights and Forecast, 2020-2032
- 11.1. Market Analysis, Insights and Forecast - by Application
- 11.1.1. Consumer Electronics
- 11.1.2. Telecommunications Infrastructure
- 11.1.3. Other
- 11.2. Market Analysis, Insights and Forecast - by Type
- 11.2.1. Filter
- 11.2.2. Diplexer
- 11.1. Market Analysis, Insights and Forecast - by Application
- 12. Competitive Analysis
- 12.1. Company Profiles
- 12.1.1 Rohde & Schwarz
- 12.1.1.1. Company Overview
- 12.1.1.2. Products
- 12.1.1.3. Company Financials
- 12.1.1.4. SWOT Analysis
- 12.1.2 Qorvo
- 12.1.2.1. Company Overview
- 12.1.2.2. Products
- 12.1.2.3. Company Financials
- 12.1.2.4. SWOT Analysis
- 12.1.3 Murata Manufacturing
- 12.1.3.1. Company Overview
- 12.1.3.2. Products
- 12.1.3.3. Company Financials
- 12.1.3.4. SWOT Analysis
- 12.1.4 Analog Devices Inc.
- 12.1.4.1. Company Overview
- 12.1.4.2. Products
- 12.1.4.3. Company Financials
- 12.1.4.4. SWOT Analysis
- 12.1.5 Broadcom Inc.
- 12.1.5.1. Company Overview
- 12.1.5.2. Products
- 12.1.5.3. Company Financials
- 12.1.5.4. SWOT Analysis
- 12.1.6 Skyworks Solutions Inc.
- 12.1.6.1. Company Overview
- 12.1.6.2. Products
- 12.1.6.3. Company Financials
- 12.1.6.4. SWOT Analysis
- 12.1.1 Rohde & Schwarz
- 12.2. Market Entropy
- 12.2.1 Company's Key Areas Served
- 12.2.2 Recent Developments
- 12.3. Company Market Share Analysis 2025
- 12.3.1 Top 5 Companies Market Share Analysis
- 12.3.2 Top 3 Companies Market Share Analysis
- 12.4. List of Potential Customers
- 13. Research Methodology
List of Figures
- Figure 1: Global Rf Signal Chain Components Revenue Breakdown (million, %) by Region 2025 & 2033
- Figure 2: Global Rf Signal Chain Components Volume Breakdown (K, %) by Region 2025 & 2033
- Figure 3: North America Rf Signal Chain Components Revenue (million), by Application 2025 & 2033
- Figure 4: North America Rf Signal Chain Components Volume (K), by Application 2025 & 2033
- Figure 5: North America Rf Signal Chain Components Revenue Share (%), by Application 2025 & 2033
- Figure 6: North America Rf Signal Chain Components Volume Share (%), by Application 2025 & 2033
- Figure 7: North America Rf Signal Chain Components Revenue (million), by Type 2025 & 2033
- Figure 8: North America Rf Signal Chain Components Volume (K), by Type 2025 & 2033
- Figure 9: North America Rf Signal Chain Components Revenue Share (%), by Type 2025 & 2033
- Figure 10: North America Rf Signal Chain Components Volume Share (%), by Type 2025 & 2033
- Figure 11: North America Rf Signal Chain Components Revenue (million), by Country 2025 & 2033
- Figure 12: North America Rf Signal Chain Components Volume (K), by Country 2025 & 2033
- Figure 13: North America Rf Signal Chain Components Revenue Share (%), by Country 2025 & 2033
- Figure 14: North America Rf Signal Chain Components Volume Share (%), by Country 2025 & 2033
- Figure 15: South America Rf Signal Chain Components Revenue (million), by Application 2025 & 2033
- Figure 16: South America Rf Signal Chain Components Volume (K), by Application 2025 & 2033
- Figure 17: South America Rf Signal Chain Components Revenue Share (%), by Application 2025 & 2033
- Figure 18: South America Rf Signal Chain Components Volume Share (%), by Application 2025 & 2033
- Figure 19: South America Rf Signal Chain Components Revenue (million), by Type 2025 & 2033
- Figure 20: South America Rf Signal Chain Components Volume (K), by Type 2025 & 2033
- Figure 21: South America Rf Signal Chain Components Revenue Share (%), by Type 2025 & 2033
- Figure 22: South America Rf Signal Chain Components Volume Share (%), by Type 2025 & 2033
- Figure 23: South America Rf Signal Chain Components Revenue (million), by Country 2025 & 2033
- Figure 24: South America Rf Signal Chain Components Volume (K), by Country 2025 & 2033
- Figure 25: South America Rf Signal Chain Components Revenue Share (%), by Country 2025 & 2033
- Figure 26: South America Rf Signal Chain Components Volume Share (%), by Country 2025 & 2033
- Figure 27: Europe Rf Signal Chain Components Revenue (million), by Application 2025 & 2033
- Figure 28: Europe Rf Signal Chain Components Volume (K), by Application 2025 & 2033
- Figure 29: Europe Rf Signal Chain Components Revenue Share (%), by Application 2025 & 2033
- Figure 30: Europe Rf Signal Chain Components Volume Share (%), by Application 2025 & 2033
- Figure 31: Europe Rf Signal Chain Components Revenue (million), by Type 2025 & 2033
- Figure 32: Europe Rf Signal Chain Components Volume (K), by Type 2025 & 2033
- Figure 33: Europe Rf Signal Chain Components Revenue Share (%), by Type 2025 & 2033
- Figure 34: Europe Rf Signal Chain Components Volume Share (%), by Type 2025 & 2033
- Figure 35: Europe Rf Signal Chain Components Revenue (million), by Country 2025 & 2033
- Figure 36: Europe Rf Signal Chain Components Volume (K), by Country 2025 & 2033
- Figure 37: Europe Rf Signal Chain Components Revenue Share (%), by Country 2025 & 2033
- Figure 38: Europe Rf Signal Chain Components Volume Share (%), by Country 2025 & 2033
- Figure 39: Middle East & Africa Rf Signal Chain Components Revenue (million), by Application 2025 & 2033
- Figure 40: Middle East & Africa Rf Signal Chain Components Volume (K), by Application 2025 & 2033
- Figure 41: Middle East & Africa Rf Signal Chain Components Revenue Share (%), by Application 2025 & 2033
- Figure 42: Middle East & Africa Rf Signal Chain Components Volume Share (%), by Application 2025 & 2033
- Figure 43: Middle East & Africa Rf Signal Chain Components Revenue (million), by Type 2025 & 2033
- Figure 44: Middle East & Africa Rf Signal Chain Components Volume (K), by Type 2025 & 2033
- Figure 45: Middle East & Africa Rf Signal Chain Components Revenue Share (%), by Type 2025 & 2033
- Figure 46: Middle East & Africa Rf Signal Chain Components Volume Share (%), by Type 2025 & 2033
- Figure 47: Middle East & Africa Rf Signal Chain Components Revenue (million), by Country 2025 & 2033
- Figure 48: Middle East & Africa Rf Signal Chain Components Volume (K), by Country 2025 & 2033
- Figure 49: Middle East & Africa Rf Signal Chain Components Revenue Share (%), by Country 2025 & 2033
- Figure 50: Middle East & Africa Rf Signal Chain Components Volume Share (%), by Country 2025 & 2033
- Figure 51: Asia Pacific Rf Signal Chain Components Revenue (million), by Application 2025 & 2033
- Figure 52: Asia Pacific Rf Signal Chain Components Volume (K), by Application 2025 & 2033
- Figure 53: Asia Pacific Rf Signal Chain Components Revenue Share (%), by Application 2025 & 2033
- Figure 54: Asia Pacific Rf Signal Chain Components Volume Share (%), by Application 2025 & 2033
- Figure 55: Asia Pacific Rf Signal Chain Components Revenue (million), by Type 2025 & 2033
- Figure 56: Asia Pacific Rf Signal Chain Components Volume (K), by Type 2025 & 2033
- Figure 57: Asia Pacific Rf Signal Chain Components Revenue Share (%), by Type 2025 & 2033
- Figure 58: Asia Pacific Rf Signal Chain Components Volume Share (%), by Type 2025 & 2033
- Figure 59: Asia Pacific Rf Signal Chain Components Revenue (million), by Country 2025 & 2033
- Figure 60: Asia Pacific Rf Signal Chain Components Volume (K), by Country 2025 & 2033
- Figure 61: Asia Pacific Rf Signal Chain Components Revenue Share (%), by Country 2025 & 2033
- Figure 62: Asia Pacific Rf Signal Chain Components Volume Share (%), by Country 2025 & 2033
List of Tables
- Table 1: Global Rf Signal Chain Components Revenue million Forecast, by Application 2020 & 2033
- Table 2: Global Rf Signal Chain Components Volume K Forecast, by Application 2020 & 2033
- Table 3: Global Rf Signal Chain Components Revenue million Forecast, by Type 2020 & 2033
- Table 4: Global Rf Signal Chain Components Volume K Forecast, by Type 2020 & 2033
- Table 5: Global Rf Signal Chain Components Revenue million Forecast, by Region 2020 & 2033
- Table 6: Global Rf Signal Chain Components Volume K Forecast, by Region 2020 & 2033
- Table 7: Global Rf Signal Chain Components Revenue million Forecast, by Application 2020 & 2033
- Table 8: Global Rf Signal Chain Components Volume K Forecast, by Application 2020 & 2033
- Table 9: Global Rf Signal Chain Components Revenue million Forecast, by Type 2020 & 2033
- Table 10: Global Rf Signal Chain Components Volume K Forecast, by Type 2020 & 2033
- Table 11: Global Rf Signal Chain Components Revenue million Forecast, by Country 2020 & 2033
- Table 12: Global Rf Signal Chain Components Volume K Forecast, by Country 2020 & 2033
- Table 13: United States Rf Signal Chain Components Revenue (million) Forecast, by Application 2020 & 2033
- Table 14: United States Rf Signal Chain Components Volume (K) Forecast, by Application 2020 & 2033
- Table 15: Canada Rf Signal Chain Components Revenue (million) Forecast, by Application 2020 & 2033
- Table 16: Canada Rf Signal Chain Components Volume (K) Forecast, by Application 2020 & 2033
- Table 17: Mexico Rf Signal Chain Components Revenue (million) Forecast, by Application 2020 & 2033
- Table 18: Mexico Rf Signal Chain Components Volume (K) Forecast, by Application 2020 & 2033
- Table 19: Global Rf Signal Chain Components Revenue million Forecast, by Application 2020 & 2033
- Table 20: Global Rf Signal Chain Components Volume K Forecast, by Application 2020 & 2033
- Table 21: Global Rf Signal Chain Components Revenue million Forecast, by Type 2020 & 2033
- Table 22: Global Rf Signal Chain Components Volume K Forecast, by Type 2020 & 2033
- Table 23: Global Rf Signal Chain Components Revenue million Forecast, by Country 2020 & 2033
- Table 24: Global Rf Signal Chain Components Volume K Forecast, by Country 2020 & 2033
- Table 25: Brazil Rf Signal Chain Components Revenue (million) Forecast, by Application 2020 & 2033
- Table 26: Brazil Rf Signal Chain Components Volume (K) Forecast, by Application 2020 & 2033
- Table 27: Argentina Rf Signal Chain Components Revenue (million) Forecast, by Application 2020 & 2033
- Table 28: Argentina Rf Signal Chain Components Volume (K) Forecast, by Application 2020 & 2033
- Table 29: Rest of South America Rf Signal Chain Components Revenue (million) Forecast, by Application 2020 & 2033
- Table 30: Rest of South America Rf Signal Chain Components Volume (K) Forecast, by Application 2020 & 2033
- Table 31: Global Rf Signal Chain Components Revenue million Forecast, by Application 2020 & 2033
- Table 32: Global Rf Signal Chain Components Volume K Forecast, by Application 2020 & 2033
- Table 33: Global Rf Signal Chain Components Revenue million Forecast, by Type 2020 & 2033
- Table 34: Global Rf Signal Chain Components Volume K Forecast, by Type 2020 & 2033
- Table 35: Global Rf Signal Chain Components Revenue million Forecast, by Country 2020 & 2033
- Table 36: Global Rf Signal Chain Components Volume K Forecast, by Country 2020 & 2033
- Table 37: United Kingdom Rf Signal Chain Components Revenue (million) Forecast, by Application 2020 & 2033
- Table 38: United Kingdom Rf Signal Chain Components Volume (K) Forecast, by Application 2020 & 2033
- Table 39: Germany Rf Signal Chain Components Revenue (million) Forecast, by Application 2020 & 2033
- Table 40: Germany Rf Signal Chain Components Volume (K) Forecast, by Application 2020 & 2033
- Table 41: France Rf Signal Chain Components Revenue (million) Forecast, by Application 2020 & 2033
- Table 42: France Rf Signal Chain Components Volume (K) Forecast, by Application 2020 & 2033
- Table 43: Italy Rf Signal Chain Components Revenue (million) Forecast, by Application 2020 & 2033
- Table 44: Italy Rf Signal Chain Components Volume (K) Forecast, by Application 2020 & 2033
- Table 45: Spain Rf Signal Chain Components Revenue (million) Forecast, by Application 2020 & 2033
- Table 46: Spain Rf Signal Chain Components Volume (K) Forecast, by Application 2020 & 2033
- Table 47: Russia Rf Signal Chain Components Revenue (million) Forecast, by Application 2020 & 2033
- Table 48: Russia Rf Signal Chain Components Volume (K) Forecast, by Application 2020 & 2033
- Table 49: Benelux Rf Signal Chain Components Revenue (million) Forecast, by Application 2020 & 2033
- Table 50: Benelux Rf Signal Chain Components Volume (K) Forecast, by Application 2020 & 2033
- Table 51: Nordics Rf Signal Chain Components Revenue (million) Forecast, by Application 2020 & 2033
- Table 52: Nordics Rf Signal Chain Components Volume (K) Forecast, by Application 2020 & 2033
- Table 53: Rest of Europe Rf Signal Chain Components Revenue (million) Forecast, by Application 2020 & 2033
- Table 54: Rest of Europe Rf Signal Chain Components Volume (K) Forecast, by Application 2020 & 2033
- Table 55: Global Rf Signal Chain Components Revenue million Forecast, by Application 2020 & 2033
- Table 56: Global Rf Signal Chain Components Volume K Forecast, by Application 2020 & 2033
- Table 57: Global Rf Signal Chain Components Revenue million Forecast, by Type 2020 & 2033
- Table 58: Global Rf Signal Chain Components Volume K Forecast, by Type 2020 & 2033
- Table 59: Global Rf Signal Chain Components Revenue million Forecast, by Country 2020 & 2033
- Table 60: Global Rf Signal Chain Components Volume K Forecast, by Country 2020 & 2033
- Table 61: Turkey Rf Signal Chain Components Revenue (million) Forecast, by Application 2020 & 2033
- Table 62: Turkey Rf Signal Chain Components Volume (K) Forecast, by Application 2020 & 2033
- Table 63: Israel Rf Signal Chain Components Revenue (million) Forecast, by Application 2020 & 2033
- Table 64: Israel Rf Signal Chain Components Volume (K) Forecast, by Application 2020 & 2033
- Table 65: GCC Rf Signal Chain Components Revenue (million) Forecast, by Application 2020 & 2033
- Table 66: GCC Rf Signal Chain Components Volume (K) Forecast, by Application 2020 & 2033
- Table 67: North Africa Rf Signal Chain Components Revenue (million) Forecast, by Application 2020 & 2033
- Table 68: North Africa Rf Signal Chain Components Volume (K) Forecast, by Application 2020 & 2033
- Table 69: South Africa Rf Signal Chain Components Revenue (million) Forecast, by Application 2020 & 2033
- Table 70: South Africa Rf Signal Chain Components Volume (K) Forecast, by Application 2020 & 2033
- Table 71: Rest of Middle East & Africa Rf Signal Chain Components Revenue (million) Forecast, by Application 2020 & 2033
- Table 72: Rest of Middle East & Africa Rf Signal Chain Components Volume (K) Forecast, by Application 2020 & 2033
- Table 73: Global Rf Signal Chain Components Revenue million Forecast, by Application 2020 & 2033
- Table 74: Global Rf Signal Chain Components Volume K Forecast, by Application 2020 & 2033
- Table 75: Global Rf Signal Chain Components Revenue million Forecast, by Type 2020 & 2033
- Table 76: Global Rf Signal Chain Components Volume K Forecast, by Type 2020 & 2033
- Table 77: Global Rf Signal Chain Components Revenue million Forecast, by Country 2020 & 2033
- Table 78: Global Rf Signal Chain Components Volume K Forecast, by Country 2020 & 2033
- Table 79: China Rf Signal Chain Components Revenue (million) Forecast, by Application 2020 & 2033
- Table 80: China Rf Signal Chain Components Volume (K) Forecast, by Application 2020 & 2033
- Table 81: India Rf Signal Chain Components Revenue (million) Forecast, by Application 2020 & 2033
- Table 82: India Rf Signal Chain Components Volume (K) Forecast, by Application 2020 & 2033
- Table 83: Japan Rf Signal Chain Components Revenue (million) Forecast, by Application 2020 & 2033
- Table 84: Japan Rf Signal Chain Components Volume (K) Forecast, by Application 2020 & 2033
- Table 85: South Korea Rf Signal Chain Components Revenue (million) Forecast, by Application 2020 & 2033
- Table 86: South Korea Rf Signal Chain Components Volume (K) Forecast, by Application 2020 & 2033
- Table 87: ASEAN Rf Signal Chain Components Revenue (million) Forecast, by Application 2020 & 2033
- Table 88: ASEAN Rf Signal Chain Components Volume (K) Forecast, by Application 2020 & 2033
- Table 89: Oceania Rf Signal Chain Components Revenue (million) Forecast, by Application 2020 & 2033
- Table 90: Oceania Rf Signal Chain Components Volume (K) Forecast, by Application 2020 & 2033
- Table 91: Rest of Asia Pacific Rf Signal Chain Components Revenue (million) Forecast, by Application 2020 & 2033
- Table 92: Rest of Asia Pacific Rf Signal Chain Components Volume (K) Forecast, by Application 2020 & 2033
Frequently Asked Questions
1. What is the projected Compound Annual Growth Rate (CAGR) of the Rf Signal Chain Components?
The projected CAGR is approximately XXX%.
2. Which companies are prominent players in the Rf Signal Chain Components?
Key companies in the market include Rohde & Schwarz, Qorvo, Murata Manufacturing, Analog Devices, Inc., Broadcom Inc., Skyworks Solutions, Inc..
3. What are the main segments of the Rf Signal Chain Components?
The market segments include Application, Type.
4. Can you provide details about the market size?
The market size is estimated to be USD XXX million as of 2022.
5. What are some drivers contributing to market growth?
N/A
6. What are the notable trends driving market growth?
N/A
7. Are there any restraints impacting market growth?
N/A
8. Can you provide examples of recent developments in the market?
N/A
9. What pricing options are available for accessing the report?
Pricing options include single-user, multi-user, and enterprise licenses priced at USD 3950.00, USD 5925.00, and USD 7900.00 respectively.
10. Is the market size provided in terms of value or volume?
The market size is provided in terms of value, measured in million and volume, measured in K.
11. Are there any specific market keywords associated with the report?
Yes, the market keyword associated with the report is "Rf Signal Chain Components," which aids in identifying and referencing the specific market segment covered.
12. How do I determine which pricing option suits my needs best?
The pricing options vary based on user requirements and access needs. Individual users may opt for single-user licenses, while businesses requiring broader access may choose multi-user or enterprise licenses for cost-effective access to the report.
13. Are there any additional resources or data provided in the Rf Signal Chain Components report?
While the report offers comprehensive insights, it's advisable to review the specific contents or supplementary materials provided to ascertain if additional resources or data are available.
14. How can I stay updated on further developments or reports in the Rf Signal Chain Components?
To stay informed about further developments, trends, and reports in the Rf Signal Chain Components, consider subscribing to industry newsletters, following relevant companies and organizations, or regularly checking reputable industry news sources and publications.
Methodology
Step 1 - Identification of Relevant Samples Size from Population Database


Step 2 - Approaches for Defining Global Market Size (Value, Volume* & Price*)

Note*: In applicable scenarios
Step 3 - Data Sources
Primary Research
- Web Analytics
- Survey Reports
- Research Institute
- Latest Research Reports
- Opinion Leaders
Secondary Research
- Annual Reports
- White Paper
- Latest Press Release
- Industry Association
- Paid Database
- Investor Presentations

Step 4 - Data Triangulation
Involves using different sources of information in order to increase the validity of a study
These sources are likely to be stakeholders in a program - participants, other researchers, program staff, other community members, and so on.
Then we put all data in single framework & apply various statistical tools to find out the dynamic on the market.
During the analysis stage, feedback from the stakeholder groups would be compared to determine areas of agreement as well as areas of divergence