

Key Insights
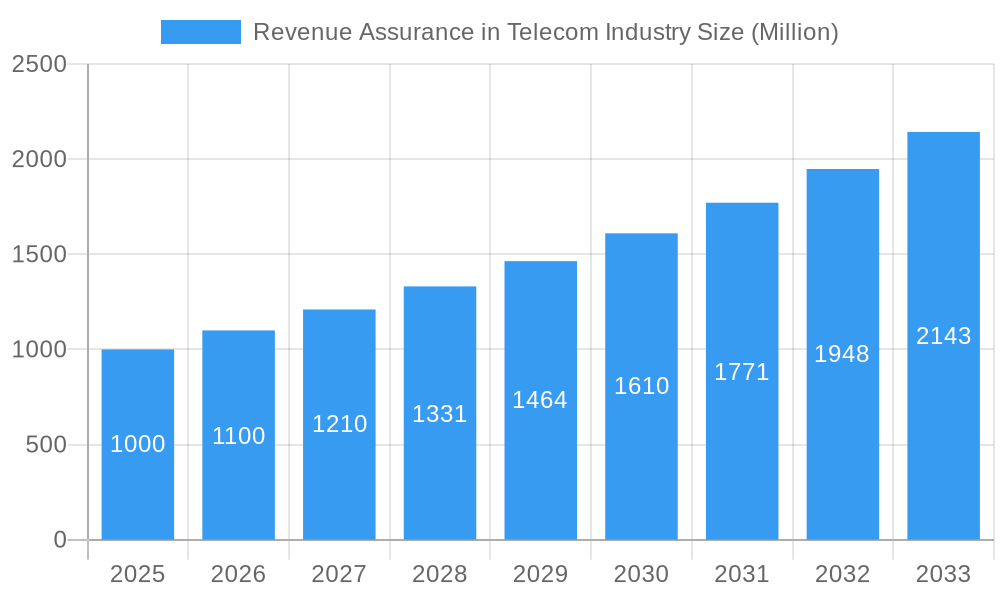
The Revenue Assurance market in the Telecom industry is experiencing robust growth, projected to maintain a Compound Annual Growth Rate (CAGR) of 10% from 2025 to 2033. This expansion is fueled by several key drivers. The increasing complexity of telecom billing systems, coupled with the rise of digital services and subscription models, necessitates sophisticated revenue assurance solutions to prevent revenue leakage and ensure accurate billing. Furthermore, the stringent regulatory environment and the growing focus on compliance further propel market demand. Stringent regulations globally necessitate accurate billing and revenue tracking, pushing telecom companies to adopt advanced revenue assurance solutions. The growth is also driven by the shift towards cloud-based deployments, offering scalability and cost-effectiveness. Major market players, including Amdocs, Tata Consultancy Services, and Subex, are actively investing in research and development to enhance their offerings and meet the evolving needs of telecom operators. Competitive pressures within the telecom sector also contribute to the growth, as operators constantly seek ways to optimize revenue streams and improve operational efficiency.
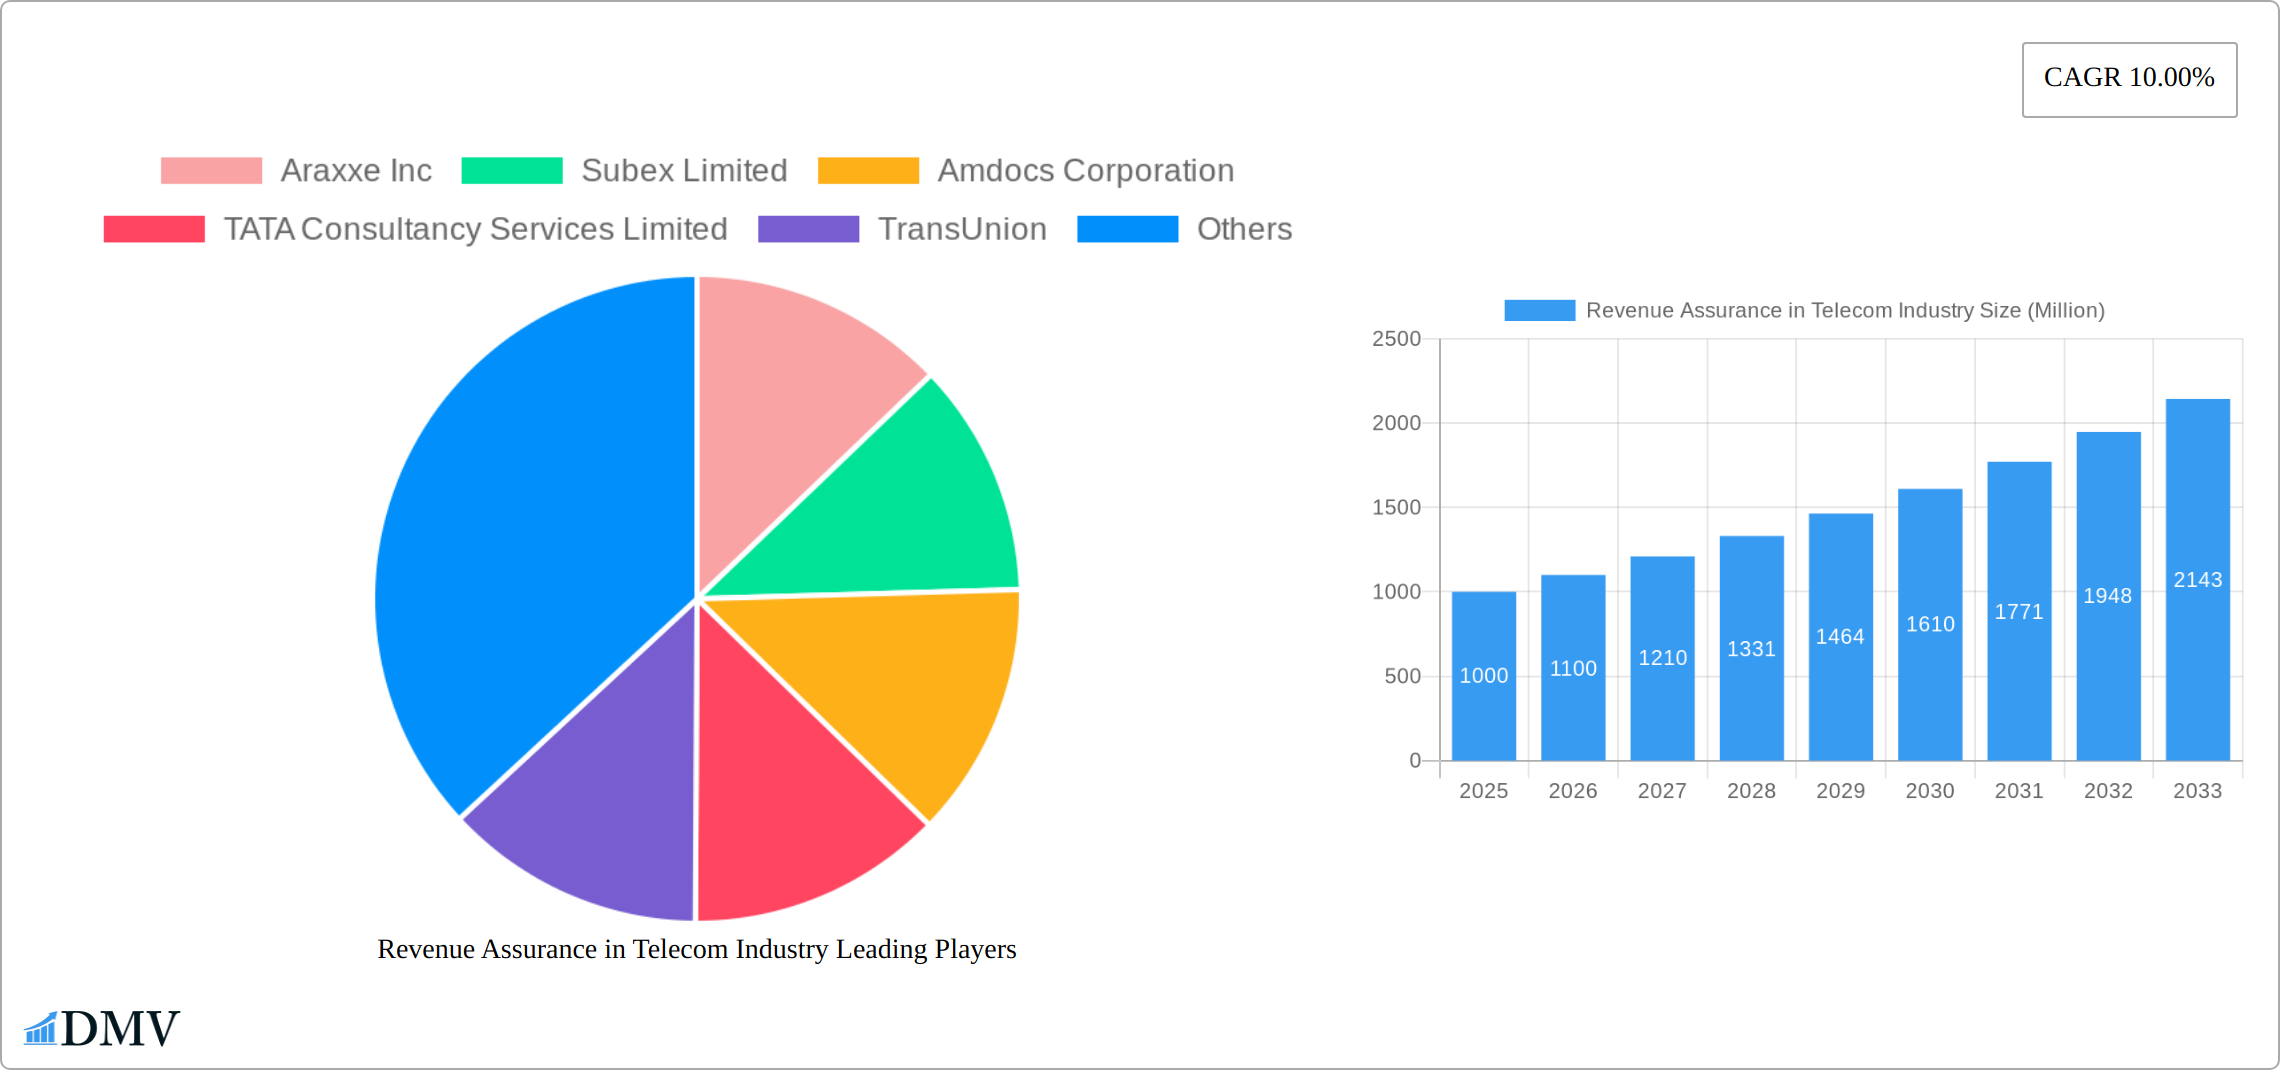
Revenue Assurance in Telecom Industry Market Size (In Billion)
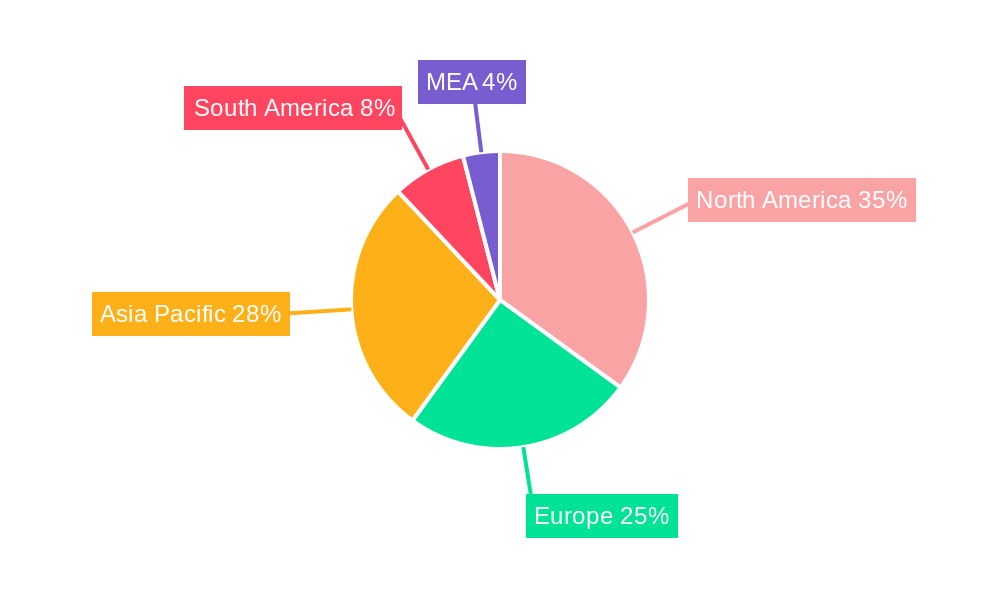
Segment-wise, the Software component is expected to dominate, driven by the increasing adoption of advanced analytics and AI-powered solutions for fraud detection and revenue optimization. Geographically, North America currently holds a significant market share, but the Asia-Pacific region is poised for rapid growth due to the expanding telecom infrastructure and increasing smartphone penetration in developing economies. While challenges exist, such as the high initial investment costs associated with implementing revenue assurance solutions, the long-term benefits in terms of revenue recovery and improved operational efficiency outweigh these barriers, solidifying the market's upward trajectory. The market's projected expansion, therefore, presents significant opportunities for established players and new entrants alike to capitalize on this growing need for robust and reliable revenue assurance systems.
Revenue Assurance in Telecom Industry Company Market Share
Revenue Assurance in Telecom Industry: Market Analysis & Forecast (2019-2033)
This comprehensive report provides an in-depth analysis of the Revenue Assurance in Telecom Industry market, offering invaluable insights for stakeholders seeking to navigate this dynamic landscape. With a study period spanning 2019-2033, a base year of 2025, and an estimated and forecast period of 2025-2033, this report delivers crucial data-driven projections to inform strategic decision-making. The market analysis encompasses key segments, including Software and Services components, Cloud and On-premises deployment modes, and a diverse end-user base covering Telecom, Utilities, BFSI, Hospitality, and other sectors. The report's projected market value exceeds $xx Million by 2033. Leading players such as Araxxe Inc, Subex Limited, Amdocs Corporation, TATA Consultancy Services Limited, TransUnion, Hewlett Packard Enterprise, Adapt IT Holdings Limited, Cartesian, eClerx, and Profit Insight LLC are meticulously profiled.
Revenue Assurance in Telecom Industry Market Composition & Trends
This section delves into the competitive landscape, analyzing market concentration and the dynamics shaping the Revenue Assurance market. The report examines innovation catalysts, regulatory impacts, the presence of substitute products, and detailed end-user profiles. Furthermore, it explores mergers and acquisitions (M&A) activity, quantifying deal values and their influence on market share distribution. Key findings include a highly competitive market with a concentration ratio of xx%, driven by ongoing technological advancements and stringent regulatory compliance needs. Significant M&A activity exceeding $xx Million in total deal value has reshaped the competitive dynamics in the last five years.
- Market Share Distribution (2024): Amdocs Corporation (xx%), Subex Limited (xx%), Araxxe Inc (xx%), Others (xx%).
- M&A Activity (2019-2024): Total deal value exceeding $xx Million, with significant transactions involving [mention specific examples if available, otherwise state "key players consolidating market share"].
- Innovation Catalysts: AI-powered fraud detection, advanced analytics, and automation are driving market innovation.
- Regulatory Landscape: Stringent regulations concerning data privacy and security are shaping market practices.
Revenue Assurance in Telecom Industry Industry Evolution
The Revenue Assurance (RA) landscape within the telecommunications sector has undergone a significant transformation, evolving from basic revenue leakage detection to sophisticated, data-driven risk management. This evolution has been shaped by explosive growth in data consumption, the proliferation of diverse service offerings (including 5G, IoT, and OTT services), and an increasingly complex regulatory environment. Early RA efforts primarily focused on identifying and rectifying common billing errors and revenue leakage points. However, with the advent of Big Data, advanced analytics, and Artificial Intelligence (AI), RA solutions have become proactive, predictive, and holistic. Key technological disruptions, such as the shift to cloud-native architectures and the widespread adoption of AI/ML algorithms for anomaly detection and predictive modeling, have been instrumental. Consumer demands for seamless digital experiences and increased transparency have also placed greater emphasis on accurate and timely billing, indirectly fueling the RA market. Historically, the market experienced a Compound Annual Growth Rate (CAGR) of approximately XX% between 2019 and 2024. Projections indicate a sustained growth trajectory, with an estimated CAGR of XX% anticipated from 2025 to 2033. This robust growth is primarily attributed to the increasing adoption of cloud-based RA solutions, which offer scalability and cost-efficiency, and the escalating need for advanced security and fraud prevention measures. The rising prevalence of digital services, coupled with a corresponding surge in sophisticated fraudulent activities, acts as a significant catalyst for market expansion. The ongoing transition from legacy, rule-based systems to advanced analytics and AI-powered solutions is accelerating this market expansion, enabling telcos to not only protect revenue but also optimize it.
Leading Regions, Countries, or Segments in Revenue Assurance in Telecom Industry
This section identifies the dominant regions, countries, and segments within the Revenue Assurance market. A detailed analysis explores the factors driving market leadership in key areas, including investment trends, government regulations, and specific market conditions. The Telecom end-user segment continues to dominate, accounting for xx% of the market in 2024, followed by BFSI at xx%.
- Key Drivers for Telecom Dominance: High revenue streams, stringent regulatory compliance needs, and a complex billing infrastructure requiring robust revenue assurance solutions.
- Key Drivers for BFSI Growth: Increasing instances of fraud and the need for secure financial transactions.
- Geographic Dominance: North America is expected to remain the leading region, accounting for xx% of the market in 2024, driven by high adoption rates of advanced technologies and strong regulatory frameworks.
Revenue Assurance in Telecom Industry Product Innovations
The revenue assurance market is currently experiencing a wave of transformative product innovations, pushing the boundaries of accuracy, efficiency, and real-time capabilities. Leading this charge are sophisticated AI-powered fraud detection systems that leverage machine learning to identify complex patterns and anomalies indicative of fraud in real-time. Advanced analytics dashboards provide deep insights into revenue streams, enabling operators to visualize trends, pinpoint inefficiencies, and make data-driven decisions. Furthermore, the automation of critical RA workflows, from data reconciliation to dispute resolution, is significantly reducing manual effort and accelerating process cycles. These innovations offer compelling unique selling propositions for telecom operators, including substantial reductions in operational costs, enhanced accuracy in revenue recognition, and a more proactive approach to fraud prevention and revenue leakage mitigation. The seamless integration of these cutting-edge technologies with scalable and flexible cloud platforms is a critical trend, delivering cost-effective and agile solutions that can adapt to the dynamic needs of the modern telecommunications industry.
Propelling Factors for Revenue Assurance in Telecom Industry Growth
Several potent forces are collaboratively propelling the significant growth of the Revenue Assurance market within the telecommunications sector. Technological advancements, particularly the pervasive integration of Artificial Intelligence (AI) and Machine Learning (ML), are revolutionizing the accuracy and efficiency of RA processes, enabling predictive analytics and anomaly detection with unprecedented precision. Economic growth, especially in emerging markets, is fostering a surge in demand for advanced telecom services, consequently magnifying the need for robust and comprehensive revenue assurance frameworks to safeguard these expanding revenue streams. Moreover, the increasingly stringent and evolving regulatory environments across the globe are creating a compelling imperative for telecom operators to enhance their compliance capabilities. This regulatory pressure is a direct driver for increased investment in sophisticated RA solutions that can ensure adherence to diverse compliance mandates and protect against penalties.
Obstacles in the Revenue Assurance in Telecom Industry Market
Despite promising growth, several challenges hinder market expansion. The complexity of integrating new technologies into legacy systems presents an obstacle. Supply chain disruptions can impact the availability of specialized components. Intense competition among vendors necessitates continuous innovation and adaptation to maintain market share. These factors can potentially reduce overall market growth by xx% by 2033.
Future Opportunities in Revenue Assurance in Telecom Industry
The future holds significant opportunities for the Revenue Assurance market. The expansion of 5G networks and the growth of IoT will create new revenue streams and necessitate advanced assurance solutions. The development of AI-powered predictive analytics can improve fraud detection and revenue optimization. Finally, emerging markets in developing countries present considerable untapped potential for growth.
Major Players in the Revenue Assurance in Telecom Industry Ecosystem
- Araxxe Inc
- Subex Limited
- Amdocs Corporation
- TATA Consultancy Services Limited
- TransUnion
- Hewlett Packard Enterprise
- Adapt IT Holdings Limited
- Cartesian
- eClerx
- Profit Insight LLC
Key Developments in Revenue Assurance in Telecom Industry Industry
- 2024 Q3: Amdocs announced a new AI-powered fraud detection platform.
- 2023 Q4: Subex launched an enhanced revenue assurance solution with improved analytics capabilities.
- 2022 Q2: A merger between two smaller revenue assurance companies resulted in a stronger competitor. [Add further developments with dates and impacts as available.]
Strategic Revenue Assurance in Telecom Industry Market Forecast
The Revenue Assurance market within the telecommunications industry is strongly positioned for sustained and accelerated growth in the coming years. This optimistic outlook is underpinned by the relentless pace of technological innovation, an increasingly rigorous regulatory landscape, and the continuous expansion of digital services across the globe. The market is projected to reach a significant valuation of $XX Million by 2033, propelled by an enduring demand for sophisticated solutions that deliver enhanced accuracy, superior efficiency, and robust security in all aspects of revenue management. The ongoing and widespread adoption of cloud-based RA platforms, coupled with the escalating utilization of advanced AI and machine learning capabilities, will serve as further catalysts, driving substantial market expansion and enabling telecom operators to navigate the complexities of modern revenue assurance with greater confidence and effectiveness.
Revenue Assurance in Telecom Industry Segmentation
-
1. Component
- 1.1. Software
- 1.2. Services
-
2. Deployment Mode
- 2.1. Cloud
- 2.2. On-premises
-
3. End User
- 3.1. Telecom
- 3.2. Utilities
- 3.3. BFSI
- 3.4. Hospitality
- 3.5. Other End Users
Revenue Assurance in Telecom Industry Segmentation By Geography
- 1. North America
- 2. Europe
- 3. Asia Pacific
- 4. Rest of the World
Revenue Assurance in Telecom Industry Regional Market Share
Geographic Coverage of Revenue Assurance in Telecom Industry
Revenue Assurance in Telecom Industry REPORT HIGHLIGHTS
| Aspects | Details |
|---|---|
| Study Period | 2020-2034 |
| Base Year | 2025 |
| Estimated Year | 2026 |
| Forecast Period | 2026-2034 |
| Historical Period | 2020-2025 |
| Growth Rate | CAGR of 8.1% from 2020-2034 |
| Segmentation |
|
Table of Contents
- 1. Introduction
- 1.1. Research Scope
- 1.2. Market Segmentation
- 1.3. Research Methodology
- 1.4. Definitions and Assumptions
- 2. Executive Summary
- 2.1. Introduction
- 3. Market Dynamics
- 3.1. Introduction
- 3.2. Market Drivers
- 3.2.1. ; Rising Complex Business Environment and Practices; Rising Need to Adhere to Numerous Revenue Streams
- 3.3. Market Restrains
- 3.3.1. ; Economic Slowdown and Currency Fluctuations
- 3.4. Market Trends
- 3.4.1. Cloud Deployment is Expected to Drive the Market Growth
- 4. Market Factor Analysis
- 4.1. Porters Five Forces
- 4.2. Supply/Value Chain
- 4.3. PESTEL analysis
- 4.4. Market Entropy
- 4.5. Patent/Trademark Analysis
- 5. Global Revenue Assurance in Telecom Industry Analysis, Insights and Forecast, 2020-2032
- 5.1. Market Analysis, Insights and Forecast - by Component
- 5.1.1. Software
- 5.1.2. Services
- 5.2. Market Analysis, Insights and Forecast - by Deployment Mode
- 5.2.1. Cloud
- 5.2.2. On-premises
- 5.3. Market Analysis, Insights and Forecast - by End User
- 5.3.1. Telecom
- 5.3.2. Utilities
- 5.3.3. BFSI
- 5.3.4. Hospitality
- 5.3.5. Other End Users
- 5.4. Market Analysis, Insights and Forecast - by Region
- 5.4.1. North America
- 5.4.2. Europe
- 5.4.3. Asia Pacific
- 5.4.4. Rest of the World
- 5.1. Market Analysis, Insights and Forecast - by Component
- 6. North America Revenue Assurance in Telecom Industry Analysis, Insights and Forecast, 2020-2032
- 6.1. Market Analysis, Insights and Forecast - by Component
- 6.1.1. Software
- 6.1.2. Services
- 6.2. Market Analysis, Insights and Forecast - by Deployment Mode
- 6.2.1. Cloud
- 6.2.2. On-premises
- 6.3. Market Analysis, Insights and Forecast - by End User
- 6.3.1. Telecom
- 6.3.2. Utilities
- 6.3.3. BFSI
- 6.3.4. Hospitality
- 6.3.5. Other End Users
- 6.1. Market Analysis, Insights and Forecast - by Component
- 7. Europe Revenue Assurance in Telecom Industry Analysis, Insights and Forecast, 2020-2032
- 7.1. Market Analysis, Insights and Forecast - by Component
- 7.1.1. Software
- 7.1.2. Services
- 7.2. Market Analysis, Insights and Forecast - by Deployment Mode
- 7.2.1. Cloud
- 7.2.2. On-premises
- 7.3. Market Analysis, Insights and Forecast - by End User
- 7.3.1. Telecom
- 7.3.2. Utilities
- 7.3.3. BFSI
- 7.3.4. Hospitality
- 7.3.5. Other End Users
- 7.1. Market Analysis, Insights and Forecast - by Component
- 8. Asia Pacific Revenue Assurance in Telecom Industry Analysis, Insights and Forecast, 2020-2032
- 8.1. Market Analysis, Insights and Forecast - by Component
- 8.1.1. Software
- 8.1.2. Services
- 8.2. Market Analysis, Insights and Forecast - by Deployment Mode
- 8.2.1. Cloud
- 8.2.2. On-premises
- 8.3. Market Analysis, Insights and Forecast - by End User
- 8.3.1. Telecom
- 8.3.2. Utilities
- 8.3.3. BFSI
- 8.3.4. Hospitality
- 8.3.5. Other End Users
- 8.1. Market Analysis, Insights and Forecast - by Component
- 9. Rest of the World Revenue Assurance in Telecom Industry Analysis, Insights and Forecast, 2020-2032
- 9.1. Market Analysis, Insights and Forecast - by Component
- 9.1.1. Software
- 9.1.2. Services
- 9.2. Market Analysis, Insights and Forecast - by Deployment Mode
- 9.2.1. Cloud
- 9.2.2. On-premises
- 9.3. Market Analysis, Insights and Forecast - by End User
- 9.3.1. Telecom
- 9.3.2. Utilities
- 9.3.3. BFSI
- 9.3.4. Hospitality
- 9.3.5. Other End Users
- 9.1. Market Analysis, Insights and Forecast - by Component
- 10. Competitive Analysis
- 10.1. Global Market Share Analysis 2025
- 10.2. Company Profiles
- 10.2.1 Araxxe Inc
- 10.2.1.1. Overview
- 10.2.1.2. Products
- 10.2.1.3. SWOT Analysis
- 10.2.1.4. Recent Developments
- 10.2.1.5. Financials (Based on Availability)
- 10.2.2 Subex Limited
- 10.2.2.1. Overview
- 10.2.2.2. Products
- 10.2.2.3. SWOT Analysis
- 10.2.2.4. Recent Developments
- 10.2.2.5. Financials (Based on Availability)
- 10.2.3 Amdocs Corporation
- 10.2.3.1. Overview
- 10.2.3.2. Products
- 10.2.3.3. SWOT Analysis
- 10.2.3.4. Recent Developments
- 10.2.3.5. Financials (Based on Availability)
- 10.2.4 TATA Consultancy Services Limited
- 10.2.4.1. Overview
- 10.2.4.2. Products
- 10.2.4.3. SWOT Analysis
- 10.2.4.4. Recent Developments
- 10.2.4.5. Financials (Based on Availability)
- 10.2.5 TransUnion
- 10.2.5.1. Overview
- 10.2.5.2. Products
- 10.2.5.3. SWOT Analysis
- 10.2.5.4. Recent Developments
- 10.2.5.5. Financials (Based on Availability)
- 10.2.6 Hewlett Packard Enterprise
- 10.2.6.1. Overview
- 10.2.6.2. Products
- 10.2.6.3. SWOT Analysis
- 10.2.6.4. Recent Developments
- 10.2.6.5. Financials (Based on Availability)
- 10.2.7 Adapt IT Holdings Limited
- 10.2.7.1. Overview
- 10.2.7.2. Products
- 10.2.7.3. SWOT Analysis
- 10.2.7.4. Recent Developments
- 10.2.7.5. Financials (Based on Availability)
- 10.2.8 Cartesian
- 10.2.8.1. Overview
- 10.2.8.2. Products
- 10.2.8.3. SWOT Analysis
- 10.2.8.4. Recent Developments
- 10.2.8.5. Financials (Based on Availability)
- 10.2.9 eClerx
- 10.2.9.1. Overview
- 10.2.9.2. Products
- 10.2.9.3. SWOT Analysis
- 10.2.9.4. Recent Developments
- 10.2.9.5. Financials (Based on Availability)
- 10.2.10 Profit Insight LLC
- 10.2.10.1. Overview
- 10.2.10.2. Products
- 10.2.10.3. SWOT Analysis
- 10.2.10.4. Recent Developments
- 10.2.10.5. Financials (Based on Availability)
- 10.2.1 Araxxe Inc
List of Figures
- Figure 1: Global Revenue Assurance in Telecom Industry Revenue Breakdown (undefined, %) by Region 2025 & 2033
- Figure 2: Global Revenue Assurance in Telecom Industry Volume Breakdown (K Unit, %) by Region 2025 & 2033
- Figure 3: North America Revenue Assurance in Telecom Industry Revenue (undefined), by Component 2025 & 2033
- Figure 4: North America Revenue Assurance in Telecom Industry Volume (K Unit), by Component 2025 & 2033
- Figure 5: North America Revenue Assurance in Telecom Industry Revenue Share (%), by Component 2025 & 2033
- Figure 6: North America Revenue Assurance in Telecom Industry Volume Share (%), by Component 2025 & 2033
- Figure 7: North America Revenue Assurance in Telecom Industry Revenue (undefined), by Deployment Mode 2025 & 2033
- Figure 8: North America Revenue Assurance in Telecom Industry Volume (K Unit), by Deployment Mode 2025 & 2033
- Figure 9: North America Revenue Assurance in Telecom Industry Revenue Share (%), by Deployment Mode 2025 & 2033
- Figure 10: North America Revenue Assurance in Telecom Industry Volume Share (%), by Deployment Mode 2025 & 2033
- Figure 11: North America Revenue Assurance in Telecom Industry Revenue (undefined), by End User 2025 & 2033
- Figure 12: North America Revenue Assurance in Telecom Industry Volume (K Unit), by End User 2025 & 2033
- Figure 13: North America Revenue Assurance in Telecom Industry Revenue Share (%), by End User 2025 & 2033
- Figure 14: North America Revenue Assurance in Telecom Industry Volume Share (%), by End User 2025 & 2033
- Figure 15: North America Revenue Assurance in Telecom Industry Revenue (undefined), by Country 2025 & 2033
- Figure 16: North America Revenue Assurance in Telecom Industry Volume (K Unit), by Country 2025 & 2033
- Figure 17: North America Revenue Assurance in Telecom Industry Revenue Share (%), by Country 2025 & 2033
- Figure 18: North America Revenue Assurance in Telecom Industry Volume Share (%), by Country 2025 & 2033
- Figure 19: Europe Revenue Assurance in Telecom Industry Revenue (undefined), by Component 2025 & 2033
- Figure 20: Europe Revenue Assurance in Telecom Industry Volume (K Unit), by Component 2025 & 2033
- Figure 21: Europe Revenue Assurance in Telecom Industry Revenue Share (%), by Component 2025 & 2033
- Figure 22: Europe Revenue Assurance in Telecom Industry Volume Share (%), by Component 2025 & 2033
- Figure 23: Europe Revenue Assurance in Telecom Industry Revenue (undefined), by Deployment Mode 2025 & 2033
- Figure 24: Europe Revenue Assurance in Telecom Industry Volume (K Unit), by Deployment Mode 2025 & 2033
- Figure 25: Europe Revenue Assurance in Telecom Industry Revenue Share (%), by Deployment Mode 2025 & 2033
- Figure 26: Europe Revenue Assurance in Telecom Industry Volume Share (%), by Deployment Mode 2025 & 2033
- Figure 27: Europe Revenue Assurance in Telecom Industry Revenue (undefined), by End User 2025 & 2033
- Figure 28: Europe Revenue Assurance in Telecom Industry Volume (K Unit), by End User 2025 & 2033
- Figure 29: Europe Revenue Assurance in Telecom Industry Revenue Share (%), by End User 2025 & 2033
- Figure 30: Europe Revenue Assurance in Telecom Industry Volume Share (%), by End User 2025 & 2033
- Figure 31: Europe Revenue Assurance in Telecom Industry Revenue (undefined), by Country 2025 & 2033
- Figure 32: Europe Revenue Assurance in Telecom Industry Volume (K Unit), by Country 2025 & 2033
- Figure 33: Europe Revenue Assurance in Telecom Industry Revenue Share (%), by Country 2025 & 2033
- Figure 34: Europe Revenue Assurance in Telecom Industry Volume Share (%), by Country 2025 & 2033
- Figure 35: Asia Pacific Revenue Assurance in Telecom Industry Revenue (undefined), by Component 2025 & 2033
- Figure 36: Asia Pacific Revenue Assurance in Telecom Industry Volume (K Unit), by Component 2025 & 2033
- Figure 37: Asia Pacific Revenue Assurance in Telecom Industry Revenue Share (%), by Component 2025 & 2033
- Figure 38: Asia Pacific Revenue Assurance in Telecom Industry Volume Share (%), by Component 2025 & 2033
- Figure 39: Asia Pacific Revenue Assurance in Telecom Industry Revenue (undefined), by Deployment Mode 2025 & 2033
- Figure 40: Asia Pacific Revenue Assurance in Telecom Industry Volume (K Unit), by Deployment Mode 2025 & 2033
- Figure 41: Asia Pacific Revenue Assurance in Telecom Industry Revenue Share (%), by Deployment Mode 2025 & 2033
- Figure 42: Asia Pacific Revenue Assurance in Telecom Industry Volume Share (%), by Deployment Mode 2025 & 2033
- Figure 43: Asia Pacific Revenue Assurance in Telecom Industry Revenue (undefined), by End User 2025 & 2033
- Figure 44: Asia Pacific Revenue Assurance in Telecom Industry Volume (K Unit), by End User 2025 & 2033
- Figure 45: Asia Pacific Revenue Assurance in Telecom Industry Revenue Share (%), by End User 2025 & 2033
- Figure 46: Asia Pacific Revenue Assurance in Telecom Industry Volume Share (%), by End User 2025 & 2033
- Figure 47: Asia Pacific Revenue Assurance in Telecom Industry Revenue (undefined), by Country 2025 & 2033
- Figure 48: Asia Pacific Revenue Assurance in Telecom Industry Volume (K Unit), by Country 2025 & 2033
- Figure 49: Asia Pacific Revenue Assurance in Telecom Industry Revenue Share (%), by Country 2025 & 2033
- Figure 50: Asia Pacific Revenue Assurance in Telecom Industry Volume Share (%), by Country 2025 & 2033
- Figure 51: Rest of the World Revenue Assurance in Telecom Industry Revenue (undefined), by Component 2025 & 2033
- Figure 52: Rest of the World Revenue Assurance in Telecom Industry Volume (K Unit), by Component 2025 & 2033
- Figure 53: Rest of the World Revenue Assurance in Telecom Industry Revenue Share (%), by Component 2025 & 2033
- Figure 54: Rest of the World Revenue Assurance in Telecom Industry Volume Share (%), by Component 2025 & 2033
- Figure 55: Rest of the World Revenue Assurance in Telecom Industry Revenue (undefined), by Deployment Mode 2025 & 2033
- Figure 56: Rest of the World Revenue Assurance in Telecom Industry Volume (K Unit), by Deployment Mode 2025 & 2033
- Figure 57: Rest of the World Revenue Assurance in Telecom Industry Revenue Share (%), by Deployment Mode 2025 & 2033
- Figure 58: Rest of the World Revenue Assurance in Telecom Industry Volume Share (%), by Deployment Mode 2025 & 2033
- Figure 59: Rest of the World Revenue Assurance in Telecom Industry Revenue (undefined), by End User 2025 & 2033
- Figure 60: Rest of the World Revenue Assurance in Telecom Industry Volume (K Unit), by End User 2025 & 2033
- Figure 61: Rest of the World Revenue Assurance in Telecom Industry Revenue Share (%), by End User 2025 & 2033
- Figure 62: Rest of the World Revenue Assurance in Telecom Industry Volume Share (%), by End User 2025 & 2033
- Figure 63: Rest of the World Revenue Assurance in Telecom Industry Revenue (undefined), by Country 2025 & 2033
- Figure 64: Rest of the World Revenue Assurance in Telecom Industry Volume (K Unit), by Country 2025 & 2033
- Figure 65: Rest of the World Revenue Assurance in Telecom Industry Revenue Share (%), by Country 2025 & 2033
- Figure 66: Rest of the World Revenue Assurance in Telecom Industry Volume Share (%), by Country 2025 & 2033
List of Tables
- Table 1: Global Revenue Assurance in Telecom Industry Revenue undefined Forecast, by Component 2020 & 2033
- Table 2: Global Revenue Assurance in Telecom Industry Volume K Unit Forecast, by Component 2020 & 2033
- Table 3: Global Revenue Assurance in Telecom Industry Revenue undefined Forecast, by Deployment Mode 2020 & 2033
- Table 4: Global Revenue Assurance in Telecom Industry Volume K Unit Forecast, by Deployment Mode 2020 & 2033
- Table 5: Global Revenue Assurance in Telecom Industry Revenue undefined Forecast, by End User 2020 & 2033
- Table 6: Global Revenue Assurance in Telecom Industry Volume K Unit Forecast, by End User 2020 & 2033
- Table 7: Global Revenue Assurance in Telecom Industry Revenue undefined Forecast, by Region 2020 & 2033
- Table 8: Global Revenue Assurance in Telecom Industry Volume K Unit Forecast, by Region 2020 & 2033
- Table 9: Global Revenue Assurance in Telecom Industry Revenue undefined Forecast, by Component 2020 & 2033
- Table 10: Global Revenue Assurance in Telecom Industry Volume K Unit Forecast, by Component 2020 & 2033
- Table 11: Global Revenue Assurance in Telecom Industry Revenue undefined Forecast, by Deployment Mode 2020 & 2033
- Table 12: Global Revenue Assurance in Telecom Industry Volume K Unit Forecast, by Deployment Mode 2020 & 2033
- Table 13: Global Revenue Assurance in Telecom Industry Revenue undefined Forecast, by End User 2020 & 2033
- Table 14: Global Revenue Assurance in Telecom Industry Volume K Unit Forecast, by End User 2020 & 2033
- Table 15: Global Revenue Assurance in Telecom Industry Revenue undefined Forecast, by Country 2020 & 2033
- Table 16: Global Revenue Assurance in Telecom Industry Volume K Unit Forecast, by Country 2020 & 2033
- Table 17: Global Revenue Assurance in Telecom Industry Revenue undefined Forecast, by Component 2020 & 2033
- Table 18: Global Revenue Assurance in Telecom Industry Volume K Unit Forecast, by Component 2020 & 2033
- Table 19: Global Revenue Assurance in Telecom Industry Revenue undefined Forecast, by Deployment Mode 2020 & 2033
- Table 20: Global Revenue Assurance in Telecom Industry Volume K Unit Forecast, by Deployment Mode 2020 & 2033
- Table 21: Global Revenue Assurance in Telecom Industry Revenue undefined Forecast, by End User 2020 & 2033
- Table 22: Global Revenue Assurance in Telecom Industry Volume K Unit Forecast, by End User 2020 & 2033
- Table 23: Global Revenue Assurance in Telecom Industry Revenue undefined Forecast, by Country 2020 & 2033
- Table 24: Global Revenue Assurance in Telecom Industry Volume K Unit Forecast, by Country 2020 & 2033
- Table 25: Global Revenue Assurance in Telecom Industry Revenue undefined Forecast, by Component 2020 & 2033
- Table 26: Global Revenue Assurance in Telecom Industry Volume K Unit Forecast, by Component 2020 & 2033
- Table 27: Global Revenue Assurance in Telecom Industry Revenue undefined Forecast, by Deployment Mode 2020 & 2033
- Table 28: Global Revenue Assurance in Telecom Industry Volume K Unit Forecast, by Deployment Mode 2020 & 2033
- Table 29: Global Revenue Assurance in Telecom Industry Revenue undefined Forecast, by End User 2020 & 2033
- Table 30: Global Revenue Assurance in Telecom Industry Volume K Unit Forecast, by End User 2020 & 2033
- Table 31: Global Revenue Assurance in Telecom Industry Revenue undefined Forecast, by Country 2020 & 2033
- Table 32: Global Revenue Assurance in Telecom Industry Volume K Unit Forecast, by Country 2020 & 2033
- Table 33: Global Revenue Assurance in Telecom Industry Revenue undefined Forecast, by Component 2020 & 2033
- Table 34: Global Revenue Assurance in Telecom Industry Volume K Unit Forecast, by Component 2020 & 2033
- Table 35: Global Revenue Assurance in Telecom Industry Revenue undefined Forecast, by Deployment Mode 2020 & 2033
- Table 36: Global Revenue Assurance in Telecom Industry Volume K Unit Forecast, by Deployment Mode 2020 & 2033
- Table 37: Global Revenue Assurance in Telecom Industry Revenue undefined Forecast, by End User 2020 & 2033
- Table 38: Global Revenue Assurance in Telecom Industry Volume K Unit Forecast, by End User 2020 & 2033
- Table 39: Global Revenue Assurance in Telecom Industry Revenue undefined Forecast, by Country 2020 & 2033
- Table 40: Global Revenue Assurance in Telecom Industry Volume K Unit Forecast, by Country 2020 & 2033
Frequently Asked Questions
1. What is the projected Compound Annual Growth Rate (CAGR) of the Revenue Assurance in Telecom Industry?
The projected CAGR is approximately 8.1%.
2. Which companies are prominent players in the Revenue Assurance in Telecom Industry?
Key companies in the market include Araxxe Inc, Subex Limited, Amdocs Corporation, TATA Consultancy Services Limited, TransUnion, Hewlett Packard Enterprise, Adapt IT Holdings Limited, Cartesian, eClerx, Profit Insight LLC.
3. What are the main segments of the Revenue Assurance in Telecom Industry?
The market segments include Component, Deployment Mode, End User.
4. Can you provide details about the market size?
The market size is estimated to be USD XXX N/A as of 2022.
5. What are some drivers contributing to market growth?
; Rising Complex Business Environment and Practices; Rising Need to Adhere to Numerous Revenue Streams.
6. What are the notable trends driving market growth?
Cloud Deployment is Expected to Drive the Market Growth.
7. Are there any restraints impacting market growth?
; Economic Slowdown and Currency Fluctuations.
8. Can you provide examples of recent developments in the market?
N/A
9. What pricing options are available for accessing the report?
Pricing options include single-user, multi-user, and enterprise licenses priced at USD 4750, USD 5250, and USD 8750 respectively.
10. Is the market size provided in terms of value or volume?
The market size is provided in terms of value, measured in N/A and volume, measured in K Unit.
11. Are there any specific market keywords associated with the report?
Yes, the market keyword associated with the report is "Revenue Assurance in Telecom Industry," which aids in identifying and referencing the specific market segment covered.
12. How do I determine which pricing option suits my needs best?
The pricing options vary based on user requirements and access needs. Individual users may opt for single-user licenses, while businesses requiring broader access may choose multi-user or enterprise licenses for cost-effective access to the report.
13. Are there any additional resources or data provided in the Revenue Assurance in Telecom Industry report?
While the report offers comprehensive insights, it's advisable to review the specific contents or supplementary materials provided to ascertain if additional resources or data are available.
14. How can I stay updated on further developments or reports in the Revenue Assurance in Telecom Industry?
To stay informed about further developments, trends, and reports in the Revenue Assurance in Telecom Industry, consider subscribing to industry newsletters, following relevant companies and organizations, or regularly checking reputable industry news sources and publications.
Methodology
Step 1 - Identification of Relevant Samples Size from Population Database


Step 2 - Approaches for Defining Global Market Size (Value, Volume* & Price*)

Note*: In applicable scenarios
Step 3 - Data Sources
Primary Research
- Web Analytics
- Survey Reports
- Research Institute
- Latest Research Reports
- Opinion Leaders
Secondary Research
- Annual Reports
- White Paper
- Latest Press Release
- Industry Association
- Paid Database
- Investor Presentations

Step 4 - Data Triangulation
Involves using different sources of information in order to increase the validity of a study
These sources are likely to be stakeholders in a program - participants, other researchers, program staff, other community members, and so on.
Then we put all data in single framework & apply various statistical tools to find out the dynamic on the market.
During the analysis stage, feedback from the stakeholder groups would be compared to determine areas of agreement as well as areas of divergence