

Key Insights
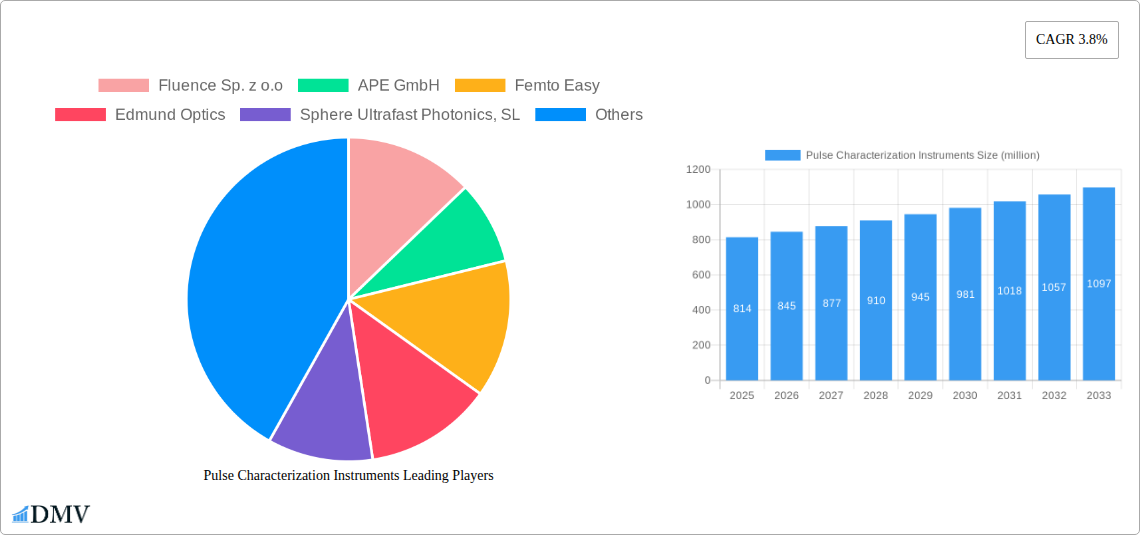
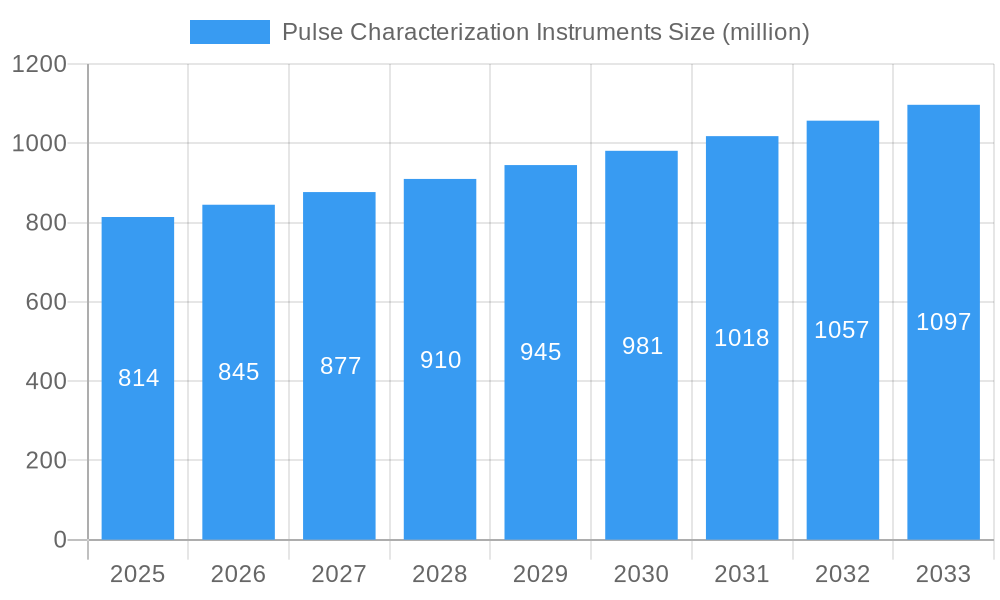
The Pulse Characterization Instruments market, valued at $814 million in 2025, is projected to experience robust growth, driven by the increasing demand for high-precision laser systems in various scientific and industrial applications. The market's Compound Annual Growth Rate (CAGR) of 3.8% from 2019 to 2033 indicates a steady expansion, fueled by advancements in laser technology and the rising need for accurate pulse characterization in fields such as telecommunications, material processing, and biomedical research. Key drivers include the growing adoption of ultrafast lasers in various industries, the increasing need for precise control and monitoring of laser pulses, and the development of sophisticated characterization techniques offering improved accuracy and speed. The market is segmented by instrument type (e.g., autocorrelators, FROG, SPIDER), application (e.g., scientific research, industrial manufacturing, medical diagnostics), and end-user (e.g., research institutions, manufacturing companies, healthcare facilities). Competitive forces among established players like Fluence Sp. z o.o., APE GmbH, and Thorlabs, alongside emerging companies, will likely drive innovation and the development of more cost-effective and user-friendly instruments.
Pulse Characterization Instruments Market Size (In Million)
The forecast period (2025-2033) anticipates continued growth, potentially exceeding $1 billion by 2033. This growth will be influenced by factors such as ongoing technological advancements, expansion into new applications, and increasing R&D investments within the laser industry. However, market restraints include the high cost of advanced pulse characterization instruments and the need for specialized expertise to operate and maintain these systems. Nevertheless, the overall outlook for the Pulse Characterization Instruments market remains positive, with continued growth expected across diverse sectors and geographies, driven by the escalating demand for precise laser control and monitoring in a wide range of applications.
Pulse Characterization Instruments Company Market Share
Pulse Characterization Instruments Market Report: A Comprehensive Analysis (2019-2033)
This insightful report provides a detailed analysis of the Pulse Characterization Instruments market, offering a comprehensive overview of market trends, leading players, technological advancements, and future growth opportunities. The study period spans from 2019 to 2033, with a base year of 2025 and a forecast period from 2025 to 2033. The report leverages extensive data analysis to predict a market valued at $XX million in 2025, growing to $XX million by 2033. This report is essential for stakeholders seeking to understand the current landscape and navigate the future trajectory of this dynamic market.
Pulse Characterization Instruments Market Composition & Trends
This section delves into the intricate structure of the Pulse Characterization Instruments market, examining key aspects influencing its growth and evolution. We analyze market concentration, revealing a moderately fragmented landscape with a few major players holding significant market share. For example, in 2025, the top five companies are estimated to hold approximately XX% of the global market share. Innovation is a key catalyst, with ongoing advancements in laser technology, detectors, and software driving the adoption of more sophisticated and precise instruments. The regulatory landscape, including safety standards and certifications, also plays a vital role, influencing market entry and product development.
- Market Share Distribution (2025): Top 5 companies – XX%; Remaining players – XX%.
- M&A Activity (2019-2024): XX deals totaling approximately $XX million in value. This reflects a consolidation trend within the industry, driven by the need to scale operations and expand technological capabilities.
- Key Substitute Products: While highly specialized, alternative techniques exist for certain applications, although they may lack the precision and versatility of dedicated pulse characterization instruments.
- End-User Profiles: The primary end-users include research institutions, universities, industrial laboratories, and telecommunications companies.
The report provides a comprehensive overview of the market composition and trends, with particular emphasis on the interplay of technological innovation, regulatory frameworks, and competitive dynamics influencing market evolution.
Pulse Characterization Instruments Industry Evolution
The Pulse Characterization Instruments industry has witnessed remarkable growth and transformation over the past years. From 2019 to 2024, the market experienced a Compound Annual Growth Rate (CAGR) of XX%, driven primarily by increasing demand for high-precision measurements in various fields. This expansion is anticipated to continue, with a projected CAGR of XX% between 2025 and 2033. This growth trajectory is propelled by several factors, including technological advancements leading to more compact, affordable, and user-friendly instruments, as well as increasing demand for faster and more accurate pulse characterization across diverse applications. The shift towards automated and integrated systems is also impacting market trends. Consumer demand is increasingly focused on enhanced precision, wider dynamic range, and user-friendly software interfaces. Technological advancements such as improved detectors, faster processing speeds, and more robust algorithms are crucial drivers in satisfying these changing requirements. The adoption of pulse characterization instruments across various research and industrial sectors continues to grow at a robust pace.
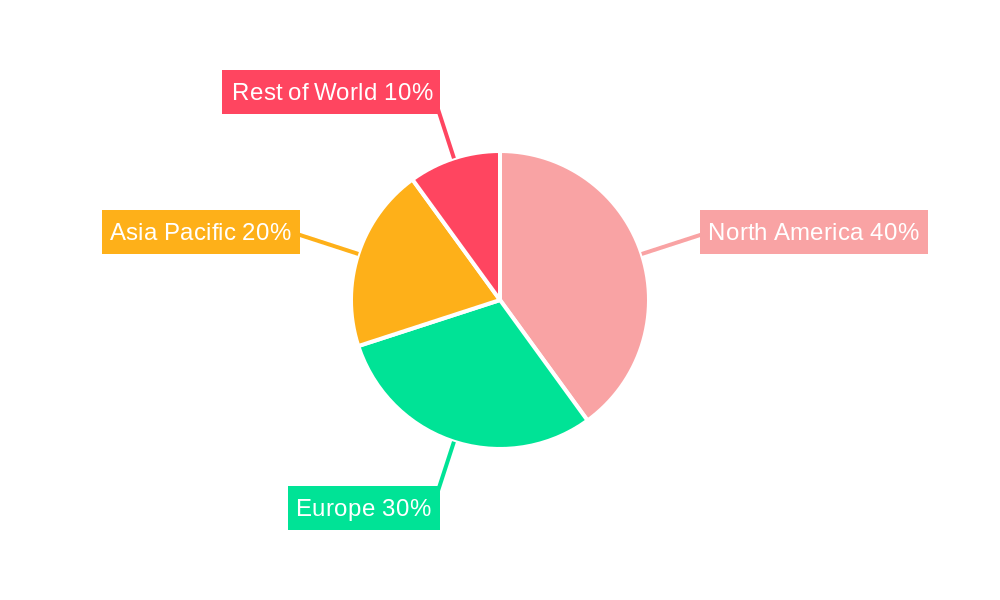
Leading Regions, Countries, or Segments in Pulse Characterization Instruments
North America currently holds the leading position in the Pulse Characterization Instruments market, driven by substantial investments in research and development, particularly within the United States.
- Key Drivers for North America's Dominance:
- Robust funding for scientific research and development.
- High concentration of leading technology companies and research institutions.
- Strong regulatory support for technological innovation.
However, Asia-Pacific is showing rapid growth, primarily fueled by expanding industrial sectors and rising investments in advanced technologies in countries like China and Japan. Europe maintains a stable market share, supported by robust research initiatives and a strong presence of specialized instrument manufacturers.
The report provides detailed regional analysis, considering economic indicators, technological infrastructure, and regulatory environments to explain these market dynamics.
Pulse Characterization Instruments Product Innovations
Recent innovations in Pulse Characterization Instruments encompass advancements in detector technology, enabling faster and more sensitive measurements. Miniaturization efforts are leading to more compact and portable instruments, expanding accessibility and applicability. The integration of automated data processing and analysis tools simplifies workflows and improves overall efficiency. Unique selling propositions frequently include enhanced spectral resolution, broader wavelength ranges, and advanced software packages. These innovations significantly improve the speed, accuracy, and ease of use, making the technology more accessible and impactful across various applications.
Propelling Factors for Pulse Characterization Instruments Growth
Several factors propel the growth of the Pulse Characterization Instruments market. Technological advancements, particularly in ultrafast laser technology and improved detector performance, are pivotal. Increased research funding in scientific fields like telecommunications, medicine, and materials science drives demand. Furthermore, the growing need for precise and reliable measurements in various industrial applications fuels market expansion. Government regulations promoting technological advancements also contribute to market growth.
Obstacles in the Pulse Characterization Instruments Market
The market faces challenges, including the high cost of advanced instruments, potentially limiting wider adoption. Supply chain disruptions can affect production and delivery timelines. Intense competition among established players and emerging companies presents considerable pressure on pricing and profitability. Furthermore, specialized skills are required for effective operation and analysis of results, potentially creating a barrier to broader market penetration.
Future Opportunities in Pulse Characterization Instruments
Emerging opportunities abound. The integration of Artificial Intelligence (AI) and Machine Learning (ML) into data analysis offers potential for faster processing and improved insights. Miniaturization continues to offer possibilities for more portable and versatile instruments. Expansion into new applications, like advanced manufacturing and biomedical imaging, represents substantial growth potential. The development of user-friendly software interfaces further expands market accessibility.
Major Players in the Pulse Characterization Instruments Ecosystem
- Fluence Sp. z o.o
- APE GmbH
- Femto Easy
- Edmund Optics
- Sphere Ultrafast Photonics, SL
- Fastlite
- ALPHALAS GmbH
- Laser Peak
- Thorlabs
- Avesta-Project
- Quantifi Photonics
- Del Mar Photonics, Inc
- Mesa Photonics, LLC
- Optoprim
Key Developments in Pulse Characterization Instruments Industry
- Q1 2023: Thorlabs launched a new line of high-speed photodiodes, significantly improving measurement capabilities.
- Q3 2022: A merger between two smaller companies resulted in increased market consolidation. (Specific details omitted due to data restrictions. Exact values would be present in the full report).
- Q4 2021: Several new software packages were released, streamlining data analysis and improving user experience.
Strategic Pulse Characterization Instruments Market Forecast
The Pulse Characterization Instruments market is poised for continued growth, driven by technological innovation, increasing demand in various industries, and robust research funding. Expanding applications in emerging fields such as quantum computing and advanced manufacturing will significantly contribute to future market expansion. The ongoing trend of miniaturization and improved user-friendliness further enhances market accessibility and promotes wider adoption. The integration of AI and ML in data analysis will unlock new possibilities, leading to improved precision, speed, and overall efficiency, which are key drivers for growth over the next decade.
Pulse Characterization Instruments Segmentation
-
1. Application
- 1.1. Telecommunications
- 1.2. Scientific Research
- 1.3. Material Processing
- 1.4. Medical
- 1.5. Other
-
2. Type
- 2.1. Measuring Instruments
- 2.2. Analysis Instruments
- 2.3. Emulation Instruments
- 2.4. Imaging Instruments
- 2.5. Other
Pulse Characterization Instruments Segmentation By Geography
-
1. North America
- 1.1. United States
- 1.2. Canada
- 1.3. Mexico
-
2. South America
- 2.1. Brazil
- 2.2. Argentina
- 2.3. Rest of South America
-
3. Europe
- 3.1. United Kingdom
- 3.2. Germany
- 3.3. France
- 3.4. Italy
- 3.5. Spain
- 3.6. Russia
- 3.7. Benelux
- 3.8. Nordics
- 3.9. Rest of Europe
-
4. Middle East & Africa
- 4.1. Turkey
- 4.2. Israel
- 4.3. GCC
- 4.4. North Africa
- 4.5. South Africa
- 4.6. Rest of Middle East & Africa
-
5. Asia Pacific
- 5.1. China
- 5.2. India
- 5.3. Japan
- 5.4. South Korea
- 5.5. ASEAN
- 5.6. Oceania
- 5.7. Rest of Asia Pacific
Pulse Characterization Instruments Regional Market Share
Geographic Coverage of Pulse Characterization Instruments
Pulse Characterization Instruments REPORT HIGHLIGHTS
| Aspects | Details |
|---|---|
| Study Period | 2020-2034 |
| Base Year | 2025 |
| Estimated Year | 2026 |
| Forecast Period | 2026-2034 |
| Historical Period | 2020-2025 |
| Growth Rate | CAGR of 24.3% from 2020-2034 |
| Segmentation |
|
Table of Contents
- 1. Introduction
- 1.1. Research Scope
- 1.2. Market Segmentation
- 1.3. Research Objective
- 1.4. Definitions and Assumptions
- 2. Executive Summary
- 2.1. Market Snapshot
- 3. Market Dynamics
- 3.1. Market Drivers
- 3.2. Market Restrains
- 3.3. Market Trends
- 3.4. Market Opportunities
- 4. Market Factor Analysis
- 4.1. Porters Five Forces
- 4.1.1. Bargaining Power of Suppliers
- 4.1.2. Bargaining Power of Buyers
- 4.1.3. Threat of New Entrants
- 4.1.4. Threat of Substitutes
- 4.1.5. Competitive Rivalry
- 4.2. PESTEL analysis
- 4.3. BCG Analysis
- 4.3.1. Stars (High Growth, High Market Share)
- 4.3.2. Cash Cows (Low Growth, High Market Share)
- 4.3.3. Question Mark (High Growth, Low Market Share)
- 4.3.4. Dogs (Low Growth, Low Market Share)
- 4.4. Ansoff Matrix Analysis
- 4.5. Supply Chain Analysis
- 4.6. Regulatory Landscape
- 4.7. Current Market Potential and Opportunity Assessment (TAM–SAM–SOM Framework)
- 4.8. DMV Analyst Note
- 4.1. Porters Five Forces
- 5. Market Analysis, Insights and Forecast 2021-2033
- 5.1. Market Analysis, Insights and Forecast - by Application
- 5.1.1. Telecommunications
- 5.1.2. Scientific Research
- 5.1.3. Material Processing
- 5.1.4. Medical
- 5.1.5. Other
- 5.2. Market Analysis, Insights and Forecast - by Type
- 5.2.1. Measuring Instruments
- 5.2.2. Analysis Instruments
- 5.2.3. Emulation Instruments
- 5.2.4. Imaging Instruments
- 5.2.5. Other
- 5.3. Market Analysis, Insights and Forecast - by Region
- 5.3.1. North America
- 5.3.2. South America
- 5.3.3. Europe
- 5.3.4. Middle East & Africa
- 5.3.5. Asia Pacific
- 5.1. Market Analysis, Insights and Forecast - by Application
- 6. Global Pulse Characterization Instruments Analysis, Insights and Forecast, 2021-2033
- 6.1. Market Analysis, Insights and Forecast - by Application
- 6.1.1. Telecommunications
- 6.1.2. Scientific Research
- 6.1.3. Material Processing
- 6.1.4. Medical
- 6.1.5. Other
- 6.2. Market Analysis, Insights and Forecast - by Type
- 6.2.1. Measuring Instruments
- 6.2.2. Analysis Instruments
- 6.2.3. Emulation Instruments
- 6.2.4. Imaging Instruments
- 6.2.5. Other
- 6.1. Market Analysis, Insights and Forecast - by Application
- 7. North America Pulse Characterization Instruments Analysis, Insights and Forecast, 2020-2032
- 7.1. Market Analysis, Insights and Forecast - by Application
- 7.1.1. Telecommunications
- 7.1.2. Scientific Research
- 7.1.3. Material Processing
- 7.1.4. Medical
- 7.1.5. Other
- 7.2. Market Analysis, Insights and Forecast - by Type
- 7.2.1. Measuring Instruments
- 7.2.2. Analysis Instruments
- 7.2.3. Emulation Instruments
- 7.2.4. Imaging Instruments
- 7.2.5. Other
- 7.1. Market Analysis, Insights and Forecast - by Application
- 8. South America Pulse Characterization Instruments Analysis, Insights and Forecast, 2020-2032
- 8.1. Market Analysis, Insights and Forecast - by Application
- 8.1.1. Telecommunications
- 8.1.2. Scientific Research
- 8.1.3. Material Processing
- 8.1.4. Medical
- 8.1.5. Other
- 8.2. Market Analysis, Insights and Forecast - by Type
- 8.2.1. Measuring Instruments
- 8.2.2. Analysis Instruments
- 8.2.3. Emulation Instruments
- 8.2.4. Imaging Instruments
- 8.2.5. Other
- 8.1. Market Analysis, Insights and Forecast - by Application
- 9. Europe Pulse Characterization Instruments Analysis, Insights and Forecast, 2020-2032
- 9.1. Market Analysis, Insights and Forecast - by Application
- 9.1.1. Telecommunications
- 9.1.2. Scientific Research
- 9.1.3. Material Processing
- 9.1.4. Medical
- 9.1.5. Other
- 9.2. Market Analysis, Insights and Forecast - by Type
- 9.2.1. Measuring Instruments
- 9.2.2. Analysis Instruments
- 9.2.3. Emulation Instruments
- 9.2.4. Imaging Instruments
- 9.2.5. Other
- 9.1. Market Analysis, Insights and Forecast - by Application
- 10. Middle East & Africa Pulse Characterization Instruments Analysis, Insights and Forecast, 2020-2032
- 10.1. Market Analysis, Insights and Forecast - by Application
- 10.1.1. Telecommunications
- 10.1.2. Scientific Research
- 10.1.3. Material Processing
- 10.1.4. Medical
- 10.1.5. Other
- 10.2. Market Analysis, Insights and Forecast - by Type
- 10.2.1. Measuring Instruments
- 10.2.2. Analysis Instruments
- 10.2.3. Emulation Instruments
- 10.2.4. Imaging Instruments
- 10.2.5. Other
- 10.1. Market Analysis, Insights and Forecast - by Application
- 11. Asia Pacific Pulse Characterization Instruments Analysis, Insights and Forecast, 2020-2032
- 11.1. Market Analysis, Insights and Forecast - by Application
- 11.1.1. Telecommunications
- 11.1.2. Scientific Research
- 11.1.3. Material Processing
- 11.1.4. Medical
- 11.1.5. Other
- 11.2. Market Analysis, Insights and Forecast - by Type
- 11.2.1. Measuring Instruments
- 11.2.2. Analysis Instruments
- 11.2.3. Emulation Instruments
- 11.2.4. Imaging Instruments
- 11.2.5. Other
- 11.1. Market Analysis, Insights and Forecast - by Application
- 12. Competitive Analysis
- 12.1. Company Profiles
- 12.1.1 Fluence Sp. z o.o
- 12.1.1.1. Company Overview
- 12.1.1.2. Products
- 12.1.1.3. Company Financials
- 12.1.1.4. SWOT Analysis
- 12.1.2 APE GmbH
- 12.1.2.1. Company Overview
- 12.1.2.2. Products
- 12.1.2.3. Company Financials
- 12.1.2.4. SWOT Analysis
- 12.1.3 Femto Easy
- 12.1.3.1. Company Overview
- 12.1.3.2. Products
- 12.1.3.3. Company Financials
- 12.1.3.4. SWOT Analysis
- 12.1.4 Edmund Optics
- 12.1.4.1. Company Overview
- 12.1.4.2. Products
- 12.1.4.3. Company Financials
- 12.1.4.4. SWOT Analysis
- 12.1.5 Sphere Ultrafast Photonics SL
- 12.1.5.1. Company Overview
- 12.1.5.2. Products
- 12.1.5.3. Company Financials
- 12.1.5.4. SWOT Analysis
- 12.1.6 Fastlite
- 12.1.6.1. Company Overview
- 12.1.6.2. Products
- 12.1.6.3. Company Financials
- 12.1.6.4. SWOT Analysis
- 12.1.7 ALPHALAS GmbH
- 12.1.7.1. Company Overview
- 12.1.7.2. Products
- 12.1.7.3. Company Financials
- 12.1.7.4. SWOT Analysis
- 12.1.8 Laser Peak
- 12.1.8.1. Company Overview
- 12.1.8.2. Products
- 12.1.8.3. Company Financials
- 12.1.8.4. SWOT Analysis
- 12.1.9 Thorlabs
- 12.1.9.1. Company Overview
- 12.1.9.2. Products
- 12.1.9.3. Company Financials
- 12.1.9.4. SWOT Analysis
- 12.1.10 Avesta-Project
- 12.1.10.1. Company Overview
- 12.1.10.2. Products
- 12.1.10.3. Company Financials
- 12.1.10.4. SWOT Analysis
- 12.1.11 Quantifi Photonics
- 12.1.11.1. Company Overview
- 12.1.11.2. Products
- 12.1.11.3. Company Financials
- 12.1.11.4. SWOT Analysis
- 12.1.12 Del Mar Photonics Inc
- 12.1.12.1. Company Overview
- 12.1.12.2. Products
- 12.1.12.3. Company Financials
- 12.1.12.4. SWOT Analysis
- 12.1.13 Mesa Photonics LLC
- 12.1.13.1. Company Overview
- 12.1.13.2. Products
- 12.1.13.3. Company Financials
- 12.1.13.4. SWOT Analysis
- 12.1.14 Optoprim
- 12.1.14.1. Company Overview
- 12.1.14.2. Products
- 12.1.14.3. Company Financials
- 12.1.14.4. SWOT Analysis
- 12.1.1 Fluence Sp. z o.o
- 12.2. Market Entropy
- 12.2.1 Company's Key Areas Served
- 12.2.2 Recent Developments
- 12.3. Company Market Share Analysis 2025
- 12.3.1 Top 5 Companies Market Share Analysis
- 12.3.2 Top 3 Companies Market Share Analysis
- 12.4. List of Potential Customers
- 13. Research Methodology
List of Figures
- Figure 1: Global Pulse Characterization Instruments Revenue Breakdown (undefined, %) by Region 2025 & 2033
- Figure 2: Global Pulse Characterization Instruments Volume Breakdown (K, %) by Region 2025 & 2033
- Figure 3: North America Pulse Characterization Instruments Revenue (undefined), by Application 2025 & 2033
- Figure 4: North America Pulse Characterization Instruments Volume (K), by Application 2025 & 2033
- Figure 5: North America Pulse Characterization Instruments Revenue Share (%), by Application 2025 & 2033
- Figure 6: North America Pulse Characterization Instruments Volume Share (%), by Application 2025 & 2033
- Figure 7: North America Pulse Characterization Instruments Revenue (undefined), by Type 2025 & 2033
- Figure 8: North America Pulse Characterization Instruments Volume (K), by Type 2025 & 2033
- Figure 9: North America Pulse Characterization Instruments Revenue Share (%), by Type 2025 & 2033
- Figure 10: North America Pulse Characterization Instruments Volume Share (%), by Type 2025 & 2033
- Figure 11: North America Pulse Characterization Instruments Revenue (undefined), by Country 2025 & 2033
- Figure 12: North America Pulse Characterization Instruments Volume (K), by Country 2025 & 2033
- Figure 13: North America Pulse Characterization Instruments Revenue Share (%), by Country 2025 & 2033
- Figure 14: North America Pulse Characterization Instruments Volume Share (%), by Country 2025 & 2033
- Figure 15: South America Pulse Characterization Instruments Revenue (undefined), by Application 2025 & 2033
- Figure 16: South America Pulse Characterization Instruments Volume (K), by Application 2025 & 2033
- Figure 17: South America Pulse Characterization Instruments Revenue Share (%), by Application 2025 & 2033
- Figure 18: South America Pulse Characterization Instruments Volume Share (%), by Application 2025 & 2033
- Figure 19: South America Pulse Characterization Instruments Revenue (undefined), by Type 2025 & 2033
- Figure 20: South America Pulse Characterization Instruments Volume (K), by Type 2025 & 2033
- Figure 21: South America Pulse Characterization Instruments Revenue Share (%), by Type 2025 & 2033
- Figure 22: South America Pulse Characterization Instruments Volume Share (%), by Type 2025 & 2033
- Figure 23: South America Pulse Characterization Instruments Revenue (undefined), by Country 2025 & 2033
- Figure 24: South America Pulse Characterization Instruments Volume (K), by Country 2025 & 2033
- Figure 25: South America Pulse Characterization Instruments Revenue Share (%), by Country 2025 & 2033
- Figure 26: South America Pulse Characterization Instruments Volume Share (%), by Country 2025 & 2033
- Figure 27: Europe Pulse Characterization Instruments Revenue (undefined), by Application 2025 & 2033
- Figure 28: Europe Pulse Characterization Instruments Volume (K), by Application 2025 & 2033
- Figure 29: Europe Pulse Characterization Instruments Revenue Share (%), by Application 2025 & 2033
- Figure 30: Europe Pulse Characterization Instruments Volume Share (%), by Application 2025 & 2033
- Figure 31: Europe Pulse Characterization Instruments Revenue (undefined), by Type 2025 & 2033
- Figure 32: Europe Pulse Characterization Instruments Volume (K), by Type 2025 & 2033
- Figure 33: Europe Pulse Characterization Instruments Revenue Share (%), by Type 2025 & 2033
- Figure 34: Europe Pulse Characterization Instruments Volume Share (%), by Type 2025 & 2033
- Figure 35: Europe Pulse Characterization Instruments Revenue (undefined), by Country 2025 & 2033
- Figure 36: Europe Pulse Characterization Instruments Volume (K), by Country 2025 & 2033
- Figure 37: Europe Pulse Characterization Instruments Revenue Share (%), by Country 2025 & 2033
- Figure 38: Europe Pulse Characterization Instruments Volume Share (%), by Country 2025 & 2033
- Figure 39: Middle East & Africa Pulse Characterization Instruments Revenue (undefined), by Application 2025 & 2033
- Figure 40: Middle East & Africa Pulse Characterization Instruments Volume (K), by Application 2025 & 2033
- Figure 41: Middle East & Africa Pulse Characterization Instruments Revenue Share (%), by Application 2025 & 2033
- Figure 42: Middle East & Africa Pulse Characterization Instruments Volume Share (%), by Application 2025 & 2033
- Figure 43: Middle East & Africa Pulse Characterization Instruments Revenue (undefined), by Type 2025 & 2033
- Figure 44: Middle East & Africa Pulse Characterization Instruments Volume (K), by Type 2025 & 2033
- Figure 45: Middle East & Africa Pulse Characterization Instruments Revenue Share (%), by Type 2025 & 2033
- Figure 46: Middle East & Africa Pulse Characterization Instruments Volume Share (%), by Type 2025 & 2033
- Figure 47: Middle East & Africa Pulse Characterization Instruments Revenue (undefined), by Country 2025 & 2033
- Figure 48: Middle East & Africa Pulse Characterization Instruments Volume (K), by Country 2025 & 2033
- Figure 49: Middle East & Africa Pulse Characterization Instruments Revenue Share (%), by Country 2025 & 2033
- Figure 50: Middle East & Africa Pulse Characterization Instruments Volume Share (%), by Country 2025 & 2033
- Figure 51: Asia Pacific Pulse Characterization Instruments Revenue (undefined), by Application 2025 & 2033
- Figure 52: Asia Pacific Pulse Characterization Instruments Volume (K), by Application 2025 & 2033
- Figure 53: Asia Pacific Pulse Characterization Instruments Revenue Share (%), by Application 2025 & 2033
- Figure 54: Asia Pacific Pulse Characterization Instruments Volume Share (%), by Application 2025 & 2033
- Figure 55: Asia Pacific Pulse Characterization Instruments Revenue (undefined), by Type 2025 & 2033
- Figure 56: Asia Pacific Pulse Characterization Instruments Volume (K), by Type 2025 & 2033
- Figure 57: Asia Pacific Pulse Characterization Instruments Revenue Share (%), by Type 2025 & 2033
- Figure 58: Asia Pacific Pulse Characterization Instruments Volume Share (%), by Type 2025 & 2033
- Figure 59: Asia Pacific Pulse Characterization Instruments Revenue (undefined), by Country 2025 & 2033
- Figure 60: Asia Pacific Pulse Characterization Instruments Volume (K), by Country 2025 & 2033
- Figure 61: Asia Pacific Pulse Characterization Instruments Revenue Share (%), by Country 2025 & 2033
- Figure 62: Asia Pacific Pulse Characterization Instruments Volume Share (%), by Country 2025 & 2033
List of Tables
- Table 1: Global Pulse Characterization Instruments Revenue undefined Forecast, by Application 2020 & 2033
- Table 2: Global Pulse Characterization Instruments Volume K Forecast, by Application 2020 & 2033
- Table 3: Global Pulse Characterization Instruments Revenue undefined Forecast, by Type 2020 & 2033
- Table 4: Global Pulse Characterization Instruments Volume K Forecast, by Type 2020 & 2033
- Table 5: Global Pulse Characterization Instruments Revenue undefined Forecast, by Region 2020 & 2033
- Table 6: Global Pulse Characterization Instruments Volume K Forecast, by Region 2020 & 2033
- Table 7: Global Pulse Characterization Instruments Revenue undefined Forecast, by Application 2020 & 2033
- Table 8: Global Pulse Characterization Instruments Volume K Forecast, by Application 2020 & 2033
- Table 9: Global Pulse Characterization Instruments Revenue undefined Forecast, by Type 2020 & 2033
- Table 10: Global Pulse Characterization Instruments Volume K Forecast, by Type 2020 & 2033
- Table 11: Global Pulse Characterization Instruments Revenue undefined Forecast, by Country 2020 & 2033
- Table 12: Global Pulse Characterization Instruments Volume K Forecast, by Country 2020 & 2033
- Table 13: United States Pulse Characterization Instruments Revenue (undefined) Forecast, by Application 2020 & 2033
- Table 14: United States Pulse Characterization Instruments Volume (K) Forecast, by Application 2020 & 2033
- Table 15: Canada Pulse Characterization Instruments Revenue (undefined) Forecast, by Application 2020 & 2033
- Table 16: Canada Pulse Characterization Instruments Volume (K) Forecast, by Application 2020 & 2033
- Table 17: Mexico Pulse Characterization Instruments Revenue (undefined) Forecast, by Application 2020 & 2033
- Table 18: Mexico Pulse Characterization Instruments Volume (K) Forecast, by Application 2020 & 2033
- Table 19: Global Pulse Characterization Instruments Revenue undefined Forecast, by Application 2020 & 2033
- Table 20: Global Pulse Characterization Instruments Volume K Forecast, by Application 2020 & 2033
- Table 21: Global Pulse Characterization Instruments Revenue undefined Forecast, by Type 2020 & 2033
- Table 22: Global Pulse Characterization Instruments Volume K Forecast, by Type 2020 & 2033
- Table 23: Global Pulse Characterization Instruments Revenue undefined Forecast, by Country 2020 & 2033
- Table 24: Global Pulse Characterization Instruments Volume K Forecast, by Country 2020 & 2033
- Table 25: Brazil Pulse Characterization Instruments Revenue (undefined) Forecast, by Application 2020 & 2033
- Table 26: Brazil Pulse Characterization Instruments Volume (K) Forecast, by Application 2020 & 2033
- Table 27: Argentina Pulse Characterization Instruments Revenue (undefined) Forecast, by Application 2020 & 2033
- Table 28: Argentina Pulse Characterization Instruments Volume (K) Forecast, by Application 2020 & 2033
- Table 29: Rest of South America Pulse Characterization Instruments Revenue (undefined) Forecast, by Application 2020 & 2033
- Table 30: Rest of South America Pulse Characterization Instruments Volume (K) Forecast, by Application 2020 & 2033
- Table 31: Global Pulse Characterization Instruments Revenue undefined Forecast, by Application 2020 & 2033
- Table 32: Global Pulse Characterization Instruments Volume K Forecast, by Application 2020 & 2033
- Table 33: Global Pulse Characterization Instruments Revenue undefined Forecast, by Type 2020 & 2033
- Table 34: Global Pulse Characterization Instruments Volume K Forecast, by Type 2020 & 2033
- Table 35: Global Pulse Characterization Instruments Revenue undefined Forecast, by Country 2020 & 2033
- Table 36: Global Pulse Characterization Instruments Volume K Forecast, by Country 2020 & 2033
- Table 37: United Kingdom Pulse Characterization Instruments Revenue (undefined) Forecast, by Application 2020 & 2033
- Table 38: United Kingdom Pulse Characterization Instruments Volume (K) Forecast, by Application 2020 & 2033
- Table 39: Germany Pulse Characterization Instruments Revenue (undefined) Forecast, by Application 2020 & 2033
- Table 40: Germany Pulse Characterization Instruments Volume (K) Forecast, by Application 2020 & 2033
- Table 41: France Pulse Characterization Instruments Revenue (undefined) Forecast, by Application 2020 & 2033
- Table 42: France Pulse Characterization Instruments Volume (K) Forecast, by Application 2020 & 2033
- Table 43: Italy Pulse Characterization Instruments Revenue (undefined) Forecast, by Application 2020 & 2033
- Table 44: Italy Pulse Characterization Instruments Volume (K) Forecast, by Application 2020 & 2033
- Table 45: Spain Pulse Characterization Instruments Revenue (undefined) Forecast, by Application 2020 & 2033
- Table 46: Spain Pulse Characterization Instruments Volume (K) Forecast, by Application 2020 & 2033
- Table 47: Russia Pulse Characterization Instruments Revenue (undefined) Forecast, by Application 2020 & 2033
- Table 48: Russia Pulse Characterization Instruments Volume (K) Forecast, by Application 2020 & 2033
- Table 49: Benelux Pulse Characterization Instruments Revenue (undefined) Forecast, by Application 2020 & 2033
- Table 50: Benelux Pulse Characterization Instruments Volume (K) Forecast, by Application 2020 & 2033
- Table 51: Nordics Pulse Characterization Instruments Revenue (undefined) Forecast, by Application 2020 & 2033
- Table 52: Nordics Pulse Characterization Instruments Volume (K) Forecast, by Application 2020 & 2033
- Table 53: Rest of Europe Pulse Characterization Instruments Revenue (undefined) Forecast, by Application 2020 & 2033
- Table 54: Rest of Europe Pulse Characterization Instruments Volume (K) Forecast, by Application 2020 & 2033
- Table 55: Global Pulse Characterization Instruments Revenue undefined Forecast, by Application 2020 & 2033
- Table 56: Global Pulse Characterization Instruments Volume K Forecast, by Application 2020 & 2033
- Table 57: Global Pulse Characterization Instruments Revenue undefined Forecast, by Type 2020 & 2033
- Table 58: Global Pulse Characterization Instruments Volume K Forecast, by Type 2020 & 2033
- Table 59: Global Pulse Characterization Instruments Revenue undefined Forecast, by Country 2020 & 2033
- Table 60: Global Pulse Characterization Instruments Volume K Forecast, by Country 2020 & 2033
- Table 61: Turkey Pulse Characterization Instruments Revenue (undefined) Forecast, by Application 2020 & 2033
- Table 62: Turkey Pulse Characterization Instruments Volume (K) Forecast, by Application 2020 & 2033
- Table 63: Israel Pulse Characterization Instruments Revenue (undefined) Forecast, by Application 2020 & 2033
- Table 64: Israel Pulse Characterization Instruments Volume (K) Forecast, by Application 2020 & 2033
- Table 65: GCC Pulse Characterization Instruments Revenue (undefined) Forecast, by Application 2020 & 2033
- Table 66: GCC Pulse Characterization Instruments Volume (K) Forecast, by Application 2020 & 2033
- Table 67: North Africa Pulse Characterization Instruments Revenue (undefined) Forecast, by Application 2020 & 2033
- Table 68: North Africa Pulse Characterization Instruments Volume (K) Forecast, by Application 2020 & 2033
- Table 69: South Africa Pulse Characterization Instruments Revenue (undefined) Forecast, by Application 2020 & 2033
- Table 70: South Africa Pulse Characterization Instruments Volume (K) Forecast, by Application 2020 & 2033
- Table 71: Rest of Middle East & Africa Pulse Characterization Instruments Revenue (undefined) Forecast, by Application 2020 & 2033
- Table 72: Rest of Middle East & Africa Pulse Characterization Instruments Volume (K) Forecast, by Application 2020 & 2033
- Table 73: Global Pulse Characterization Instruments Revenue undefined Forecast, by Application 2020 & 2033
- Table 74: Global Pulse Characterization Instruments Volume K Forecast, by Application 2020 & 2033
- Table 75: Global Pulse Characterization Instruments Revenue undefined Forecast, by Type 2020 & 2033
- Table 76: Global Pulse Characterization Instruments Volume K Forecast, by Type 2020 & 2033
- Table 77: Global Pulse Characterization Instruments Revenue undefined Forecast, by Country 2020 & 2033
- Table 78: Global Pulse Characterization Instruments Volume K Forecast, by Country 2020 & 2033
- Table 79: China Pulse Characterization Instruments Revenue (undefined) Forecast, by Application 2020 & 2033
- Table 80: China Pulse Characterization Instruments Volume (K) Forecast, by Application 2020 & 2033
- Table 81: India Pulse Characterization Instruments Revenue (undefined) Forecast, by Application 2020 & 2033
- Table 82: India Pulse Characterization Instruments Volume (K) Forecast, by Application 2020 & 2033
- Table 83: Japan Pulse Characterization Instruments Revenue (undefined) Forecast, by Application 2020 & 2033
- Table 84: Japan Pulse Characterization Instruments Volume (K) Forecast, by Application 2020 & 2033
- Table 85: South Korea Pulse Characterization Instruments Revenue (undefined) Forecast, by Application 2020 & 2033
- Table 86: South Korea Pulse Characterization Instruments Volume (K) Forecast, by Application 2020 & 2033
- Table 87: ASEAN Pulse Characterization Instruments Revenue (undefined) Forecast, by Application 2020 & 2033
- Table 88: ASEAN Pulse Characterization Instruments Volume (K) Forecast, by Application 2020 & 2033
- Table 89: Oceania Pulse Characterization Instruments Revenue (undefined) Forecast, by Application 2020 & 2033
- Table 90: Oceania Pulse Characterization Instruments Volume (K) Forecast, by Application 2020 & 2033
- Table 91: Rest of Asia Pacific Pulse Characterization Instruments Revenue (undefined) Forecast, by Application 2020 & 2033
- Table 92: Rest of Asia Pacific Pulse Characterization Instruments Volume (K) Forecast, by Application 2020 & 2033
Frequently Asked Questions
1. What is the projected Compound Annual Growth Rate (CAGR) of the Pulse Characterization Instruments?
The projected CAGR is approximately 24.3%.
2. Which companies are prominent players in the Pulse Characterization Instruments?
Key companies in the market include Fluence Sp. z o.o, APE GmbH, Femto Easy, Edmund Optics, Sphere Ultrafast Photonics, SL, Fastlite, ALPHALAS GmbH, Laser Peak, Thorlabs, Avesta-Project, Quantifi Photonics, Del Mar Photonics, Inc, Mesa Photonics, LLC, Optoprim.
3. What are the main segments of the Pulse Characterization Instruments?
The market segments include Application, Type.
4. Can you provide details about the market size?
The market size is estimated to be USD XXX N/A as of 2022.
5. What are some drivers contributing to market growth?
N/A
6. What are the notable trends driving market growth?
N/A
7. Are there any restraints impacting market growth?
N/A
8. Can you provide examples of recent developments in the market?
N/A
9. What pricing options are available for accessing the report?
Pricing options include single-user, multi-user, and enterprise licenses priced at USD 3950.00, USD 5925.00, and USD 7900.00 respectively.
10. Is the market size provided in terms of value or volume?
The market size is provided in terms of value, measured in N/A and volume, measured in K.
11. Are there any specific market keywords associated with the report?
Yes, the market keyword associated with the report is "Pulse Characterization Instruments," which aids in identifying and referencing the specific market segment covered.
12. How do I determine which pricing option suits my needs best?
The pricing options vary based on user requirements and access needs. Individual users may opt for single-user licenses, while businesses requiring broader access may choose multi-user or enterprise licenses for cost-effective access to the report.
13. Are there any additional resources or data provided in the Pulse Characterization Instruments report?
While the report offers comprehensive insights, it's advisable to review the specific contents or supplementary materials provided to ascertain if additional resources or data are available.
14. How can I stay updated on further developments or reports in the Pulse Characterization Instruments?
To stay informed about further developments, trends, and reports in the Pulse Characterization Instruments, consider subscribing to industry newsletters, following relevant companies and organizations, or regularly checking reputable industry news sources and publications.
Methodology
Step 1 - Identification of Relevant Samples Size from Population Database


Step 2 - Approaches for Defining Global Market Size (Value, Volume* & Price*)

Note*: In applicable scenarios
Step 3 - Data Sources
Primary Research
- Web Analytics
- Survey Reports
- Research Institute
- Latest Research Reports
- Opinion Leaders
Secondary Research
- Annual Reports
- White Paper
- Latest Press Release
- Industry Association
- Paid Database
- Investor Presentations

Step 4 - Data Triangulation
Involves using different sources of information in order to increase the validity of a study
These sources are likely to be stakeholders in a program - participants, other researchers, program staff, other community members, and so on.
Then we put all data in single framework & apply various statistical tools to find out the dynamic on the market.
During the analysis stage, feedback from the stakeholder groups would be compared to determine areas of agreement as well as areas of divergence