

Key Insights
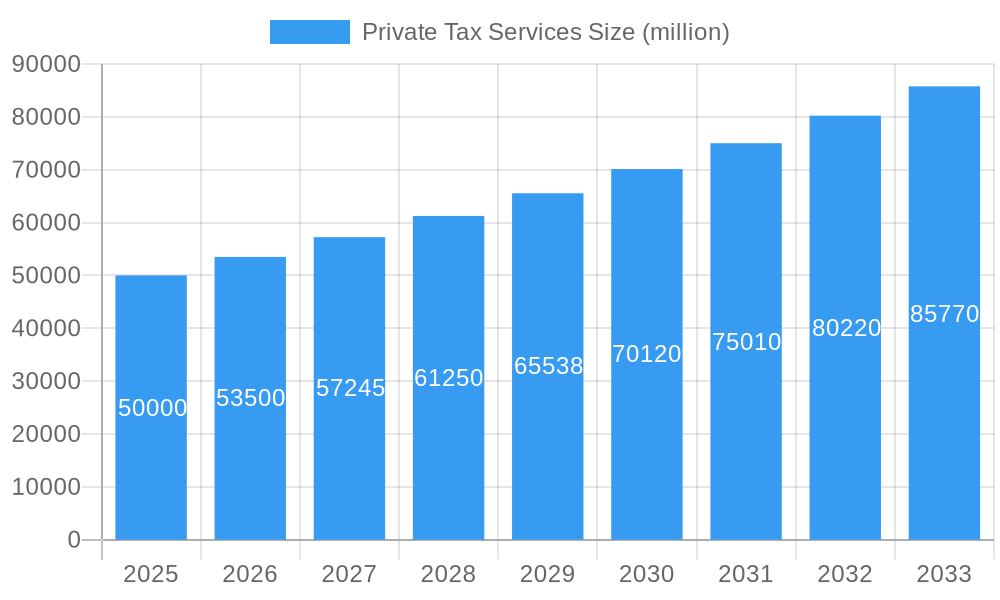
The global private tax services market is experiencing robust growth, driven by increasing complexities in tax regulations, rising wealth concentration, and a growing need for specialized tax advice among high-net-worth individuals and privately held businesses. The market, estimated at $50 billion in 2025, is projected to achieve a Compound Annual Growth Rate (CAGR) of 7% between 2025 and 2033, reaching approximately $85 billion by 2033. This growth is fueled by several key trends, including the increasing adoption of digital tax solutions, the rise of cross-border transactions requiring specialized expertise, and the expanding demand for proactive tax planning services to minimize tax liabilities. The market's segmentation reflects this diverse client base, with services ranging from personal income tax compliance to international tax planning, estate and gift tax strategies, and specialized services for family offices and privately held companies. Major players like EY, PwC, KPMG, Deloitte, and others are driving market consolidation through strategic acquisitions and technological investments.
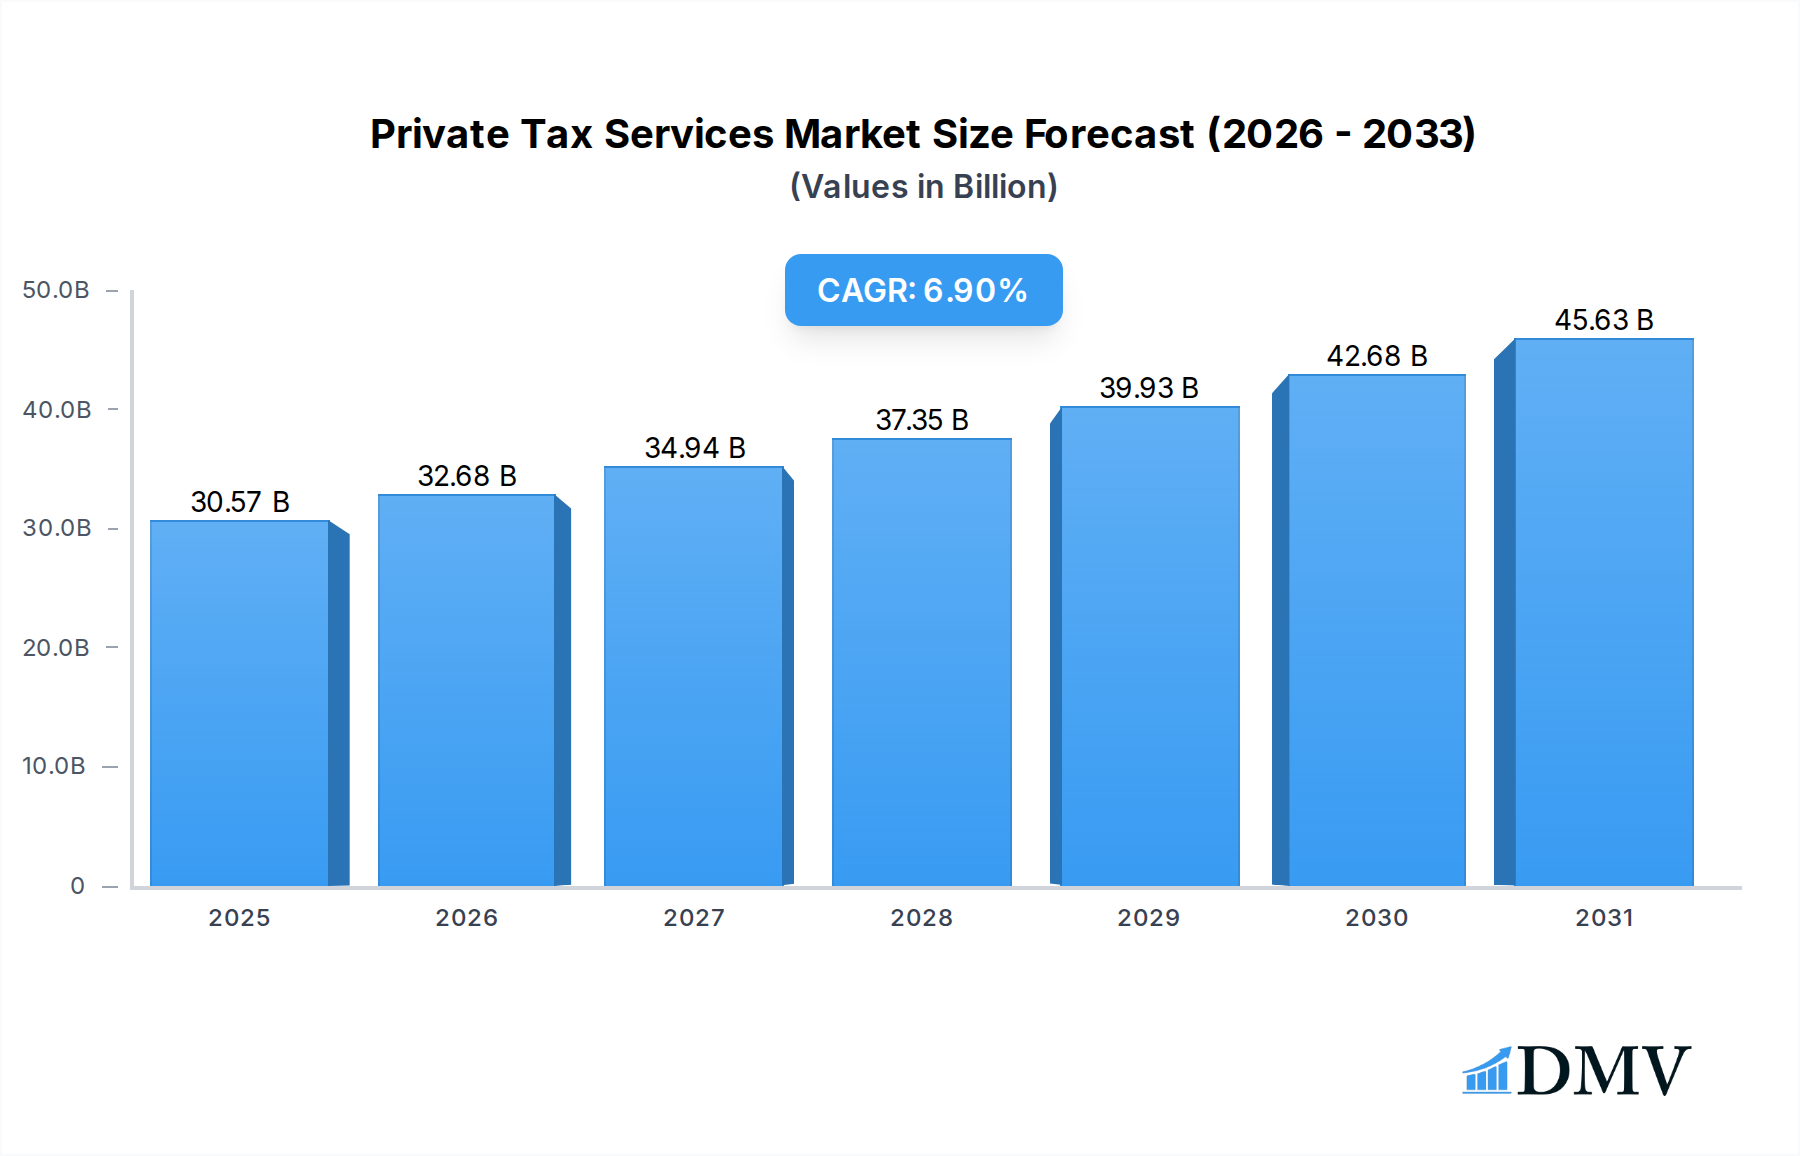
Private Tax Services Market Size (In Billion)
The market's growth is not without its challenges. Restraints include increasing competition from smaller, niche firms specializing in particular areas, evolving regulatory landscapes requiring continuous adaptation, and the ongoing need for skilled professionals, resulting in potential talent shortages within the industry. Despite these constraints, the long-term outlook for the private tax services market remains positive, underpinned by a consistently expanding client base seeking expert guidance to navigate the intricate world of global taxation. Regional variations in growth will likely be influenced by factors such as economic conditions, regulatory environments, and the concentration of wealth within specific geographic areas. North America and Europe are currently expected to dominate the market, but significant opportunities exist in emerging economies as wealth creation and business activity increase.
Private Tax Services Company Market Share
Private Tax Services Market: A Comprehensive Report (2019-2033)
This insightful report provides a detailed analysis of the global Private Tax Services market, projecting a multi-million dollar valuation by 2033. It offers a deep dive into market dynamics, competitive landscape, technological advancements, and future growth opportunities, empowering stakeholders to make informed strategic decisions. The study period covers 2019-2033, with 2025 serving as the base and estimated year. The forecast period spans 2025-2033, and the historical period encompasses 2019-2024.
Private Tax Services Market Composition & Trends
This section analyzes the market concentration, innovation drivers, regulatory environment, substitute products, end-user profiles, and mergers & acquisitions (M&A) activities within the Private Tax Services industry. The market is characterized by a significant concentration of players in the multi-million dollar space, with the top ten firms controlling approximately xx% of the market share in 2024.
Market Share Distribution (2024):
- EY: xx%
- PwC: xx%
- KPMG: xx%
- Deloitte: xx%
- Smith & Williamson: xx%
- Moss Adams LLP: xx%
- Tax Innovations: xx%
- Fitzroy Tax: xx%
- RSM US LLP: xx%
- MNP: xx%
- Others: xx%
M&A Activity (2019-2024): The period witnessed significant consolidation, with a total deal value exceeding $xx million. Key acquisitions included [Insert 2-3 significant M&A examples with brief descriptions and estimated values]. This trend is expected to continue, driven by the pursuit of economies of scale and expansion into new market segments.
The regulatory landscape plays a crucial role, with evolving tax laws and compliance requirements driving demand for specialized private tax services. Increased scrutiny of tax practices also fuels innovation in areas like tax technology and data analytics. Substitute products include in-house tax departments, but the complexity of tax regulations frequently favors specialized external firms. End-users primarily comprise high-net-worth individuals, family offices, and privately held companies.
Private Tax Services Industry Evolution
This section delves into the evolution of the Private Tax Services industry, examining growth trajectories, technological advancements, and shifting consumer demands over the study period (2019-2033). The market exhibited a Compound Annual Growth Rate (CAGR) of xx% during the historical period (2019-2024), fueled by increasing wealth concentration, stricter tax regulations, and the growing adoption of digital tax solutions.
Technological advancements, such as AI-powered tax software and blockchain technology for enhanced security and transparency, have significantly impacted the industry. Clients are increasingly demanding digital solutions, data-driven insights, and proactive tax planning, pushing providers to adapt and innovate. The forecast period (2025-2033) anticipates a CAGR of xx%, driven by factors including [mention 2-3 key drivers such as increased wealth, globalization, etc. and briefly explain each]. Adoption rates for advanced tax technologies are projected to reach xx% by 2033, a significant increase from the xx% recorded in 2024.
Leading Regions, Countries, or Segments in Private Tax Services
This section identifies the dominant regions, countries, and segments within the Private Tax Services market. The [Region, e.g., North America] region currently holds the largest market share, driven by factors such as:
- High Concentration of Wealth: A significant proportion of global high-net-worth individuals and family offices are located in this region.
- Robust Regulatory Framework: Developed regulatory environments provide a conducive climate for private tax services providers.
- Technological Advancement: This region is at the forefront of technology adoption in tax services.
[Provide similar bullet-point analysis for a second leading region/country]. The dominance of these regions is expected to continue through 2033, although emerging markets in [mention a region/country] are anticipated to show significant growth.
Private Tax Services Product Innovations
Recent innovations include the integration of artificial intelligence (AI) for automating tax processes, the use of machine learning (ML) for predictive tax planning, and the adoption of blockchain technology for secure data management. These advancements offer enhanced efficiency, improved accuracy, and reduced compliance risks, providing unique selling propositions for firms adopting these technologies. Performance metrics, such as reduced processing time and error rates, demonstrate a substantial ROI for both providers and clients.
Propelling Factors for Private Tax Services Growth
Several key factors propel the growth of the Private Tax Services market. Technological advancements, such as AI-driven tax software and data analytics platforms, automate processes, improve accuracy, and enhance efficiency. Economic factors, notably increasing wealth concentration and globalization, generate greater demand for specialized tax services. Furthermore, stringent tax regulations and increased government scrutiny encourage proactive tax planning and compliance, driving market expansion.
Obstacles in the Private Tax Services Market
The Private Tax Services market faces various obstacles. Evolving regulatory landscapes and compliance requirements present ongoing challenges, necessitating continuous adaptation and investment in expertise. Supply chain disruptions, such as talent shortages in specialized tax areas, can impact service delivery. Intense competition from established players and new entrants adds pressure on pricing and profitability, requiring firms to differentiate through innovation and superior client service. The quantifiable impact of these challenges is reflected in the xx% margin compression observed in 2024.
Future Opportunities in Private Tax Services
Emerging opportunities abound. Expansion into new geographic markets, particularly in rapidly developing economies, offers significant growth potential. Leveraging emerging technologies like blockchain for enhanced security and transparency can create a competitive advantage. Catering to the growing demand for personalized, data-driven tax planning and advisory services represents a key area for future growth.
Major Players in the Private Tax Services Ecosystem
- Deloitte
- PwC
- EY
- KPMG
- RSM International
- BDO
- Grant Thornton
- Ryan LLC
- Crowe
- CliftonLarsonAllen
- EisnerAmper
- CohnReznick
- Baker Tilly
- H&R Block
- AIG
- Others
Key Developments in Private Tax Services Industry
- 2023: Introduction of AI-powered tax compliance software by Deloitte.
- 2022: Merger between two leading firms resulting in a combined market share of xx%.
- 2021: Increased regulatory scrutiny of cross-border tax structures impacting service demands.
- 2020: Adoption of cloud-based tax platforms accelerated by the pandemic.
- 2019: Launch of a new tax planning software utilizing blockchain technology by EY.
Strategic Private Tax Services Market Forecast
The Private Tax Services market is poised for robust growth over the forecast period (2025-2033), driven by sustained demand for specialized tax expertise, technological advancements, and increasing regulatory complexity. The convergence of these factors creates significant opportunities for market expansion, exceeding a projected $xx million by 2033. Proactive adaptation to regulatory changes, continuous investment in technology, and a focus on client-centric service delivery will be critical success factors for firms in this dynamic market.
Private Tax Services Segmentation
- By Service Type
- Tax Planning Service
- Tax Compliance Service
- Tax Advisory Service
- Wealth Management Service
- Payroll Tax Service
- International & Cross-border Tax Service
- Others
- By Client Type
- High Net Worth Individuals (HNWIs)
- Ultra-High-Net-Worth Individuals (UHNWIs)
- Family Offices
- Others
- By Level of Expertise
- Basic Tax Advisory Services
- Advanced Tax Structuring
- By Delivery Model
- Offline
- Online/Digital
- Hybrid
Private Tax Services Segmentation By Geography
- 1. North America
- 1.1. United States
- 1.2. Canada
- 1.3. Mexico
- 2. South America
- 2.1. Brazil
- 2.2. Argentina
- 2.3. Rest of South America
- 3. Europe
- 3.1. United Kingdom
- 3.2. Germany
- 3.3. France
- 3.4. Italy
- 3.5. Spain
- 3.6. Russia
- 3.7. Benelux
- 3.8. Nordics
- 3.9. Rest of Europe
- 4. Middle East & Africa
- 4.1. Turkey
- 4.2. Israel
- 4.3. GCC
- 4.4. North Africa
- 4.5. South Africa
- 4.6. Rest of Middle East & Africa
- 5. Asia Pacific
- 5.1. China
- 5.2. India
- 5.3. Japan
- 5.4. South Korea
- 5.5. ASEAN
- 5.6. Oceania
- 5.7. Rest of Asia Pacific

Private Tax Services Regional Market Share
Geographic Coverage of Private Tax Services
Private Tax Services REPORT HIGHLIGHTS
| Aspects | Details |
|---|---|
| Study Period | 2020-2034 |
| Base Year | 2025 |
| Estimated Year | 2026 |
| Forecast Period | 2026-2034 |
| Historical Period | 2020-2025 |
| Growth Rate | CAGR of 6.9% from 2020-2034 |
| Segmentation |
|
Table of Contents
- 1. Introduction
- 1.1. Research Scope
- 1.2. Market Segmentation
- 1.3. Research Objective
- 1.4. Definitions and Assumptions
- 2. Executive Summary
- 2.1. Market Snapshot
- 3. Market Dynamics
- 3.1. Market Drivers
- 3.2. Market Restrains
- 3.3. Market Trends
- 3.4. Market Opportunities
- 4. Market Factor Analysis
- 4.1. Porters Five Forces
- 4.1.1. Bargaining Power of Suppliers
- 4.1.2. Bargaining Power of Buyers
- 4.1.3. Threat of New Entrants
- 4.1.4. Threat of Substitutes
- 4.1.5. Competitive Rivalry
- 4.2. PESTEL analysis
- 4.3. BCG Analysis
- 4.3.1. Stars (High Growth, High Market Share)
- 4.3.2. Cash Cows (Low Growth, High Market Share)
- 4.3.3. Question Mark (High Growth, Low Market Share)
- 4.3.4. Dogs (Low Growth, Low Market Share)
- 4.4. Ansoff Matrix Analysis
- 4.5. Supply Chain Analysis
- 4.6. Regulatory Landscape
- 4.7. Current Market Potential and Opportunity Assessment (TAM–SAM–SOM Framework)
- 4.8. DMV Analyst Note
- 4.1. Porters Five Forces
- 5. Market Analysis, Insights and Forecast 2021-2033
- 5.1. Market Analysis, Insights and Forecast - by Service Type
- 5.1.1. Tax Planning Service
- 5.1.2. Tax Compliance Service
- 5.1.3. Tax Advisory Service
- 5.1.4. Wealth Management Service
- 5.1.5. Payroll Tax Service
- 5.1.6. International & Cross-border Tax Service
- 5.1.7. Others
- 5.2. Market Analysis, Insights and Forecast - by Client Type
- 5.2.1. High Net Worth Individuals (HNWIs)
- 5.2.2. Ultra-High-Net-Worth Individuals (UHNWIs)
- 5.2.3. Family Offices
- 5.2.4. Others
- 5.3. Market Analysis, Insights and Forecast - by Level of Expertise
- 5.3.1. Basic Tax Advisory Services
- 5.3.2. Advanced Tax Structuring
- 5.4. Market Analysis, Insights and Forecast - by Delivery Model
- 5.4.1. Offline
- 5.4.2. Online/Digital
- 5.4.3. Hybrid
- 5.5. Market Analysis, Insights and Forecast - by Region
- 5.5.1. North America
- 5.5.2. South America
- 5.5.3. Europe
- 5.5.4. Middle East & Africa
- 5.5.5. Asia Pacific
- 5.1. Market Analysis, Insights and Forecast - by Service Type
- 6. Global Private Tax Services Analysis, Insights and Forecast, 2021-2033
- 6.1. Market Analysis, Insights and Forecast - by Service Type
- 6.1.1. Tax Planning Service
- 6.1.2. Tax Compliance Service
- 6.1.3. Tax Advisory Service
- 6.1.4. Wealth Management Service
- 6.1.5. Payroll Tax Service
- 6.1.6. International & Cross-border Tax Service
- 6.1.7. Others
- 6.2. Market Analysis, Insights and Forecast - by Client Type
- 6.2.1. High Net Worth Individuals (HNWIs)
- 6.2.2. Ultra-High-Net-Worth Individuals (UHNWIs)
- 6.2.3. Family Offices
- 6.2.4. Others
- 6.3. Market Analysis, Insights and Forecast - by Level of Expertise
- 6.3.1. Basic Tax Advisory Services
- 6.3.2. Advanced Tax Structuring
- 6.4. Market Analysis, Insights and Forecast - by Delivery Model
- 6.4.1. Offline
- 6.4.2. Online/Digital
- 6.4.3. Hybrid
- 6.1. Market Analysis, Insights and Forecast - by Service Type
- 7. North America Private Tax Services Analysis, Insights and Forecast, 2020-2032
- 7.1. Market Analysis, Insights and Forecast - by Service Type
- 7.1.1. Tax Planning Service
- 7.1.2. Tax Compliance Service
- 7.1.3. Tax Advisory Service
- 7.1.4. Wealth Management Service
- 7.1.5. Payroll Tax Service
- 7.1.6. International & Cross-border Tax Service
- 7.1.7. Others
- 7.2. Market Analysis, Insights and Forecast - by Client Type
- 7.2.1. High Net Worth Individuals (HNWIs)
- 7.2.2. Ultra-High-Net-Worth Individuals (UHNWIs)
- 7.2.3. Family Offices
- 7.2.4. Others
- 7.3. Market Analysis, Insights and Forecast - by Level of Expertise
- 7.3.1. Basic Tax Advisory Services
- 7.3.2. Advanced Tax Structuring
- 7.4. Market Analysis, Insights and Forecast - by Delivery Model
- 7.4.1. Offline
- 7.4.2. Online/Digital
- 7.4.3. Hybrid
- 7.1. Market Analysis, Insights and Forecast - by Service Type
- 8. South America Private Tax Services Analysis, Insights and Forecast, 2020-2032
- 8.1. Market Analysis, Insights and Forecast - by Service Type
- 8.1.1. Tax Planning Service
- 8.1.2. Tax Compliance Service
- 8.1.3. Tax Advisory Service
- 8.1.4. Wealth Management Service
- 8.1.5. Payroll Tax Service
- 8.1.6. International & Cross-border Tax Service
- 8.1.7. Others
- 8.2. Market Analysis, Insights and Forecast - by Client Type
- 8.2.1. High Net Worth Individuals (HNWIs)
- 8.2.2. Ultra-High-Net-Worth Individuals (UHNWIs)
- 8.2.3. Family Offices
- 8.2.4. Others
- 8.3. Market Analysis, Insights and Forecast - by Level of Expertise
- 8.3.1. Basic Tax Advisory Services
- 8.3.2. Advanced Tax Structuring
- 8.4. Market Analysis, Insights and Forecast - by Delivery Model
- 8.4.1. Offline
- 8.4.2. Online/Digital
- 8.4.3. Hybrid
- 8.1. Market Analysis, Insights and Forecast - by Service Type
- 9. Europe Private Tax Services Analysis, Insights and Forecast, 2020-2032
- 9.1. Market Analysis, Insights and Forecast - by Service Type
- 9.1.1. Tax Planning Service
- 9.1.2. Tax Compliance Service
- 9.1.3. Tax Advisory Service
- 9.1.4. Wealth Management Service
- 9.1.5. Payroll Tax Service
- 9.1.6. International & Cross-border Tax Service
- 9.1.7. Others
- 9.2. Market Analysis, Insights and Forecast - by Client Type
- 9.2.1. High Net Worth Individuals (HNWIs)
- 9.2.2. Ultra-High-Net-Worth Individuals (UHNWIs)
- 9.2.3. Family Offices
- 9.2.4. Others
- 9.3. Market Analysis, Insights and Forecast - by Level of Expertise
- 9.3.1. Basic Tax Advisory Services
- 9.3.2. Advanced Tax Structuring
- 9.4. Market Analysis, Insights and Forecast - by Delivery Model
- 9.4.1. Offline
- 9.4.2. Online/Digital
- 9.4.3. Hybrid
- 9.1. Market Analysis, Insights and Forecast - by Service Type
- 10. Middle East & Africa Private Tax Services Analysis, Insights and Forecast, 2020-2032
- 10.1. Market Analysis, Insights and Forecast - by Service Type
- 10.1.1. Tax Planning Service
- 10.1.2. Tax Compliance Service
- 10.1.3. Tax Advisory Service
- 10.1.4. Wealth Management Service
- 10.1.5. Payroll Tax Service
- 10.1.6. International & Cross-border Tax Service
- 10.1.7. Others
- 10.2. Market Analysis, Insights and Forecast - by Client Type
- 10.2.1. High Net Worth Individuals (HNWIs)
- 10.2.2. Ultra-High-Net-Worth Individuals (UHNWIs)
- 10.2.3. Family Offices
- 10.2.4. Others
- 10.3. Market Analysis, Insights and Forecast - by Level of Expertise
- 10.3.1. Basic Tax Advisory Services
- 10.3.2. Advanced Tax Structuring
- 10.4. Market Analysis, Insights and Forecast - by Delivery Model
- 10.4.1. Offline
- 10.4.2. Online/Digital
- 10.4.3. Hybrid
- 10.1. Market Analysis, Insights and Forecast - by Service Type
- 11. Asia Pacific Private Tax Services Analysis, Insights and Forecast, 2020-2032
- 11.1. Market Analysis, Insights and Forecast - by Service Type
- 11.1.1. Tax Planning Service
- 11.1.2. Tax Compliance Service
- 11.1.3. Tax Advisory Service
- 11.1.4. Wealth Management Service
- 11.1.5. Payroll Tax Service
- 11.1.6. International & Cross-border Tax Service
- 11.1.7. Others
- 11.2. Market Analysis, Insights and Forecast - by Client Type
- 11.2.1. High Net Worth Individuals (HNWIs)
- 11.2.2. Ultra-High-Net-Worth Individuals (UHNWIs)
- 11.2.3. Family Offices
- 11.2.4. Others
- 11.3. Market Analysis, Insights and Forecast - by Level of Expertise
- 11.3.1. Basic Tax Advisory Services
- 11.3.2. Advanced Tax Structuring
- 11.4. Market Analysis, Insights and Forecast - by Delivery Model
- 11.4.1. Offline
- 11.4.2. Online/Digital
- 11.4.3. Hybrid
- 11.1. Market Analysis, Insights and Forecast - by Service Type
- 12. Competitive Analysis
- 12.1. Company Profiles
- 12.1.1 Deloitte
- 12.1.1.1. Company Overview
- 12.1.1.2. Products
- 12.1.1.3. Company Financials
- 12.1.1.4. SWOT Analysis
- 12.1.2 PwC
- 12.1.2.1. Company Overview
- 12.1.2.2. Products
- 12.1.2.3. Company Financials
- 12.1.2.4. SWOT Analysis
- 12.1.3 EY
- 12.1.3.1. Company Overview
- 12.1.3.2. Products
- 12.1.3.3. Company Financials
- 12.1.3.4. SWOT Analysis
- 12.1.4 KPMG
- 12.1.4.1. Company Overview
- 12.1.4.2. Products
- 12.1.4.3. Company Financials
- 12.1.4.4. SWOT Analysis
- 12.1.5 RSM International
- 12.1.5.1. Company Overview
- 12.1.5.2. Products
- 12.1.5.3. Company Financials
- 12.1.5.4. SWOT Analysis
- 12.1.6 BDO
- 12.1.6.1. Company Overview
- 12.1.6.2. Products
- 12.1.6.3. Company Financials
- 12.1.6.4. SWOT Analysis
- 12.1.7 Grant Thornton
- 12.1.7.1. Company Overview
- 12.1.7.2. Products
- 12.1.7.3. Company Financials
- 12.1.7.4. SWOT Analysis
- 12.1.8 Ryan LLC
- 12.1.8.1. Company Overview
- 12.1.8.2. Products
- 12.1.8.3. Company Financials
- 12.1.8.4. SWOT Analysis
- 12.1.9 Crowe
- 12.1.9.1. Company Overview
- 12.1.9.2. Products
- 12.1.9.3. Company Financials
- 12.1.9.4. SWOT Analysis
- 12.1.10 CliftonLarsonAllen
- 12.1.10.1. Company Overview
- 12.1.10.2. Products
- 12.1.10.3. Company Financials
- 12.1.10.4. SWOT Analysis
- 12.1.11 EisnerAmper
- 12.1.11.1. Company Overview
- 12.1.11.2. Products
- 12.1.11.3. Company Financials
- 12.1.11.4. SWOT Analysis
- 12.1.12 CohnReznick
- 12.1.12.1. Company Overview
- 12.1.12.2. Products
- 12.1.12.3. Company Financials
- 12.1.12.4. SWOT Analysis
- 12.1.13 Baker Tilly
- 12.1.13.1. Company Overview
- 12.1.13.2. Products
- 12.1.13.3. Company Financials
- 12.1.13.4. SWOT Analysis
- 12.1.14 H&R Block
- 12.1.14.1. Company Overview
- 12.1.14.2. Products
- 12.1.14.3. Company Financials
- 12.1.14.4. SWOT Analysis
- 12.1.15 AIG
- 12.1.15.1. Company Overview
- 12.1.15.2. Products
- 12.1.15.3. Company Financials
- 12.1.15.4. SWOT Analysis
- 12.1.16 Others
- 12.1.16.1. Company Overview
- 12.1.16.2. Products
- 12.1.16.3. Company Financials
- 12.1.16.4. SWOT Analysis
- 12.1.1 Deloitte
- 12.2. Market Entropy
- 12.2.1 Company's Key Areas Served
- 12.2.2 Recent Developments
- 12.3. Company Market Share Analysis 2025
- 12.3.1 Top 5 Companies Market Share Analysis
- 12.3.2 Top 3 Companies Market Share Analysis
- 12.4. List of Potential Customers
- 13. Research Methodology
List of Figures
- Figure 1: Global Private Tax Services Revenue Breakdown (billion, %) by Region 2025 & 2033
- Figure 2: North America Private Tax Services Revenue (billion), by Service Type 2025 & 2033
- Figure 3: North America Private Tax Services Revenue Share (%), by Service Type 2025 & 2033
- Figure 4: North America Private Tax Services Revenue (billion), by Client Type 2025 & 2033
- Figure 5: North America Private Tax Services Revenue Share (%), by Client Type 2025 & 2033
- Figure 6: North America Private Tax Services Revenue (billion), by Level of Expertise 2025 & 2033
- Figure 7: North America Private Tax Services Revenue Share (%), by Level of Expertise 2025 & 2033
- Figure 8: North America Private Tax Services Revenue (billion), by Delivery Model 2025 & 2033
- Figure 9: North America Private Tax Services Revenue Share (%), by Delivery Model 2025 & 2033
- Figure 10: North America Private Tax Services Revenue (billion), by Country 2025 & 2033
- Figure 11: North America Private Tax Services Revenue Share (%), by Country 2025 & 2033
- Figure 12: South America Private Tax Services Revenue (billion), by Service Type 2025 & 2033
- Figure 13: South America Private Tax Services Revenue Share (%), by Service Type 2025 & 2033
- Figure 14: South America Private Tax Services Revenue (billion), by Client Type 2025 & 2033
- Figure 15: South America Private Tax Services Revenue Share (%), by Client Type 2025 & 2033
- Figure 16: South America Private Tax Services Revenue (billion), by Level of Expertise 2025 & 2033
- Figure 17: South America Private Tax Services Revenue Share (%), by Level of Expertise 2025 & 2033
- Figure 18: South America Private Tax Services Revenue (billion), by Delivery Model 2025 & 2033
- Figure 19: South America Private Tax Services Revenue Share (%), by Delivery Model 2025 & 2033
- Figure 20: South America Private Tax Services Revenue (billion), by Country 2025 & 2033
- Figure 21: South America Private Tax Services Revenue Share (%), by Country 2025 & 2033
- Figure 22: Europe Private Tax Services Revenue (billion), by Service Type 2025 & 2033
- Figure 23: Europe Private Tax Services Revenue Share (%), by Service Type 2025 & 2033
- Figure 24: Europe Private Tax Services Revenue (billion), by Client Type 2025 & 2033
- Figure 25: Europe Private Tax Services Revenue Share (%), by Client Type 2025 & 2033
- Figure 26: Europe Private Tax Services Revenue (billion), by Level of Expertise 2025 & 2033
- Figure 27: Europe Private Tax Services Revenue Share (%), by Level of Expertise 2025 & 2033
- Figure 28: Europe Private Tax Services Revenue (billion), by Delivery Model 2025 & 2033
- Figure 29: Europe Private Tax Services Revenue Share (%), by Delivery Model 2025 & 2033
- Figure 30: Europe Private Tax Services Revenue (billion), by Country 2025 & 2033
- Figure 31: Europe Private Tax Services Revenue Share (%), by Country 2025 & 2033
- Figure 32: Middle East & Africa Private Tax Services Revenue (billion), by Service Type 2025 & 2033
- Figure 33: Middle East & Africa Private Tax Services Revenue Share (%), by Service Type 2025 & 2033
- Figure 34: Middle East & Africa Private Tax Services Revenue (billion), by Client Type 2025 & 2033
- Figure 35: Middle East & Africa Private Tax Services Revenue Share (%), by Client Type 2025 & 2033
- Figure 36: Middle East & Africa Private Tax Services Revenue (billion), by Level of Expertise 2025 & 2033
- Figure 37: Middle East & Africa Private Tax Services Revenue Share (%), by Level of Expertise 2025 & 2033
- Figure 38: Middle East & Africa Private Tax Services Revenue (billion), by Delivery Model 2025 & 2033
- Figure 39: Middle East & Africa Private Tax Services Revenue Share (%), by Delivery Model 2025 & 2033
- Figure 40: Middle East & Africa Private Tax Services Revenue (billion), by Country 2025 & 2033
- Figure 41: Middle East & Africa Private Tax Services Revenue Share (%), by Country 2025 & 2033
- Figure 42: Asia Pacific Private Tax Services Revenue (billion), by Service Type 2025 & 2033
- Figure 43: Asia Pacific Private Tax Services Revenue Share (%), by Service Type 2025 & 2033
- Figure 44: Asia Pacific Private Tax Services Revenue (billion), by Client Type 2025 & 2033
- Figure 45: Asia Pacific Private Tax Services Revenue Share (%), by Client Type 2025 & 2033
- Figure 46: Asia Pacific Private Tax Services Revenue (billion), by Level of Expertise 2025 & 2033
- Figure 47: Asia Pacific Private Tax Services Revenue Share (%), by Level of Expertise 2025 & 2033
- Figure 48: Asia Pacific Private Tax Services Revenue (billion), by Delivery Model 2025 & 2033
- Figure 49: Asia Pacific Private Tax Services Revenue Share (%), by Delivery Model 2025 & 2033
- Figure 50: Asia Pacific Private Tax Services Revenue (billion), by Country 2025 & 2033
- Figure 51: Asia Pacific Private Tax Services Revenue Share (%), by Country 2025 & 2033
List of Tables
- Table 1: Global Private Tax Services Revenue billion Forecast, by Service Type 2020 & 2033
- Table 2: Global Private Tax Services Revenue billion Forecast, by Client Type 2020 & 2033
- Table 3: Global Private Tax Services Revenue billion Forecast, by Level of Expertise 2020 & 2033
- Table 4: Global Private Tax Services Revenue billion Forecast, by Delivery Model 2020 & 2033
- Table 5: Global Private Tax Services Revenue billion Forecast, by Region 2020 & 2033
- Table 6: Global Private Tax Services Revenue billion Forecast, by Service Type 2020 & 2033
- Table 7: Global Private Tax Services Revenue billion Forecast, by Client Type 2020 & 2033
- Table 8: Global Private Tax Services Revenue billion Forecast, by Level of Expertise 2020 & 2033
- Table 9: Global Private Tax Services Revenue billion Forecast, by Delivery Model 2020 & 2033
- Table 10: Global Private Tax Services Revenue billion Forecast, by Country 2020 & 2033
- Table 11: United States Private Tax Services Revenue (billion) Forecast, by Application 2020 & 2033
- Table 12: Canada Private Tax Services Revenue (billion) Forecast, by Application 2020 & 2033
- Table 13: Mexico Private Tax Services Revenue (billion) Forecast, by Application 2020 & 2033
- Table 14: Global Private Tax Services Revenue billion Forecast, by Service Type 2020 & 2033
- Table 15: Global Private Tax Services Revenue billion Forecast, by Client Type 2020 & 2033
- Table 16: Global Private Tax Services Revenue billion Forecast, by Level of Expertise 2020 & 2033
- Table 17: Global Private Tax Services Revenue billion Forecast, by Delivery Model 2020 & 2033
- Table 18: Global Private Tax Services Revenue billion Forecast, by Country 2020 & 2033
- Table 19: Brazil Private Tax Services Revenue (billion) Forecast, by Application 2020 & 2033
- Table 20: Argentina Private Tax Services Revenue (billion) Forecast, by Application 2020 & 2033
- Table 21: Rest of South America Private Tax Services Revenue (billion) Forecast, by Application 2020 & 2033
- Table 22: Global Private Tax Services Revenue billion Forecast, by Service Type 2020 & 2033
- Table 23: Global Private Tax Services Revenue billion Forecast, by Client Type 2020 & 2033
- Table 24: Global Private Tax Services Revenue billion Forecast, by Level of Expertise 2020 & 2033
- Table 25: Global Private Tax Services Revenue billion Forecast, by Delivery Model 2020 & 2033
- Table 26: Global Private Tax Services Revenue billion Forecast, by Country 2020 & 2033
- Table 27: United Kingdom Private Tax Services Revenue (billion) Forecast, by Application 2020 & 2033
- Table 28: Germany Private Tax Services Revenue (billion) Forecast, by Application 2020 & 2033
- Table 29: France Private Tax Services Revenue (billion) Forecast, by Application 2020 & 2033
- Table 30: Italy Private Tax Services Revenue (billion) Forecast, by Application 2020 & 2033
- Table 31: Spain Private Tax Services Revenue (billion) Forecast, by Application 2020 & 2033
- Table 32: Russia Private Tax Services Revenue (billion) Forecast, by Application 2020 & 2033
- Table 33: Benelux Private Tax Services Revenue (billion) Forecast, by Application 2020 & 2033
- Table 34: Nordics Private Tax Services Revenue (billion) Forecast, by Application 2020 & 2033
- Table 35: Rest of Europe Private Tax Services Revenue (billion) Forecast, by Application 2020 & 2033
- Table 36: Global Private Tax Services Revenue billion Forecast, by Service Type 2020 & 2033
- Table 37: Global Private Tax Services Revenue billion Forecast, by Client Type 2020 & 2033
- Table 38: Global Private Tax Services Revenue billion Forecast, by Level of Expertise 2020 & 2033
- Table 39: Global Private Tax Services Revenue billion Forecast, by Delivery Model 2020 & 2033
- Table 40: Global Private Tax Services Revenue billion Forecast, by Country 2020 & 2033
- Table 41: Turkey Private Tax Services Revenue (billion) Forecast, by Application 2020 & 2033
- Table 42: Israel Private Tax Services Revenue (billion) Forecast, by Application 2020 & 2033
- Table 43: GCC Private Tax Services Revenue (billion) Forecast, by Application 2020 & 2033
- Table 44: North Africa Private Tax Services Revenue (billion) Forecast, by Application 2020 & 2033
- Table 45: South Africa Private Tax Services Revenue (billion) Forecast, by Application 2020 & 2033
- Table 46: Rest of Middle East & Africa Private Tax Services Revenue (billion) Forecast, by Application 2020 & 2033
- Table 47: Global Private Tax Services Revenue billion Forecast, by Service Type 2020 & 2033
- Table 48: Global Private Tax Services Revenue billion Forecast, by Client Type 2020 & 2033
- Table 49: Global Private Tax Services Revenue billion Forecast, by Level of Expertise 2020 & 2033
- Table 50: Global Private Tax Services Revenue billion Forecast, by Delivery Model 2020 & 2033
- Table 51: Global Private Tax Services Revenue billion Forecast, by Country 2020 & 2033
- Table 52: China Private Tax Services Revenue (billion) Forecast, by Application 2020 & 2033
- Table 53: India Private Tax Services Revenue (billion) Forecast, by Application 2020 & 2033
- Table 54: Japan Private Tax Services Revenue (billion) Forecast, by Application 2020 & 2033
- Table 55: South Korea Private Tax Services Revenue (billion) Forecast, by Application 2020 & 2033
- Table 56: ASEAN Private Tax Services Revenue (billion) Forecast, by Application 2020 & 2033
- Table 57: Oceania Private Tax Services Revenue (billion) Forecast, by Application 2020 & 2033
- Table 58: Rest of Asia Pacific Private Tax Services Revenue (billion) Forecast, by Application 2020 & 2033
Frequently Asked Questions
1. What is the projected Compound Annual Growth Rate (CAGR) of the Private Tax Services?
The projected CAGR is approximately 6.9%.
2. Which companies are prominent players in the Private Tax Services?
Key companies in the market include Deloitte, PwC, EY, KPMG, RSM International, BDO, Grant Thornton, Ryan LLC, Crowe, CliftonLarsonAllen, EisnerAmper, CohnReznick, Baker Tilly, H&R Block, AIG, Others.
3. What are the main segments of the Private Tax Services?
The market segments include Service Type, Client Type, Level of Expertise, Delivery Model.
4. Can you provide details about the market size?
The market size is estimated to be USD 28.6 billion as of 2022.
5. What are some drivers contributing to market growth?
N/A
6. What are the notable trends driving market growth?
N/A
7. Are there any restraints impacting market growth?
N/A
8. Can you provide examples of recent developments in the market?
N/A
9. What pricing options are available for accessing the report?
Pricing options include single-user, multi-user, and enterprise licenses priced at USD 4900.00, USD 7350.00, and USD 9800.00 respectively.
10. Is the market size provided in terms of value or volume?
The market size is provided in terms of value, measured in billion.
11. Are there any specific market keywords associated with the report?
Yes, the market keyword associated with the report is "Private Tax Services," which aids in identifying and referencing the specific market segment covered.
12. How do I determine which pricing option suits my needs best?
The pricing options vary based on user requirements and access needs. Individual users may opt for single-user licenses, while businesses requiring broader access may choose multi-user or enterprise licenses for cost-effective access to the report.
13. Are there any additional resources or data provided in the Private Tax Services report?
While the report offers comprehensive insights, it's advisable to review the specific contents or supplementary materials provided to ascertain if additional resources or data are available.
14. How can I stay updated on further developments or reports in the Private Tax Services?
To stay informed about further developments, trends, and reports in the Private Tax Services, consider subscribing to industry newsletters, following relevant companies and organizations, or regularly checking reputable industry news sources and publications.
Methodology
Step 1 - Identification of Relevant Samples Size from Population Database


Step 2 - Approaches for Defining Global Market Size (Value, Volume* & Price*)

Note*: In applicable scenarios
Step 3 - Data Sources
Primary Research
- Web Analytics
- Survey Reports
- Research Institute
- Latest Research Reports
- Opinion Leaders
Secondary Research
- Annual Reports
- White Paper
- Latest Press Release
- Industry Association
- Paid Database
- Investor Presentations

Step 4 - Data Triangulation
Involves using different sources of information in order to increase the validity of a study
These sources are likely to be stakeholders in a program - participants, other researchers, program staff, other community members, and so on.
Then we put all data in single framework & apply various statistical tools to find out the dynamic on the market.
During the analysis stage, feedback from the stakeholder groups would be compared to determine areas of agreement as well as areas of divergence