

Key Insights
The global Power Management Unit (PMU) market is poised for substantial growth, projected to reach $23.47 billion in 2025, expanding at a robust Compound Annual Growth Rate (CAGR) of 9.6% through 2033. This surge is primarily driven by the escalating demand for advanced power solutions across consumer electronics, automotive, and industrial sectors. The ubiquitous presence of smartphones and the increasing complexity of their power requirements, coupled with the burgeoning PC and smart TV markets, are significant catalysts. Furthermore, the growing adoption of IoT devices and the continuous innovation in semiconductor technology, leading to more efficient and compact PMUs, are fueling market expansion. The market is segmented by application, with Mobile Phones dominating, followed by Computers and Televisions, and a nascent but growing 'Others' segment encompassing wearables, medical devices, and industrial equipment. The trend towards distributed PMU architectures, offering greater flexibility and modularity, is gaining traction over centralized approaches, reflecting a shift towards more sophisticated power management strategies.
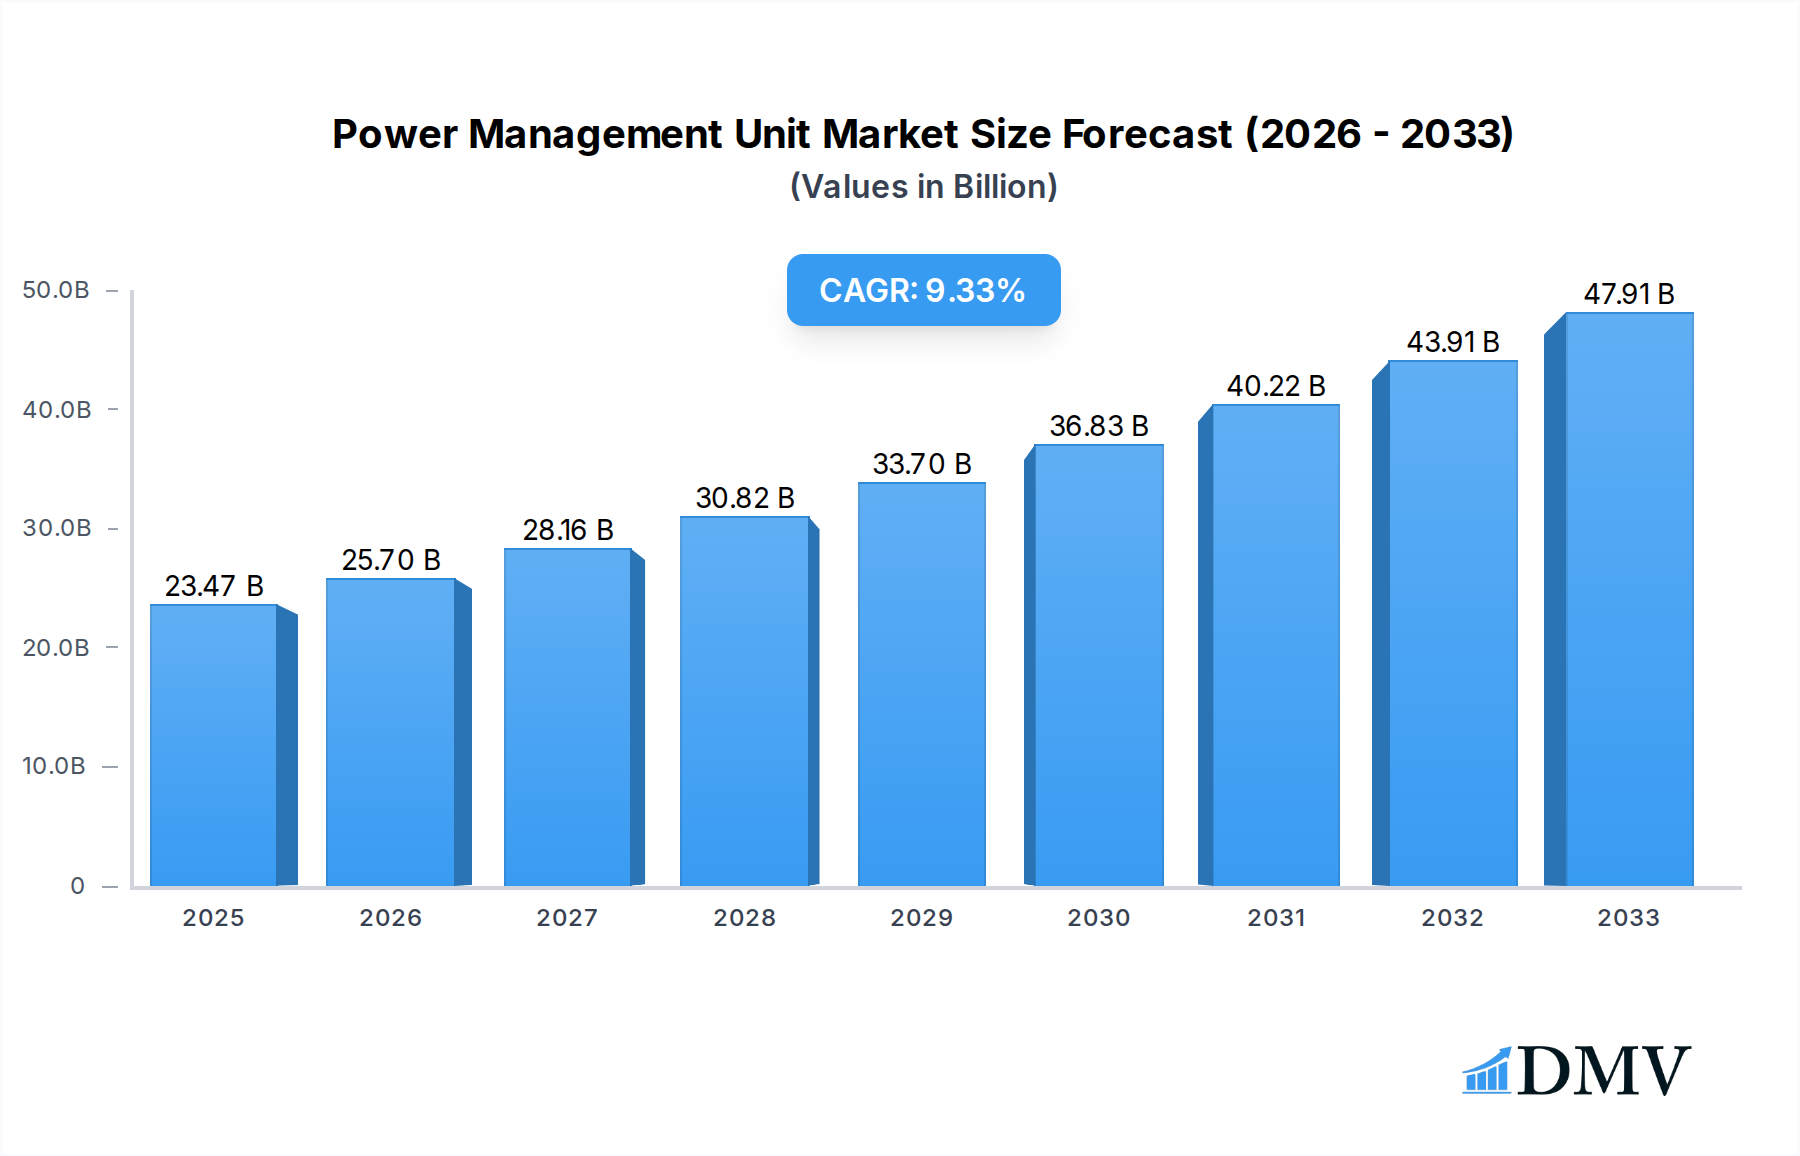
Power Management Unit Market Size (In Billion)
The market’s trajectory is further bolstered by advancements in battery technology and the increasing focus on energy efficiency by regulatory bodies and consumers alike. Trends like the integration of PMUs with advanced microcontrollers for sophisticated power sequencing and optimization, and the development of ultra-low-power PMUs for battery-operated devices, are shaping the competitive landscape. However, challenges such as the complexity of supply chains, fluctuating raw material costs, and the need for continuous R&D to keep pace with technological advancements present potential restraints. Despite these hurdles, the strategic importance of efficient power management in extending device battery life and reducing energy consumption ensures a positive outlook for the PMU market. Key players like Texas Instruments, Analog Devices, and STMicroelectronics are at the forefront of innovation, investing heavily in research and development to capture a significant share of this dynamic and expanding market.

Power Management Unit Company Market Share
Power Management Unit Market: Comprehensive Analysis and Future Outlook (2019-2033)
This in-depth report provides a thorough analysis of the global Power Management Unit (PMU) market, offering critical insights for stakeholders across the technology and electronics industries. Covering a study period from 2019 to 2033, with a base year of 2025 and a forecast period of 2025-2033, this report meticulously dissects market dynamics, technological advancements, regional dominance, and future trajectories. Gain a competitive edge with expert analysis on market trends, growth drivers, challenges, and emerging opportunities within the rapidly evolving PMU landscape.
Power Management Unit Market Composition & Trends
The Power Management Unit (PMU) market exhibits a dynamic composition driven by continuous innovation and increasing demand from diverse electronic applications. Market concentration is moderate, with key players like Texas Instruments, Analog Devices, and STMicroelectronics holding significant shares. However, the landscape is being reshaped by the emergence of specialized players and the aggressive expansion of semiconductor manufacturers like NXP Semiconductors and Onsemi into advanced PMU solutions. Innovation catalysts are primarily focused on enhancing energy efficiency, reducing form factors, and integrating advanced control functionalities for IoT devices, AI accelerators, and next-generation mobile processors. The regulatory landscape, particularly concerning energy efficiency standards and environmental impact, is increasingly influencing product development, pushing for more sustainable PMU designs. Substitute products, while existing in simpler forms for basic power regulation, struggle to match the sophisticated integration and intelligent control offered by modern PMUs. End-user profiles are broad, spanning from consumer electronics like mobile phones and televisions to industrial automation, automotive systems, and data centers. Mergers and acquisitions (M&A) are a significant trend, with deal values in the billions demonstrating strategic consolidations aimed at acquiring cutting-edge technology and expanding market reach. For instance, the acquisition of a promising ASIC design firm by a major semiconductor player for over \$5 billion in 2023 underscored the intense competition for intellectual property and market share. The global market share distribution for PMUs is projected to see a significant shift, with specialized solutions for high-performance computing and AI-driven applications witnessing accelerated growth, estimated to be over 15% annually in the forecast period.
Power Management Unit Industry Evolution
The Power Management Unit (PMU) industry has undergone a remarkable evolution, characterized by consistent market growth trajectories, rapid technological advancements, and consistently shifting consumer demands. Throughout the historical period (2019-2024), the market witnessed a steady upward trend, fueled by the proliferation of smart devices and the increasing complexity of electronic systems. Annual growth rates hovered around 10-12%, driven by the ubiquitous adoption of smartphones, the expanding PC market, and the growing influence of smart televisions. The base year of 2025 positions the market at an estimated valuation of over \$100 billion, reflecting sustained expansion. Looking ahead into the forecast period (2025-2033), the industry is poised for even more accelerated growth, projected at a compound annual growth rate (CAGR) of approximately 15-18%. This surge is directly attributable to several key factors. Firstly, technological advancements have been relentless. The transition from discrete power components to highly integrated System-on-Chips (SoCs) and advanced Application-Specific Integrated Circuits (ASICs) for power management has enabled smaller footprints, lower power consumption, and enhanced functionality. The introduction of GaN (Gallium Nitride) and SiC (Silicon Carbide) power devices has revolutionized efficiency and power density, particularly in high-power applications. Secondly, shifting consumer demands are playing a pivotal role. Consumers are increasingly seeking longer battery life in their portable devices, faster charging capabilities, and more energy-efficient home electronics. This directly translates into a greater demand for sophisticated PMUs capable of intelligently managing power consumption and optimizing performance. The rise of the Internet of Things (IoT) has created a vast new market for low-power, highly efficient PMUs, enabling the long-term operation of battery-powered sensors and devices. Furthermore, the burgeoning electric vehicle (EV) market demands robust and efficient power management solutions for battery packs, charging systems, and in-vehicle electronics, contributing significantly to industry growth. The increasing integration of AI and machine learning in consumer electronics also necessitates advanced PMUs that can dynamically adjust power delivery based on workload, further driving innovation and market expansion. The adoption of advanced power management techniques, such as dynamic voltage and frequency scaling (DVFS), adaptive voltage scaling (AVS), and intelligent sleep modes, is becoming standard across all major electronic segments, underscoring the critical role of PMUs in modern technology.
Leading Regions, Countries, or Segments in Power Management Unit
The Power Management Unit (PMU) market exhibits distinct regional dominance and segment leadership, driven by a confluence of technological adoption, investment trends, and robust regulatory support. Asia Pacific, particularly China, Taiwan, and South Korea, currently stands as the dominant region in both production and consumption of PMUs. This leadership is underpinned by the immense manufacturing capabilities in consumer electronics, including mobile phones and computers, alongside a burgeoning domestic demand for advanced technology.
- Application: Mobile Phone is the most significant segment driving PMU demand. The insatiable consumer appetite for smartphones with longer battery life, faster charging, and enhanced processing power compels manufacturers to integrate increasingly sophisticated and efficient PMUs. The market for mobile phone PMUs is expected to grow at a CAGR of over 20% in the forecast period, with annual sales exceeding \$50 billion by 2033. This growth is fueled by the constant upgrade cycles and the introduction of new features demanding precise power control.
- Application: Computer remains a substantial segment, with the growth of laptops, ultrabooks, and high-performance computing requiring efficient power management for optimal battery life and thermal performance. The increasing adoption of AI and machine learning workloads in personal computers further necessitates advanced PMU capabilities.
- Application: Television is also a notable segment, with the rise of smart TVs and energy-efficient display technologies driving demand for integrated PMUs. The focus here is on reducing standby power consumption and optimizing power delivery for high-resolution displays.
- Application: Others encompass a rapidly expanding array of devices, including wearables, IoT devices, automotive electronics, and industrial control systems. The sheer diversity and exponential growth in this category present significant opportunities for specialized PMU solutions.
From a Type perspective:
- Centralized PMUs, offering a single point of control for power distribution, are prevalent in many consumer electronics. They benefit from cost-effectiveness and simpler design for less complex systems.
- Distributed PMUs, providing localized power regulation closer to the components, are gaining significant traction, especially in advanced mobile devices and high-performance computing. This approach enhances efficiency, reduces noise, and allows for finer-grained power control, crucial for optimizing performance and battery life. The adoption of distributed architectures is expected to outpace centralized systems in the forecast period, driven by their superior efficiency and flexibility.
Key drivers contributing to the dominance of Asia Pacific include substantial government investments in semiconductor manufacturing infrastructure, favorable trade policies, and a vast ecosystem of electronics manufacturers. The region's ability to produce high-volume, cost-effective PMUs positions it as a critical hub for global supply chains. Furthermore, significant R&D investments by regional players like Samsung Electronics, SK Hynix, and various Chinese semiconductor companies are continuously pushing the boundaries of PMU technology, further solidifying their leadership.
Power Management Unit Product Innovations
Power Management Unit (PMU) product innovations are consistently pushing the boundaries of efficiency, integration, and intelligence. Key advancements include the development of ultra-low quiescent current (Iq) PMUs, crucial for extending battery life in always-on IoT devices, with current draws in the nanoampere range. Highly integrated PMU ICs are now incorporating multiple voltage regulators, battery chargers, and power sequencing capabilities onto a single chip, significantly reducing board space and bill of materials. Furthermore, the integration of advanced digital control loops and adaptive algorithms enables dynamic power optimization, responding in real-time to workload fluctuations and environmental conditions. Performance metrics are seeing substantial improvements, with efficiency ratings now exceeding 95% for many advanced PMUs, and switching frequencies in the megahertz range enabling smaller inductor sizes.
Propelling Factors for Power Management Unit Growth
Several critical factors are propelling the growth of the Power Management Unit (PMU) market. The exponential growth of the Internet of Things (IoT) ecosystem, with billions of connected devices requiring efficient and long-lasting power solutions, is a primary driver. The increasing demand for mobile devices with extended battery life and faster charging capabilities, coupled with the continuous innovation in mobile processor performance, necessitates advanced PMUs. Furthermore, the burgeoning electric vehicle (EV) market, with its complex power requirements for battery management, charging infrastructure, and onboard electronics, presents a significant growth avenue. Government initiatives promoting energy efficiency standards and sustainability in electronics also contribute to the demand for high-performance PMUs.
Obstacles in the Power Management Unit Market
Despite robust growth, the Power Management Unit (PMU) market faces several obstacles. Intense price competition, particularly in high-volume consumer segments, can compress profit margins for manufacturers. Supply chain disruptions, exacerbated by geopolitical tensions and component shortages, can lead to production delays and increased costs. The complexity of advanced PMU designs also requires specialized manufacturing processes and highly skilled labor, which can be a bottleneck for smaller players. Furthermore, the rapidly evolving technological landscape necessitates continuous R&D investment to stay competitive, posing a significant financial challenge. Regulatory hurdles related to electromagnetic interference (EMI) and safety standards in certain regions can also add to development time and cost.
Future Opportunities in Power Management Unit
The future of the Power Management Unit (PMU) market is brimming with opportunities. The accelerating adoption of 5G technology and the subsequent rise of data-intensive applications will drive demand for high-performance, efficient PMUs in network infrastructure and user devices. The expansion of artificial intelligence (AI) and machine learning (ML) into edge computing and autonomous systems will require specialized PMUs capable of handling complex power management for AI accelerators. The growing trend towards renewable energy integration and smart grid technologies will also create opportunities for advanced PMUs in energy storage systems and power conversion. Furthermore, the increasing focus on miniaturization and wearable technology will continue to fuel innovation in compact and highly integrated PMU solutions.
Major Players in the Power Management Unit Ecosystem
Texas Instruments, Ams AG, NXP Semiconductors, Nordic Semiconductor, Leonardo DRS, STMicroelectronics, Analog Devices, Onsemi, Atmel, Microchip Technology, Qorvo, Electro Standards Laboratories, Rockchip.
Key Developments in Power Management Unit Industry
- 2023 November: Texas Instruments launches a new family of ultra-low power DC-DC converters designed for battery-powered IoT devices, offering reduced quiescent current.
- 2023 October: Analog Devices acquires a leading provider of high-performance power management ICs, strengthening its portfolio for automotive and industrial applications.
- 2023 September: NXP Semiconductors announces a new PMU platform optimized for next-generation automotive infotainment systems, supporting advanced power sequencing and efficiency.
- 2023 August: STMicroelectronics introduces a new series of PMUs with advanced digital control capabilities for 5G infrastructure, enabling dynamic power optimization.
- 2023 July: Onsemi unveils a GaN-based power management solution for electric vehicle charging, promising higher efficiency and faster charging times.
- 2023 June: Qorvo expands its RF power management offerings with new integrated solutions for mobile device power efficiency.
- 2023 May: Microchip Technology acquires a specialized provider of ultra-low power microcontrollers with integrated power management, targeting battery-constrained applications.
- 2023 April: Ams AG releases a new generation of highly integrated PMUs for wearables, enabling smaller form factors and extended battery life.
- 2023 March: Nordic Semiconductor introduces advanced power management features in its latest Bluetooth Low Energy SoCs, further enhancing battery efficiency for connected devices.
- 2023 February: Rockchip announces new PMU solutions tailored for smart home devices and AI-powered edge computing applications.
Strategic Power Management Unit Market Forecast
The strategic forecast for the Power Management Unit (PMU) market indicates a future characterized by sustained and accelerated growth, driven by relentless technological innovation and the expanding reach of electronics into every facet of modern life. The convergence of AI, 5G, and the ever-growing IoT ecosystem will continue to be the primary catalysts for demand. Companies that can deliver highly integrated, ultra-efficient, and intelligent PMU solutions will be best positioned to capitalize on emerging opportunities in sectors like electric mobility, smart infrastructure, and advanced consumer electronics. The market's trajectory points towards a future where sophisticated power management is not just a feature, but a fundamental enabler of technological progress.
Power Management Unit Segmentation
-
1. Application
- 1.1. Mobile Phone
- 1.2. Computer
- 1.3. Television
- 1.4. Others
-
2. Types
- 2.1. Centralized
- 2.2. Distributed
Power Management Unit Segmentation By Geography
-
1. North America
- 1.1. United States
- 1.2. Canada
- 1.3. Mexico
-
2. South America
- 2.1. Brazil
- 2.2. Argentina
- 2.3. Rest of South America
-
3. Europe
- 3.1. United Kingdom
- 3.2. Germany
- 3.3. France
- 3.4. Italy
- 3.5. Spain
- 3.6. Russia
- 3.7. Benelux
- 3.8. Nordics
- 3.9. Rest of Europe
-
4. Middle East & Africa
- 4.1. Turkey
- 4.2. Israel
- 4.3. GCC
- 4.4. North Africa
- 4.5. South Africa
- 4.6. Rest of Middle East & Africa
-
5. Asia Pacific
- 5.1. China
- 5.2. India
- 5.3. Japan
- 5.4. South Korea
- 5.5. ASEAN
- 5.6. Oceania
- 5.7. Rest of Asia Pacific
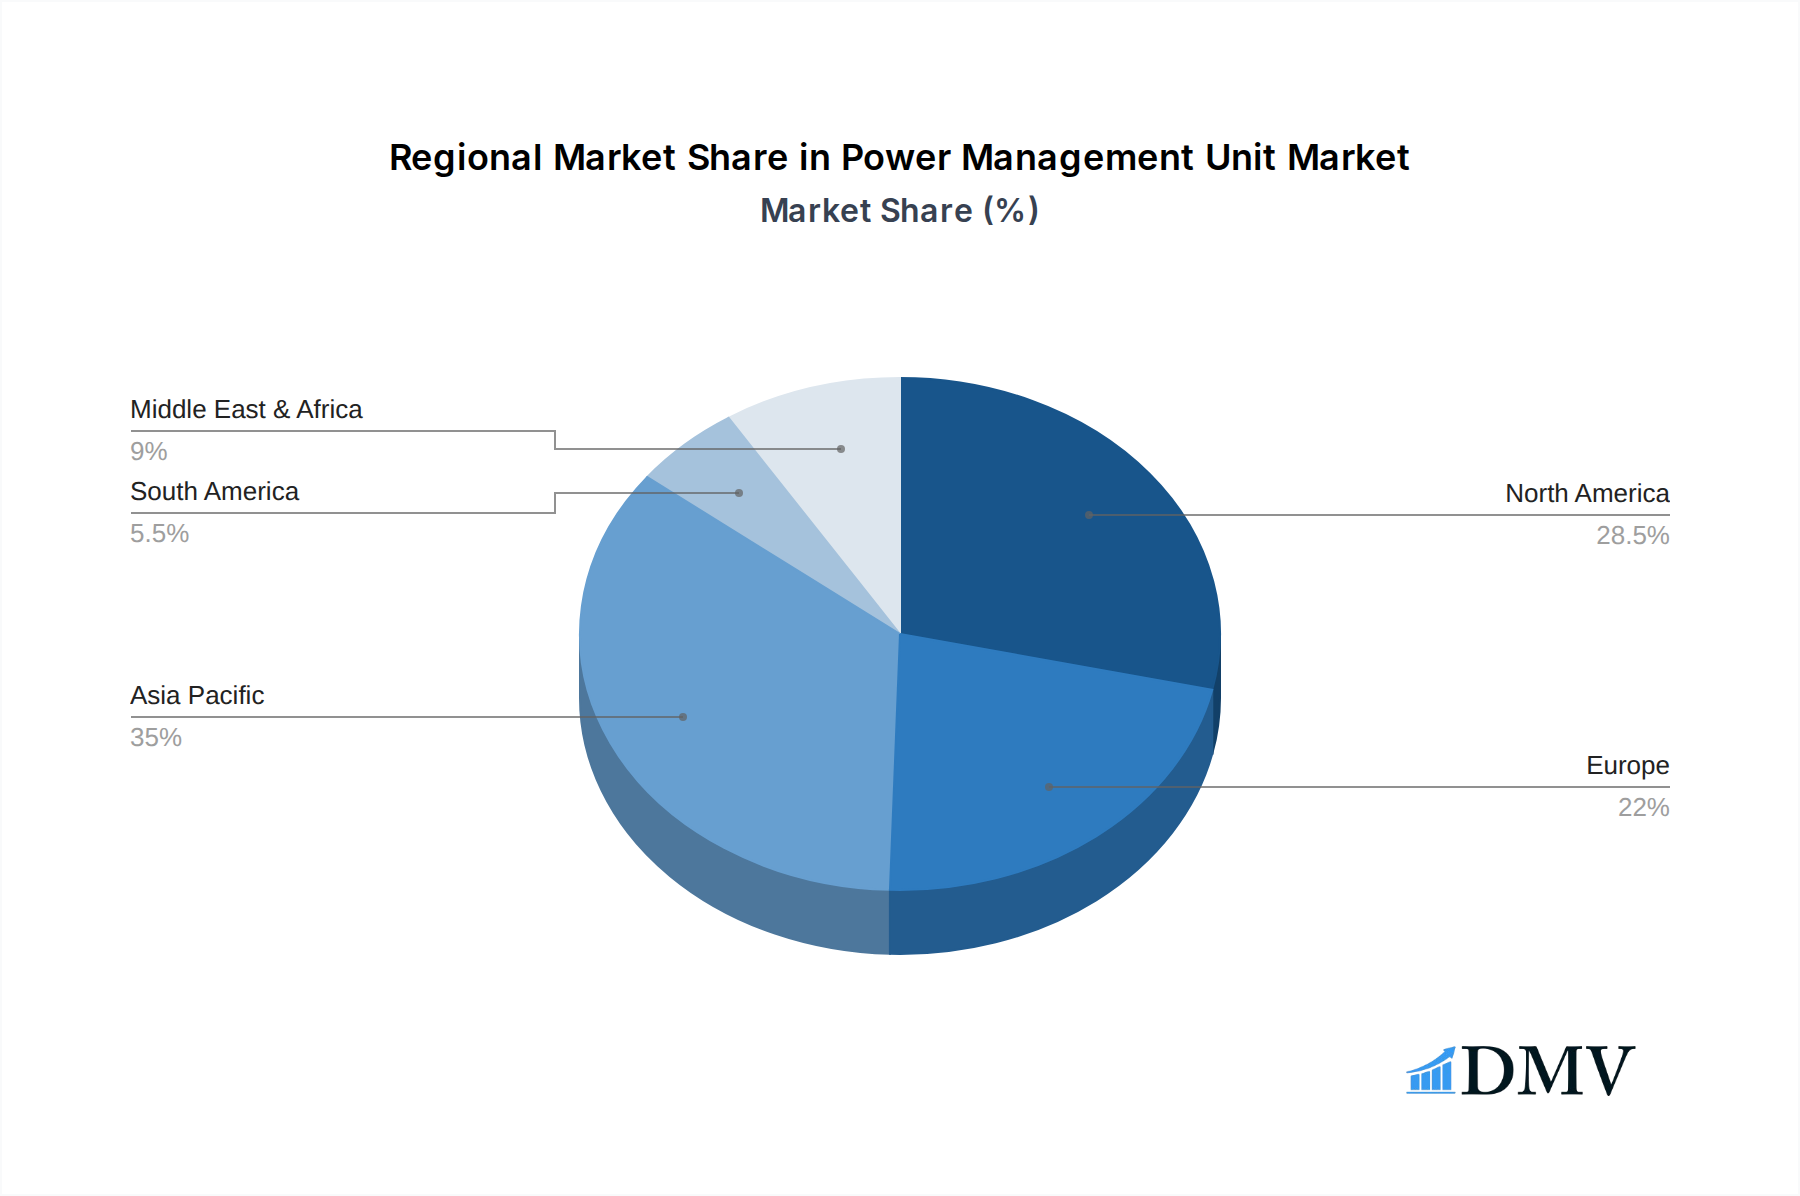
Power Management Unit Regional Market Share
Geographic Coverage of Power Management Unit
Power Management Unit REPORT HIGHLIGHTS
| Aspects | Details |
|---|---|
| Study Period | 2020-2034 |
| Base Year | 2025 |
| Estimated Year | 2026 |
| Forecast Period | 2026-2034 |
| Historical Period | 2020-2025 |
| Growth Rate | CAGR of 9.6% from 2020-2034 |
| Segmentation |
|
Table of Contents
- 1. Introduction
- 1.1. Research Scope
- 1.2. Market Segmentation
- 1.3. Research Objective
- 1.4. Definitions and Assumptions
- 2. Executive Summary
- 2.1. Market Snapshot
- 3. Market Dynamics
- 3.1. Market Drivers
- 3.2. Market Restrains
- 3.3. Market Trends
- 3.4. Market Opportunities
- 4. Market Factor Analysis
- 4.1. Porters Five Forces
- 4.1.1. Bargaining Power of Suppliers
- 4.1.2. Bargaining Power of Buyers
- 4.1.3. Threat of New Entrants
- 4.1.4. Threat of Substitutes
- 4.1.5. Competitive Rivalry
- 4.2. PESTEL analysis
- 4.3. BCG Analysis
- 4.3.1. Stars (High Growth, High Market Share)
- 4.3.2. Cash Cows (Low Growth, High Market Share)
- 4.3.3. Question Mark (High Growth, Low Market Share)
- 4.3.4. Dogs (Low Growth, Low Market Share)
- 4.4. Ansoff Matrix Analysis
- 4.5. Supply Chain Analysis
- 4.6. Regulatory Landscape
- 4.7. Current Market Potential and Opportunity Assessment (TAM–SAM–SOM Framework)
- 4.8. DMV Analyst Note
- 4.1. Porters Five Forces
- 5. Market Analysis, Insights and Forecast 2021-2033
- 5.1. Market Analysis, Insights and Forecast - by Application
- 5.1.1. Mobile Phone
- 5.1.2. Computer
- 5.1.3. Television
- 5.1.4. Others
- 5.2. Market Analysis, Insights and Forecast - by Types
- 5.2.1. Centralized
- 5.2.2. Distributed
- 5.3. Market Analysis, Insights and Forecast - by Region
- 5.3.1. North America
- 5.3.2. South America
- 5.3.3. Europe
- 5.3.4. Middle East & Africa
- 5.3.5. Asia Pacific
- 5.1. Market Analysis, Insights and Forecast - by Application
- 6. Global Power Management Unit Analysis, Insights and Forecast, 2021-2033
- 6.1. Market Analysis, Insights and Forecast - by Application
- 6.1.1. Mobile Phone
- 6.1.2. Computer
- 6.1.3. Television
- 6.1.4. Others
- 6.2. Market Analysis, Insights and Forecast - by Types
- 6.2.1. Centralized
- 6.2.2. Distributed
- 6.1. Market Analysis, Insights and Forecast - by Application
- 7. North America Power Management Unit Analysis, Insights and Forecast, 2020-2032
- 7.1. Market Analysis, Insights and Forecast - by Application
- 7.1.1. Mobile Phone
- 7.1.2. Computer
- 7.1.3. Television
- 7.1.4. Others
- 7.2. Market Analysis, Insights and Forecast - by Types
- 7.2.1. Centralized
- 7.2.2. Distributed
- 7.1. Market Analysis, Insights and Forecast - by Application
- 8. South America Power Management Unit Analysis, Insights and Forecast, 2020-2032
- 8.1. Market Analysis, Insights and Forecast - by Application
- 8.1.1. Mobile Phone
- 8.1.2. Computer
- 8.1.3. Television
- 8.1.4. Others
- 8.2. Market Analysis, Insights and Forecast - by Types
- 8.2.1. Centralized
- 8.2.2. Distributed
- 8.1. Market Analysis, Insights and Forecast - by Application
- 9. Europe Power Management Unit Analysis, Insights and Forecast, 2020-2032
- 9.1. Market Analysis, Insights and Forecast - by Application
- 9.1.1. Mobile Phone
- 9.1.2. Computer
- 9.1.3. Television
- 9.1.4. Others
- 9.2. Market Analysis, Insights and Forecast - by Types
- 9.2.1. Centralized
- 9.2.2. Distributed
- 9.1. Market Analysis, Insights and Forecast - by Application
- 10. Middle East & Africa Power Management Unit Analysis, Insights and Forecast, 2020-2032
- 10.1. Market Analysis, Insights and Forecast - by Application
- 10.1.1. Mobile Phone
- 10.1.2. Computer
- 10.1.3. Television
- 10.1.4. Others
- 10.2. Market Analysis, Insights and Forecast - by Types
- 10.2.1. Centralized
- 10.2.2. Distributed
- 10.1. Market Analysis, Insights and Forecast - by Application
- 11. Asia Pacific Power Management Unit Analysis, Insights and Forecast, 2020-2032
- 11.1. Market Analysis, Insights and Forecast - by Application
- 11.1.1. Mobile Phone
- 11.1.2. Computer
- 11.1.3. Television
- 11.1.4. Others
- 11.2. Market Analysis, Insights and Forecast - by Types
- 11.2.1. Centralized
- 11.2.2. Distributed
- 11.1. Market Analysis, Insights and Forecast - by Application
- 12. Competitive Analysis
- 12.1. Company Profiles
- 12.1.1 Texas Instruments
- 12.1.1.1. Company Overview
- 12.1.1.2. Products
- 12.1.1.3. Company Financials
- 12.1.1.4. SWOT Analysis
- 12.1.2 Ams AG
- 12.1.2.1. Company Overview
- 12.1.2.2. Products
- 12.1.2.3. Company Financials
- 12.1.2.4. SWOT Analysis
- 12.1.3 NXP Semiconductors
- 12.1.3.1. Company Overview
- 12.1.3.2. Products
- 12.1.3.3. Company Financials
- 12.1.3.4. SWOT Analysis
- 12.1.4 Nordic Semiconductor
- 12.1.4.1. Company Overview
- 12.1.4.2. Products
- 12.1.4.3. Company Financials
- 12.1.4.4. SWOT Analysis
- 12.1.5 Leonardo DRS
- 12.1.5.1. Company Overview
- 12.1.5.2. Products
- 12.1.5.3. Company Financials
- 12.1.5.4. SWOT Analysis
- 12.1.6 STMicroelectronics
- 12.1.6.1. Company Overview
- 12.1.6.2. Products
- 12.1.6.3. Company Financials
- 12.1.6.4. SWOT Analysis
- 12.1.7 Analog Devices
- 12.1.7.1. Company Overview
- 12.1.7.2. Products
- 12.1.7.3. Company Financials
- 12.1.7.4. SWOT Analysis
- 12.1.8 Onsemi
- 12.1.8.1. Company Overview
- 12.1.8.2. Products
- 12.1.8.3. Company Financials
- 12.1.8.4. SWOT Analysis
- 12.1.9 Atmel
- 12.1.9.1. Company Overview
- 12.1.9.2. Products
- 12.1.9.3. Company Financials
- 12.1.9.4. SWOT Analysis
- 12.1.10 Microchip Technology
- 12.1.10.1. Company Overview
- 12.1.10.2. Products
- 12.1.10.3. Company Financials
- 12.1.10.4. SWOT Analysis
- 12.1.11 Qorvo
- 12.1.11.1. Company Overview
- 12.1.11.2. Products
- 12.1.11.3. Company Financials
- 12.1.11.4. SWOT Analysis
- 12.1.12 Electro Standards Laboratories
- 12.1.12.1. Company Overview
- 12.1.12.2. Products
- 12.1.12.3. Company Financials
- 12.1.12.4. SWOT Analysis
- 12.1.13 Rockchip
- 12.1.13.1. Company Overview
- 12.1.13.2. Products
- 12.1.13.3. Company Financials
- 12.1.13.4. SWOT Analysis
- 12.1.1 Texas Instruments
- 12.2. Market Entropy
- 12.2.1 Company's Key Areas Served
- 12.2.2 Recent Developments
- 12.3. Company Market Share Analysis 2025
- 12.3.1 Top 5 Companies Market Share Analysis
- 12.3.2 Top 3 Companies Market Share Analysis
- 12.4. List of Potential Customers
- 13. Research Methodology
List of Figures
- Figure 1: Global Power Management Unit Revenue Breakdown (billion, %) by Region 2025 & 2033
- Figure 2: North America Power Management Unit Revenue (billion), by Application 2025 & 2033
- Figure 3: North America Power Management Unit Revenue Share (%), by Application 2025 & 2033
- Figure 4: North America Power Management Unit Revenue (billion), by Types 2025 & 2033
- Figure 5: North America Power Management Unit Revenue Share (%), by Types 2025 & 2033
- Figure 6: North America Power Management Unit Revenue (billion), by Country 2025 & 2033
- Figure 7: North America Power Management Unit Revenue Share (%), by Country 2025 & 2033
- Figure 8: South America Power Management Unit Revenue (billion), by Application 2025 & 2033
- Figure 9: South America Power Management Unit Revenue Share (%), by Application 2025 & 2033
- Figure 10: South America Power Management Unit Revenue (billion), by Types 2025 & 2033
- Figure 11: South America Power Management Unit Revenue Share (%), by Types 2025 & 2033
- Figure 12: South America Power Management Unit Revenue (billion), by Country 2025 & 2033
- Figure 13: South America Power Management Unit Revenue Share (%), by Country 2025 & 2033
- Figure 14: Europe Power Management Unit Revenue (billion), by Application 2025 & 2033
- Figure 15: Europe Power Management Unit Revenue Share (%), by Application 2025 & 2033
- Figure 16: Europe Power Management Unit Revenue (billion), by Types 2025 & 2033
- Figure 17: Europe Power Management Unit Revenue Share (%), by Types 2025 & 2033
- Figure 18: Europe Power Management Unit Revenue (billion), by Country 2025 & 2033
- Figure 19: Europe Power Management Unit Revenue Share (%), by Country 2025 & 2033
- Figure 20: Middle East & Africa Power Management Unit Revenue (billion), by Application 2025 & 2033
- Figure 21: Middle East & Africa Power Management Unit Revenue Share (%), by Application 2025 & 2033
- Figure 22: Middle East & Africa Power Management Unit Revenue (billion), by Types 2025 & 2033
- Figure 23: Middle East & Africa Power Management Unit Revenue Share (%), by Types 2025 & 2033
- Figure 24: Middle East & Africa Power Management Unit Revenue (billion), by Country 2025 & 2033
- Figure 25: Middle East & Africa Power Management Unit Revenue Share (%), by Country 2025 & 2033
- Figure 26: Asia Pacific Power Management Unit Revenue (billion), by Application 2025 & 2033
- Figure 27: Asia Pacific Power Management Unit Revenue Share (%), by Application 2025 & 2033
- Figure 28: Asia Pacific Power Management Unit Revenue (billion), by Types 2025 & 2033
- Figure 29: Asia Pacific Power Management Unit Revenue Share (%), by Types 2025 & 2033
- Figure 30: Asia Pacific Power Management Unit Revenue (billion), by Country 2025 & 2033
- Figure 31: Asia Pacific Power Management Unit Revenue Share (%), by Country 2025 & 2033
List of Tables
- Table 1: Global Power Management Unit Revenue billion Forecast, by Application 2020 & 2033
- Table 2: Global Power Management Unit Revenue billion Forecast, by Types 2020 & 2033
- Table 3: Global Power Management Unit Revenue billion Forecast, by Region 2020 & 2033
- Table 4: Global Power Management Unit Revenue billion Forecast, by Application 2020 & 2033
- Table 5: Global Power Management Unit Revenue billion Forecast, by Types 2020 & 2033
- Table 6: Global Power Management Unit Revenue billion Forecast, by Country 2020 & 2033
- Table 7: United States Power Management Unit Revenue (billion) Forecast, by Application 2020 & 2033
- Table 8: Canada Power Management Unit Revenue (billion) Forecast, by Application 2020 & 2033
- Table 9: Mexico Power Management Unit Revenue (billion) Forecast, by Application 2020 & 2033
- Table 10: Global Power Management Unit Revenue billion Forecast, by Application 2020 & 2033
- Table 11: Global Power Management Unit Revenue billion Forecast, by Types 2020 & 2033
- Table 12: Global Power Management Unit Revenue billion Forecast, by Country 2020 & 2033
- Table 13: Brazil Power Management Unit Revenue (billion) Forecast, by Application 2020 & 2033
- Table 14: Argentina Power Management Unit Revenue (billion) Forecast, by Application 2020 & 2033
- Table 15: Rest of South America Power Management Unit Revenue (billion) Forecast, by Application 2020 & 2033
- Table 16: Global Power Management Unit Revenue billion Forecast, by Application 2020 & 2033
- Table 17: Global Power Management Unit Revenue billion Forecast, by Types 2020 & 2033
- Table 18: Global Power Management Unit Revenue billion Forecast, by Country 2020 & 2033
- Table 19: United Kingdom Power Management Unit Revenue (billion) Forecast, by Application 2020 & 2033
- Table 20: Germany Power Management Unit Revenue (billion) Forecast, by Application 2020 & 2033
- Table 21: France Power Management Unit Revenue (billion) Forecast, by Application 2020 & 2033
- Table 22: Italy Power Management Unit Revenue (billion) Forecast, by Application 2020 & 2033
- Table 23: Spain Power Management Unit Revenue (billion) Forecast, by Application 2020 & 2033
- Table 24: Russia Power Management Unit Revenue (billion) Forecast, by Application 2020 & 2033
- Table 25: Benelux Power Management Unit Revenue (billion) Forecast, by Application 2020 & 2033
- Table 26: Nordics Power Management Unit Revenue (billion) Forecast, by Application 2020 & 2033
- Table 27: Rest of Europe Power Management Unit Revenue (billion) Forecast, by Application 2020 & 2033
- Table 28: Global Power Management Unit Revenue billion Forecast, by Application 2020 & 2033
- Table 29: Global Power Management Unit Revenue billion Forecast, by Types 2020 & 2033
- Table 30: Global Power Management Unit Revenue billion Forecast, by Country 2020 & 2033
- Table 31: Turkey Power Management Unit Revenue (billion) Forecast, by Application 2020 & 2033
- Table 32: Israel Power Management Unit Revenue (billion) Forecast, by Application 2020 & 2033
- Table 33: GCC Power Management Unit Revenue (billion) Forecast, by Application 2020 & 2033
- Table 34: North Africa Power Management Unit Revenue (billion) Forecast, by Application 2020 & 2033
- Table 35: South Africa Power Management Unit Revenue (billion) Forecast, by Application 2020 & 2033
- Table 36: Rest of Middle East & Africa Power Management Unit Revenue (billion) Forecast, by Application 2020 & 2033
- Table 37: Global Power Management Unit Revenue billion Forecast, by Application 2020 & 2033
- Table 38: Global Power Management Unit Revenue billion Forecast, by Types 2020 & 2033
- Table 39: Global Power Management Unit Revenue billion Forecast, by Country 2020 & 2033
- Table 40: China Power Management Unit Revenue (billion) Forecast, by Application 2020 & 2033
- Table 41: India Power Management Unit Revenue (billion) Forecast, by Application 2020 & 2033
- Table 42: Japan Power Management Unit Revenue (billion) Forecast, by Application 2020 & 2033
- Table 43: South Korea Power Management Unit Revenue (billion) Forecast, by Application 2020 & 2033
- Table 44: ASEAN Power Management Unit Revenue (billion) Forecast, by Application 2020 & 2033
- Table 45: Oceania Power Management Unit Revenue (billion) Forecast, by Application 2020 & 2033
- Table 46: Rest of Asia Pacific Power Management Unit Revenue (billion) Forecast, by Application 2020 & 2033
Frequently Asked Questions
1. What is the projected Compound Annual Growth Rate (CAGR) of the Power Management Unit?
The projected CAGR is approximately 9.6%.
2. Which companies are prominent players in the Power Management Unit?
Key companies in the market include Texas Instruments, Ams AG, NXP Semiconductors, Nordic Semiconductor, Leonardo DRS, STMicroelectronics, Analog Devices, Onsemi, Atmel, Microchip Technology, Qorvo, Electro Standards Laboratories, Rockchip.
3. What are the main segments of the Power Management Unit?
The market segments include Application, Types.
4. Can you provide details about the market size?
The market size is estimated to be USD 23.47 billion as of 2022.
5. What are some drivers contributing to market growth?
N/A
6. What are the notable trends driving market growth?
N/A
7. Are there any restraints impacting market growth?
N/A
8. Can you provide examples of recent developments in the market?
N/A
9. What pricing options are available for accessing the report?
Pricing options include single-user, multi-user, and enterprise licenses priced at USD 2900.00, USD 4350.00, and USD 5800.00 respectively.
10. Is the market size provided in terms of value or volume?
The market size is provided in terms of value, measured in billion.
11. Are there any specific market keywords associated with the report?
Yes, the market keyword associated with the report is "Power Management Unit," which aids in identifying and referencing the specific market segment covered.
12. How do I determine which pricing option suits my needs best?
The pricing options vary based on user requirements and access needs. Individual users may opt for single-user licenses, while businesses requiring broader access may choose multi-user or enterprise licenses for cost-effective access to the report.
13. Are there any additional resources or data provided in the Power Management Unit report?
While the report offers comprehensive insights, it's advisable to review the specific contents or supplementary materials provided to ascertain if additional resources or data are available.
14. How can I stay updated on further developments or reports in the Power Management Unit?
To stay informed about further developments, trends, and reports in the Power Management Unit, consider subscribing to industry newsletters, following relevant companies and organizations, or regularly checking reputable industry news sources and publications.
Methodology
Step 1 - Identification of Relevant Samples Size from Population Database


Step 2 - Approaches for Defining Global Market Size (Value, Volume* & Price*)

Note*: In applicable scenarios
Step 3 - Data Sources
Primary Research
- Web Analytics
- Survey Reports
- Research Institute
- Latest Research Reports
- Opinion Leaders
Secondary Research
- Annual Reports
- White Paper
- Latest Press Release
- Industry Association
- Paid Database
- Investor Presentations

Step 4 - Data Triangulation
Involves using different sources of information in order to increase the validity of a study
These sources are likely to be stakeholders in a program - participants, other researchers, program staff, other community members, and so on.
Then we put all data in single framework & apply various statistical tools to find out the dynamic on the market.
During the analysis stage, feedback from the stakeholder groups would be compared to determine areas of agreement as well as areas of divergence