

Key Insights
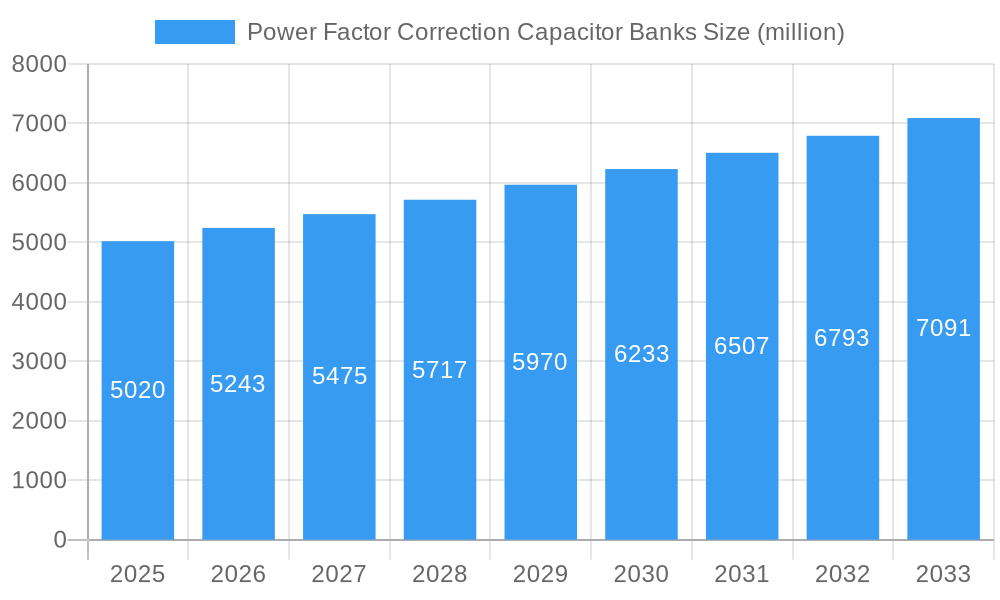
The global Power Factor Correction Capacitor Banks market is poised for substantial growth, projected to reach approximately $5.02 billion by 2025. This upward trajectory is fueled by an anticipated Compound Annual Growth Rate (CAGR) of 4.55% from 2019 to 2033. A primary driver for this expansion is the increasing global demand for energy efficiency, particularly from industrial and commercial sectors looking to reduce electricity costs and comply with stringent environmental regulations. Utilities are also investing heavily in grid modernization to improve power quality and minimize energy losses, further bolstering market demand. The rising adoption of renewable energy sources, which can often cause power quality issues, necessitates robust power factor correction solutions, acting as another significant growth catalyst. Furthermore, government incentives and policies promoting energy conservation are actively encouraging businesses to adopt these capacitor banks.
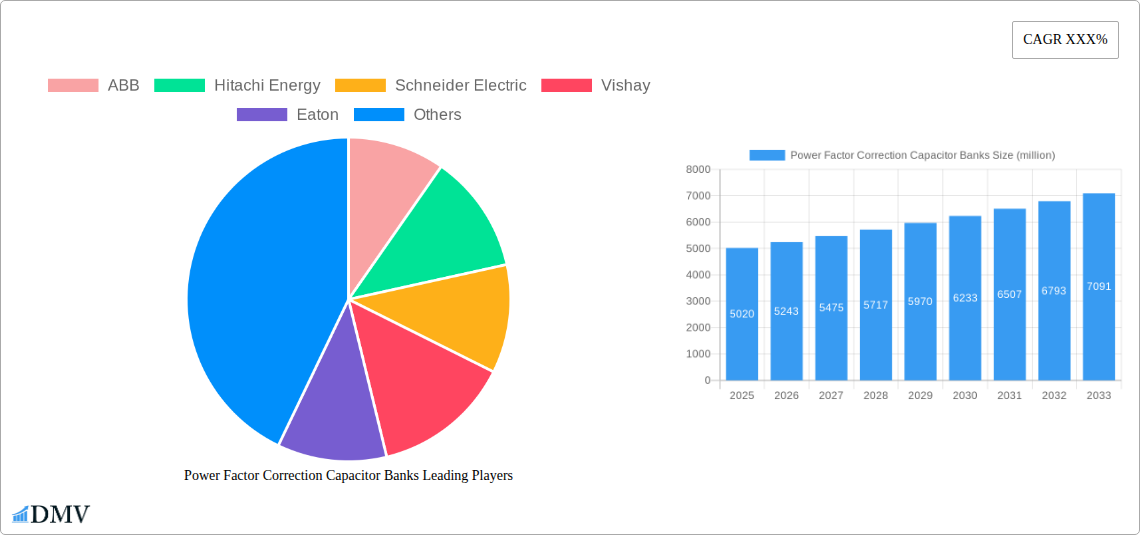
Power Factor Correction Capacitor Banks Market Size (In Billion)
The market is segmented into key applications, including Commercial Utility, Industrial Utility, and Public Power Supply. Within these applications, both Automatic and Fixed types of capacitor banks are witnessing steady demand, with automatic systems gaining prominence due to their dynamic response capabilities to fluctuating loads. Key industry players such as ABB, Hitachi Energy, Schneider Electric, and Siemens Energy are at the forefront, driving innovation and expanding their product portfolios to cater to evolving market needs. While the market is robust, potential restraints could include the initial capital investment required for installation and the availability of skilled labor for maintenance and upgrades. However, the long-term cost savings and operational benefits associated with improved power factor are expected to outweigh these challenges, ensuring continued market expansion across all regions.
Power Factor Correction Capacitor Banks Company Market Share
Power Factor Correction Capacitor Banks Market Composition & Trends
The global Power Factor Correction Capacitor Banks market demonstrates a moderately concentrated landscape, with key players such as ABB, Hitachi Energy, Schneider Electric, Eaton, and Siemens Energy commanding significant market share. Innovation is primarily driven by the demand for enhanced energy efficiency, reduced power losses, and compliance with stringent grid codes. Regulatory frameworks, particularly those promoting sustainability and energy conservation, act as crucial catalysts, pushing utilities and industrial facilities towards adopting advanced capacitor bank solutions. Substitute products, though existing in various forms of reactive power compensation, are often outmatched by the cost-effectiveness and reliability of modern capacitor banks for large-scale applications. End-user profiles range from large-scale industrial complexes requiring stable power quality for heavy machinery to commercial establishments seeking to minimize electricity bills and public utilities managing grid stability across vast networks. Mergers and acquisitions (M&A) activity, with deal values projected to reach ### billion during the forecast period, signifies a trend towards consolidation and the integration of advanced technologies, with notable transactions expected from major manufacturers aiming to expand their product portfolios and geographical reach. The market is witnessing a steady evolution in capacitor bank technologies, with a growing emphasis on smart, digitally enabled solutions and hybrid configurations that offer greater flexibility and real-time monitoring capabilities.
Power Factor Correction Capacitor Banks Industry Evolution
The Power Factor Correction Capacitor Banks industry has undergone a remarkable transformation over the historical period of 2019–2024, driven by escalating global energy demands and an intensified focus on energy efficiency. During the study period from 2019 to 2033, the market is poised for sustained growth, with the base year of 2025 and estimated year of 2025 providing a snapshot of current market dynamics. The forecast period of 2025–2033 anticipates a compound annual growth rate (CAGR) of approximately XX.XX%, propelled by a confluence of technological advancements, evolving regulatory landscapes, and a growing awareness of the economic and environmental benefits of improved power factor.
Technological advancements have been pivotal in shaping the industry's trajectory. From traditional fixed capacitor banks, the market has witnessed a significant shift towards sophisticated automatic capacitor banks. These advanced systems leverage intelligent controllers that dynamically adjust capacitance levels in response to real-time fluctuations in load and power factor. This automation not only optimizes reactive power compensation but also enhances grid stability and reduces operational complexities for end-users. Furthermore, the integration of digital technologies, including IoT sensors and cloud-based monitoring platforms, has enabled remote diagnostics, predictive maintenance, and real-time performance analysis. This digital transformation allows for proactive issue identification, minimizing downtime and ensuring peak operational efficiency.
Shifting consumer demands have also played a crucial role. As industries face increasing pressure to reduce operational costs and minimize their carbon footprint, the economic advantages of power factor correction have become more pronounced. By improving power factor, businesses can significantly reduce penalties imposed by utilities for low power factors and lower their overall electricity consumption. This direct cost saving, coupled with the environmental benefits of reduced energy wastage, has spurred adoption across various sectors. The public power supply segment, in particular, is investing heavily in capacitor banks to improve grid efficiency, reduce transmission losses, and ensure a stable power supply to an ever-growing consumer base. The increasing adoption of renewable energy sources, which can introduce power quality challenges, further accentuates the need for robust power factor correction solutions.
The market's evolution is further characterized by the emergence of specialized capacitor bank solutions tailored to specific industry needs. For instance, industrial utilities often require high-voltage, heavy-duty capacitor banks designed to handle fluctuating industrial loads, while commercial utilities may opt for more compact and modular solutions. The industry is also seeing a rise in the development of harmonic filtering capabilities integrated within capacitor bank systems, addressing the growing concern of harmonic distortion caused by nonlinear loads. The overall trajectory indicates a move towards smarter, more integrated, and highly efficient power factor correction solutions that are central to the modern electrical infrastructure.
Leading Regions, Countries, or Segments in Power Factor Correction Capacitor Banks
The Power Factor Correction Capacitor Banks market is characterized by a dynamic interplay of regional strengths and segment dominance, with the Industrial Utility application segment and Automatic type of capacitor banks emerging as leading forces during the study period of 2019–2033.
Industrial Utility Application Dominance:
- Economic Drivers: Industrial sectors, including manufacturing, petrochemicals, mining, and heavy engineering, are the primary consumers of power factor correction capacitor banks. These industries typically operate with large, inductive loads that significantly degrade power factor, leading to substantial penalties from utilities and increased energy losses. The imperative to reduce operational expenditures and enhance production efficiency makes robust power factor correction a critical investment. For instance, a XX% improvement in power factor can translate to significant cost savings annually for a large manufacturing plant.
- Technological Integration: The sophisticated machinery and complex electrical systems prevalent in industrial settings necessitate advanced and reliable power factor correction solutions. Automatic capacitor banks, with their ability to dynamically adjust capacitance based on fluctuating loads, are particularly favored for their efficiency and responsiveness. Industries are increasingly adopting these smart solutions to optimize their energy consumption and maintain stable power quality crucial for uninterrupted operations.
- Investment Trends: Significant capital investments are being channeled into upgrading industrial infrastructure globally. This includes the retrofitting of existing facilities and the construction of new industrial complexes, both of which require substantial deployments of power factor correction systems. The base year of 2025 is expected to see a market value of ### billion for industrial utility applications alone.
Automatic Type Dominance:
- Efficiency and Responsiveness: Automatic capacitor banks offer unparalleled efficiency and responsiveness compared to their fixed counterparts. Their ability to continuously monitor and adjust reactive power compensation ensures optimal power factor under varying load conditions, minimizing energy wastage and preventing penalties. This dynamic adjustment is crucial for industries with fluctuating power demands.
- Smart Grid Integration: The increasing adoption of smart grid technologies has further propelled the demand for automatic capacitor banks. These units are designed for seamless integration with intelligent grid management systems, enabling remote monitoring, diagnostics, and control. This facilitates proactive maintenance and ensures the overall stability and reliability of the power network.
- Growth Trajectory: The market for automatic capacitor banks is projected to grow at a CAGR of XX.XX% between 2025 and 2033, outpacing the growth of fixed capacitor banks. This upward trend is driven by the ongoing need for enhanced energy efficiency and the growing sophistication of electrical systems across all end-user segments.
While Commercial Utility and Public Power Supply applications also represent significant markets, their growth is often influenced by broader economic cycles and public infrastructure development plans. However, the continuous and immediate operational cost savings and efficiency gains offered by improved power factor in industrial settings, coupled with the technological superiority of automatic systems in managing complex loads, solidify their leading positions within the global Power Factor Correction Capacitor Banks market.
Power Factor Correction Capacitor Banks Product Innovations
Product innovation in Power Factor Correction Capacitor Banks is intensely focused on enhancing energy efficiency, reliability, and intelligent control. Manufacturers like ABB, Hitachi Energy, and Schneider Electric are at the forefront, introducing advanced capacitor banks with integrated harmonic filters to combat power quality issues caused by nonlinear loads. Innovations include the development of solid-state switching technology for faster response times, reducing wear and tear compared to traditional mechanical contactors, and the incorporation of advanced digital controllers with IoT capabilities for remote monitoring, diagnostics, and predictive maintenance. These smart capacitor banks offer real-time data analytics on power factor, voltage, and current, enabling operators to optimize performance and prevent potential failures, thereby maximizing operational uptime and reducing energy losses significantly.
Propelling Factors for Power Factor Correction Capacitor Banks Growth
Several key factors are propelling the growth of the Power Factor Correction Capacitor Banks market. Firstly, the escalating global energy demand coupled with the imperative for energy efficiency is a primary driver. Utilities and industries are actively seeking solutions to reduce energy losses and operational costs, with improved power factor being a direct benefit. Secondly, stringent government regulations and international standards promoting energy conservation and grid stability are compelling adoption. Thirdly, the increasing integration of renewable energy sources, which can introduce power quality challenges, necessitates robust power factor correction systems to maintain grid stability. Finally, technological advancements, such as smart controllers and IoT integration, are making capacitor banks more efficient, reliable, and cost-effective, further stimulating market expansion.
Obstacles in the Power Factor Correction Capacitor Banks Market
Despite robust growth, the Power Factor Correction Capacitor Banks market faces several obstacles. High initial capital investment for advanced automatic systems can be a deterrent for some smaller enterprises, especially in developing economies. Fluctuations in the prices of raw materials, such as aluminum and steel, can impact manufacturing costs and profit margins. Moreover, the availability of relatively cheaper but less efficient substitute technologies for reactive power compensation presents a competitive challenge. Supply chain disruptions, as witnessed in recent global events, can also lead to delays in product delivery and increased costs. Finally, a lack of awareness regarding the long-term economic and environmental benefits of optimal power factor correction among certain end-users can hinder market penetration.
Future Opportunities in Power Factor Correction Capacitor Banks
The Power Factor Correction Capacitor Banks market is ripe with future opportunities. The ongoing expansion of smart grids globally presents a significant avenue for growth, as these grids require sophisticated power quality management solutions, including advanced capacitor banks. The increasing adoption of electric vehicles (EVs) and the associated charging infrastructure will create new demand for robust power factor correction to manage the amplified electrical loads. Furthermore, the growing focus on industrial automation and the rise of Industry 4.0 will necessitate highly reliable and intelligent power systems, where capacitor banks play a crucial role. Emerging markets in developing nations, with their rapidly industrializing economies and increasing electricity consumption, offer substantial untapped potential for market expansion and revenue generation.
Major Players in the Power Factor Correction Capacitor Banks Ecosystem
- ABB
- Hitachi Energy
- Schneider Electric
- Vishay
- Eaton
- GE
- Siemens Energy
- Sieyuan
- Chint Group
- SAMWHA
- SHIZUKI ELECTRIC
- Arteche
- Herong Electric
- CIRCUTOR
- Bree
- Enerlux Power
- Challenge Industrial Co., Ltd. (CIC)
Key Developments in Power Factor Correction Capacitor Banks Industry
- January 2024: Schneider Electric launched a new series of smart capacitor banks with enhanced digital connectivity and predictive maintenance capabilities.
- November 2023: Eaton announced a strategic partnership with a leading renewable energy developer to integrate advanced power factor correction solutions into solar farm projects.
- July 2023: Siemens Energy unveiled a groundbreaking hybrid capacitor bank technology combining traditional components with solid-state switching for superior performance.
- April 2023: Hitachi Energy acquired a specialized manufacturer of power quality solutions, further bolstering its portfolio in the capacitor bank segment.
- February 2022: ABB introduced enhanced harmonic filtering capabilities in its latest line of industrial capacitor banks, addressing growing power quality concerns.
- September 2021: Chint Group expanded its manufacturing capacity for automatic capacitor banks to meet rising demand from emerging markets.
Strategic Power Factor Correction Capacitor Banks Market Forecast
The strategic forecast for the Power Factor Correction Capacitor Banks market anticipates robust growth, primarily driven by the global push towards energy efficiency and grid modernization. The increasing adoption of smart grid technologies and the integration of renewable energy sources will create sustained demand for advanced capacitor bank solutions capable of dynamic compensation and intelligent control. The industrial sector, with its inherent need to optimize operational costs and ensure power quality, will continue to be a dominant force. Furthermore, the burgeoning market for electric vehicles and the subsequent strain on power infrastructure will necessitate significant investments in reactive power compensation. Emerging economies, with their rapid industrialization, represent a substantial growth frontier. Innovations in smart controllers, IoT integration, and hybrid capacitor bank technologies will further enhance product value and market penetration, positioning the market for a significantly larger scale by 2033.
Power Factor Correction Capacitor Banks Segmentation
-
1. Application
- 1.1. Commercial Utility
- 1.2. Industrial Utility
- 1.3. Public Power Supply
-
2. Type
- 2.1. Automatic
- 2.2. Fixed
Power Factor Correction Capacitor Banks Segmentation By Geography
-
1. North America
- 1.1. United States
- 1.2. Canada
- 1.3. Mexico
-
2. South America
- 2.1. Brazil
- 2.2. Argentina
- 2.3. Rest of South America
-
3. Europe
- 3.1. United Kingdom
- 3.2. Germany
- 3.3. France
- 3.4. Italy
- 3.5. Spain
- 3.6. Russia
- 3.7. Benelux
- 3.8. Nordics
- 3.9. Rest of Europe
-
4. Middle East & Africa
- 4.1. Turkey
- 4.2. Israel
- 4.3. GCC
- 4.4. North Africa
- 4.5. South Africa
- 4.6. Rest of Middle East & Africa
-
5. Asia Pacific
- 5.1. China
- 5.2. India
- 5.3. Japan
- 5.4. South Korea
- 5.5. ASEAN
- 5.6. Oceania
- 5.7. Rest of Asia Pacific
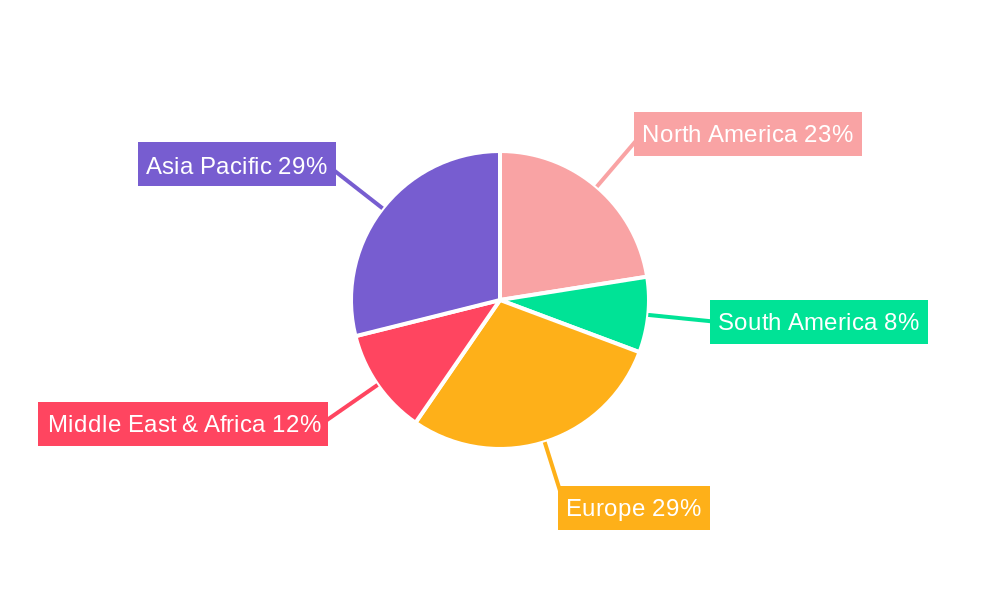
Power Factor Correction Capacitor Banks Regional Market Share
Geographic Coverage of Power Factor Correction Capacitor Banks
Power Factor Correction Capacitor Banks REPORT HIGHLIGHTS
| Aspects | Details |
|---|---|
| Study Period | 2020-2034 |
| Base Year | 2025 |
| Estimated Year | 2026 |
| Forecast Period | 2026-2034 |
| Historical Period | 2020-2025 |
| Growth Rate | CAGR of 4% from 2020-2034 |
| Segmentation |
|
Table of Contents
- 1. Introduction
- 1.1. Research Scope
- 1.2. Market Segmentation
- 1.3. Research Objective
- 1.4. Definitions and Assumptions
- 2. Executive Summary
- 2.1. Market Snapshot
- 3. Market Dynamics
- 3.1. Market Drivers
- 3.2. Market Restrains
- 3.3. Market Trends
- 3.4. Market Opportunities
- 4. Market Factor Analysis
- 4.1. Porters Five Forces
- 4.1.1. Bargaining Power of Suppliers
- 4.1.2. Bargaining Power of Buyers
- 4.1.3. Threat of New Entrants
- 4.1.4. Threat of Substitutes
- 4.1.5. Competitive Rivalry
- 4.2. PESTEL analysis
- 4.3. BCG Analysis
- 4.3.1. Stars (High Growth, High Market Share)
- 4.3.2. Cash Cows (Low Growth, High Market Share)
- 4.3.3. Question Mark (High Growth, Low Market Share)
- 4.3.4. Dogs (Low Growth, Low Market Share)
- 4.4. Ansoff Matrix Analysis
- 4.5. Supply Chain Analysis
- 4.6. Regulatory Landscape
- 4.7. Current Market Potential and Opportunity Assessment (TAM–SAM–SOM Framework)
- 4.8. DMV Analyst Note
- 4.1. Porters Five Forces
- 5. Market Analysis, Insights and Forecast 2021-2033
- 5.1. Market Analysis, Insights and Forecast - by Application
- 5.1.1. Commercial Utility
- 5.1.2. Industrial Utility
- 5.1.3. Public Power Supply
- 5.2. Market Analysis, Insights and Forecast - by Type
- 5.2.1. Automatic
- 5.2.2. Fixed
- 5.3. Market Analysis, Insights and Forecast - by Region
- 5.3.1. North America
- 5.3.2. South America
- 5.3.3. Europe
- 5.3.4. Middle East & Africa
- 5.3.5. Asia Pacific
- 5.1. Market Analysis, Insights and Forecast - by Application
- 6. Global Power Factor Correction Capacitor Banks Analysis, Insights and Forecast, 2021-2033
- 6.1. Market Analysis, Insights and Forecast - by Application
- 6.1.1. Commercial Utility
- 6.1.2. Industrial Utility
- 6.1.3. Public Power Supply
- 6.2. Market Analysis, Insights and Forecast - by Type
- 6.2.1. Automatic
- 6.2.2. Fixed
- 6.1. Market Analysis, Insights and Forecast - by Application
- 7. North America Power Factor Correction Capacitor Banks Analysis, Insights and Forecast, 2020-2032
- 7.1. Market Analysis, Insights and Forecast - by Application
- 7.1.1. Commercial Utility
- 7.1.2. Industrial Utility
- 7.1.3. Public Power Supply
- 7.2. Market Analysis, Insights and Forecast - by Type
- 7.2.1. Automatic
- 7.2.2. Fixed
- 7.1. Market Analysis, Insights and Forecast - by Application
- 8. South America Power Factor Correction Capacitor Banks Analysis, Insights and Forecast, 2020-2032
- 8.1. Market Analysis, Insights and Forecast - by Application
- 8.1.1. Commercial Utility
- 8.1.2. Industrial Utility
- 8.1.3. Public Power Supply
- 8.2. Market Analysis, Insights and Forecast - by Type
- 8.2.1. Automatic
- 8.2.2. Fixed
- 8.1. Market Analysis, Insights and Forecast - by Application
- 9. Europe Power Factor Correction Capacitor Banks Analysis, Insights and Forecast, 2020-2032
- 9.1. Market Analysis, Insights and Forecast - by Application
- 9.1.1. Commercial Utility
- 9.1.2. Industrial Utility
- 9.1.3. Public Power Supply
- 9.2. Market Analysis, Insights and Forecast - by Type
- 9.2.1. Automatic
- 9.2.2. Fixed
- 9.1. Market Analysis, Insights and Forecast - by Application
- 10. Middle East & Africa Power Factor Correction Capacitor Banks Analysis, Insights and Forecast, 2020-2032
- 10.1. Market Analysis, Insights and Forecast - by Application
- 10.1.1. Commercial Utility
- 10.1.2. Industrial Utility
- 10.1.3. Public Power Supply
- 10.2. Market Analysis, Insights and Forecast - by Type
- 10.2.1. Automatic
- 10.2.2. Fixed
- 10.1. Market Analysis, Insights and Forecast - by Application
- 11. Asia Pacific Power Factor Correction Capacitor Banks Analysis, Insights and Forecast, 2020-2032
- 11.1. Market Analysis, Insights and Forecast - by Application
- 11.1.1. Commercial Utility
- 11.1.2. Industrial Utility
- 11.1.3. Public Power Supply
- 11.2. Market Analysis, Insights and Forecast - by Type
- 11.2.1. Automatic
- 11.2.2. Fixed
- 11.1. Market Analysis, Insights and Forecast - by Application
- 12. Competitive Analysis
- 12.1. Company Profiles
- 12.1.1 ABB
- 12.1.1.1. Company Overview
- 12.1.1.2. Products
- 12.1.1.3. Company Financials
- 12.1.1.4. SWOT Analysis
- 12.1.2 Hitachi Energy
- 12.1.2.1. Company Overview
- 12.1.2.2. Products
- 12.1.2.3. Company Financials
- 12.1.2.4. SWOT Analysis
- 12.1.3 Schneider Electric
- 12.1.3.1. Company Overview
- 12.1.3.2. Products
- 12.1.3.3. Company Financials
- 12.1.3.4. SWOT Analysis
- 12.1.4 Vishay
- 12.1.4.1. Company Overview
- 12.1.4.2. Products
- 12.1.4.3. Company Financials
- 12.1.4.4. SWOT Analysis
- 12.1.5 Eaton
- 12.1.5.1. Company Overview
- 12.1.5.2. Products
- 12.1.5.3. Company Financials
- 12.1.5.4. SWOT Analysis
- 12.1.6 GE
- 12.1.6.1. Company Overview
- 12.1.6.2. Products
- 12.1.6.3. Company Financials
- 12.1.6.4. SWOT Analysis
- 12.1.7 Siemens Energy
- 12.1.7.1. Company Overview
- 12.1.7.2. Products
- 12.1.7.3. Company Financials
- 12.1.7.4. SWOT Analysis
- 12.1.8 Sieyuan
- 12.1.8.1. Company Overview
- 12.1.8.2. Products
- 12.1.8.3. Company Financials
- 12.1.8.4. SWOT Analysis
- 12.1.9 Chint Group
- 12.1.9.1. Company Overview
- 12.1.9.2. Products
- 12.1.9.3. Company Financials
- 12.1.9.4. SWOT Analysis
- 12.1.10 SAMWHA
- 12.1.10.1. Company Overview
- 12.1.10.2. Products
- 12.1.10.3. Company Financials
- 12.1.10.4. SWOT Analysis
- 12.1.11 SHIZUKI ELECTRIC
- 12.1.11.1. Company Overview
- 12.1.11.2. Products
- 12.1.11.3. Company Financials
- 12.1.11.4. SWOT Analysis
- 12.1.12 Arteche
- 12.1.12.1. Company Overview
- 12.1.12.2. Products
- 12.1.12.3. Company Financials
- 12.1.12.4. SWOT Analysis
- 12.1.13 Herong Electric
- 12.1.13.1. Company Overview
- 12.1.13.2. Products
- 12.1.13.3. Company Financials
- 12.1.13.4. SWOT Analysis
- 12.1.14 CIRCUTOR
- 12.1.14.1. Company Overview
- 12.1.14.2. Products
- 12.1.14.3. Company Financials
- 12.1.14.4. SWOT Analysis
- 12.1.15 Bree
- 12.1.15.1. Company Overview
- 12.1.15.2. Products
- 12.1.15.3. Company Financials
- 12.1.15.4. SWOT Analysis
- 12.1.16 Enerlux Power
- 12.1.16.1. Company Overview
- 12.1.16.2. Products
- 12.1.16.3. Company Financials
- 12.1.16.4. SWOT Analysis
- 12.1.17 Challenge Industrial Co. Ltd. (CIC)
- 12.1.17.1. Company Overview
- 12.1.17.2. Products
- 12.1.17.3. Company Financials
- 12.1.17.4. SWOT Analysis
- 12.1.1 ABB
- 12.2. Market Entropy
- 12.2.1 Company's Key Areas Served
- 12.2.2 Recent Developments
- 12.3. Company Market Share Analysis 2025
- 12.3.1 Top 5 Companies Market Share Analysis
- 12.3.2 Top 3 Companies Market Share Analysis
- 12.4. List of Potential Customers
- 13. Research Methodology
List of Figures
- Figure 1: Global Power Factor Correction Capacitor Banks Revenue Breakdown (undefined, %) by Region 2025 & 2033
- Figure 2: North America Power Factor Correction Capacitor Banks Revenue (undefined), by Application 2025 & 2033
- Figure 3: North America Power Factor Correction Capacitor Banks Revenue Share (%), by Application 2025 & 2033
- Figure 4: North America Power Factor Correction Capacitor Banks Revenue (undefined), by Type 2025 & 2033
- Figure 5: North America Power Factor Correction Capacitor Banks Revenue Share (%), by Type 2025 & 2033
- Figure 6: North America Power Factor Correction Capacitor Banks Revenue (undefined), by Country 2025 & 2033
- Figure 7: North America Power Factor Correction Capacitor Banks Revenue Share (%), by Country 2025 & 2033
- Figure 8: South America Power Factor Correction Capacitor Banks Revenue (undefined), by Application 2025 & 2033
- Figure 9: South America Power Factor Correction Capacitor Banks Revenue Share (%), by Application 2025 & 2033
- Figure 10: South America Power Factor Correction Capacitor Banks Revenue (undefined), by Type 2025 & 2033
- Figure 11: South America Power Factor Correction Capacitor Banks Revenue Share (%), by Type 2025 & 2033
- Figure 12: South America Power Factor Correction Capacitor Banks Revenue (undefined), by Country 2025 & 2033
- Figure 13: South America Power Factor Correction Capacitor Banks Revenue Share (%), by Country 2025 & 2033
- Figure 14: Europe Power Factor Correction Capacitor Banks Revenue (undefined), by Application 2025 & 2033
- Figure 15: Europe Power Factor Correction Capacitor Banks Revenue Share (%), by Application 2025 & 2033
- Figure 16: Europe Power Factor Correction Capacitor Banks Revenue (undefined), by Type 2025 & 2033
- Figure 17: Europe Power Factor Correction Capacitor Banks Revenue Share (%), by Type 2025 & 2033
- Figure 18: Europe Power Factor Correction Capacitor Banks Revenue (undefined), by Country 2025 & 2033
- Figure 19: Europe Power Factor Correction Capacitor Banks Revenue Share (%), by Country 2025 & 2033
- Figure 20: Middle East & Africa Power Factor Correction Capacitor Banks Revenue (undefined), by Application 2025 & 2033
- Figure 21: Middle East & Africa Power Factor Correction Capacitor Banks Revenue Share (%), by Application 2025 & 2033
- Figure 22: Middle East & Africa Power Factor Correction Capacitor Banks Revenue (undefined), by Type 2025 & 2033
- Figure 23: Middle East & Africa Power Factor Correction Capacitor Banks Revenue Share (%), by Type 2025 & 2033
- Figure 24: Middle East & Africa Power Factor Correction Capacitor Banks Revenue (undefined), by Country 2025 & 2033
- Figure 25: Middle East & Africa Power Factor Correction Capacitor Banks Revenue Share (%), by Country 2025 & 2033
- Figure 26: Asia Pacific Power Factor Correction Capacitor Banks Revenue (undefined), by Application 2025 & 2033
- Figure 27: Asia Pacific Power Factor Correction Capacitor Banks Revenue Share (%), by Application 2025 & 2033
- Figure 28: Asia Pacific Power Factor Correction Capacitor Banks Revenue (undefined), by Type 2025 & 2033
- Figure 29: Asia Pacific Power Factor Correction Capacitor Banks Revenue Share (%), by Type 2025 & 2033
- Figure 30: Asia Pacific Power Factor Correction Capacitor Banks Revenue (undefined), by Country 2025 & 2033
- Figure 31: Asia Pacific Power Factor Correction Capacitor Banks Revenue Share (%), by Country 2025 & 2033
List of Tables
- Table 1: Global Power Factor Correction Capacitor Banks Revenue undefined Forecast, by Application 2020 & 2033
- Table 2: Global Power Factor Correction Capacitor Banks Revenue undefined Forecast, by Type 2020 & 2033
- Table 3: Global Power Factor Correction Capacitor Banks Revenue undefined Forecast, by Region 2020 & 2033
- Table 4: Global Power Factor Correction Capacitor Banks Revenue undefined Forecast, by Application 2020 & 2033
- Table 5: Global Power Factor Correction Capacitor Banks Revenue undefined Forecast, by Type 2020 & 2033
- Table 6: Global Power Factor Correction Capacitor Banks Revenue undefined Forecast, by Country 2020 & 2033
- Table 7: United States Power Factor Correction Capacitor Banks Revenue (undefined) Forecast, by Application 2020 & 2033
- Table 8: Canada Power Factor Correction Capacitor Banks Revenue (undefined) Forecast, by Application 2020 & 2033
- Table 9: Mexico Power Factor Correction Capacitor Banks Revenue (undefined) Forecast, by Application 2020 & 2033
- Table 10: Global Power Factor Correction Capacitor Banks Revenue undefined Forecast, by Application 2020 & 2033
- Table 11: Global Power Factor Correction Capacitor Banks Revenue undefined Forecast, by Type 2020 & 2033
- Table 12: Global Power Factor Correction Capacitor Banks Revenue undefined Forecast, by Country 2020 & 2033
- Table 13: Brazil Power Factor Correction Capacitor Banks Revenue (undefined) Forecast, by Application 2020 & 2033
- Table 14: Argentina Power Factor Correction Capacitor Banks Revenue (undefined) Forecast, by Application 2020 & 2033
- Table 15: Rest of South America Power Factor Correction Capacitor Banks Revenue (undefined) Forecast, by Application 2020 & 2033
- Table 16: Global Power Factor Correction Capacitor Banks Revenue undefined Forecast, by Application 2020 & 2033
- Table 17: Global Power Factor Correction Capacitor Banks Revenue undefined Forecast, by Type 2020 & 2033
- Table 18: Global Power Factor Correction Capacitor Banks Revenue undefined Forecast, by Country 2020 & 2033
- Table 19: United Kingdom Power Factor Correction Capacitor Banks Revenue (undefined) Forecast, by Application 2020 & 2033
- Table 20: Germany Power Factor Correction Capacitor Banks Revenue (undefined) Forecast, by Application 2020 & 2033
- Table 21: France Power Factor Correction Capacitor Banks Revenue (undefined) Forecast, by Application 2020 & 2033
- Table 22: Italy Power Factor Correction Capacitor Banks Revenue (undefined) Forecast, by Application 2020 & 2033
- Table 23: Spain Power Factor Correction Capacitor Banks Revenue (undefined) Forecast, by Application 2020 & 2033
- Table 24: Russia Power Factor Correction Capacitor Banks Revenue (undefined) Forecast, by Application 2020 & 2033
- Table 25: Benelux Power Factor Correction Capacitor Banks Revenue (undefined) Forecast, by Application 2020 & 2033
- Table 26: Nordics Power Factor Correction Capacitor Banks Revenue (undefined) Forecast, by Application 2020 & 2033
- Table 27: Rest of Europe Power Factor Correction Capacitor Banks Revenue (undefined) Forecast, by Application 2020 & 2033
- Table 28: Global Power Factor Correction Capacitor Banks Revenue undefined Forecast, by Application 2020 & 2033
- Table 29: Global Power Factor Correction Capacitor Banks Revenue undefined Forecast, by Type 2020 & 2033
- Table 30: Global Power Factor Correction Capacitor Banks Revenue undefined Forecast, by Country 2020 & 2033
- Table 31: Turkey Power Factor Correction Capacitor Banks Revenue (undefined) Forecast, by Application 2020 & 2033
- Table 32: Israel Power Factor Correction Capacitor Banks Revenue (undefined) Forecast, by Application 2020 & 2033
- Table 33: GCC Power Factor Correction Capacitor Banks Revenue (undefined) Forecast, by Application 2020 & 2033
- Table 34: North Africa Power Factor Correction Capacitor Banks Revenue (undefined) Forecast, by Application 2020 & 2033
- Table 35: South Africa Power Factor Correction Capacitor Banks Revenue (undefined) Forecast, by Application 2020 & 2033
- Table 36: Rest of Middle East & Africa Power Factor Correction Capacitor Banks Revenue (undefined) Forecast, by Application 2020 & 2033
- Table 37: Global Power Factor Correction Capacitor Banks Revenue undefined Forecast, by Application 2020 & 2033
- Table 38: Global Power Factor Correction Capacitor Banks Revenue undefined Forecast, by Type 2020 & 2033
- Table 39: Global Power Factor Correction Capacitor Banks Revenue undefined Forecast, by Country 2020 & 2033
- Table 40: China Power Factor Correction Capacitor Banks Revenue (undefined) Forecast, by Application 2020 & 2033
- Table 41: India Power Factor Correction Capacitor Banks Revenue (undefined) Forecast, by Application 2020 & 2033
- Table 42: Japan Power Factor Correction Capacitor Banks Revenue (undefined) Forecast, by Application 2020 & 2033
- Table 43: South Korea Power Factor Correction Capacitor Banks Revenue (undefined) Forecast, by Application 2020 & 2033
- Table 44: ASEAN Power Factor Correction Capacitor Banks Revenue (undefined) Forecast, by Application 2020 & 2033
- Table 45: Oceania Power Factor Correction Capacitor Banks Revenue (undefined) Forecast, by Application 2020 & 2033
- Table 46: Rest of Asia Pacific Power Factor Correction Capacitor Banks Revenue (undefined) Forecast, by Application 2020 & 2033
Frequently Asked Questions
1. What is the projected Compound Annual Growth Rate (CAGR) of the Power Factor Correction Capacitor Banks?
The projected CAGR is approximately 4%.
2. Which companies are prominent players in the Power Factor Correction Capacitor Banks?
Key companies in the market include ABB, Hitachi Energy, Schneider Electric, Vishay, Eaton, GE, Siemens Energy, Sieyuan, Chint Group, SAMWHA, SHIZUKI ELECTRIC, Arteche, Herong Electric, CIRCUTOR, Bree, Enerlux Power, Challenge Industrial Co., Ltd. (CIC).
3. What are the main segments of the Power Factor Correction Capacitor Banks?
The market segments include Application, Type.
4. Can you provide details about the market size?
The market size is estimated to be USD XXX N/A as of 2022.
5. What are some drivers contributing to market growth?
N/A
6. What are the notable trends driving market growth?
N/A
7. Are there any restraints impacting market growth?
N/A
8. Can you provide examples of recent developments in the market?
N/A
9. What pricing options are available for accessing the report?
Pricing options include single-user, multi-user, and enterprise licenses priced at USD 2900.00, USD 4350.00, and USD 5800.00 respectively.
10. Is the market size provided in terms of value or volume?
The market size is provided in terms of value, measured in N/A.
11. Are there any specific market keywords associated with the report?
Yes, the market keyword associated with the report is "Power Factor Correction Capacitor Banks," which aids in identifying and referencing the specific market segment covered.
12. How do I determine which pricing option suits my needs best?
The pricing options vary based on user requirements and access needs. Individual users may opt for single-user licenses, while businesses requiring broader access may choose multi-user or enterprise licenses for cost-effective access to the report.
13. Are there any additional resources or data provided in the Power Factor Correction Capacitor Banks report?
While the report offers comprehensive insights, it's advisable to review the specific contents or supplementary materials provided to ascertain if additional resources or data are available.
14. How can I stay updated on further developments or reports in the Power Factor Correction Capacitor Banks?
To stay informed about further developments, trends, and reports in the Power Factor Correction Capacitor Banks, consider subscribing to industry newsletters, following relevant companies and organizations, or regularly checking reputable industry news sources and publications.
Methodology
Step 1 - Identification of Relevant Samples Size from Population Database


Step 2 - Approaches for Defining Global Market Size (Value, Volume* & Price*)

Note*: In applicable scenarios
Step 3 - Data Sources
Primary Research
- Web Analytics
- Survey Reports
- Research Institute
- Latest Research Reports
- Opinion Leaders
Secondary Research
- Annual Reports
- White Paper
- Latest Press Release
- Industry Association
- Paid Database
- Investor Presentations

Step 4 - Data Triangulation
Involves using different sources of information in order to increase the validity of a study
These sources are likely to be stakeholders in a program - participants, other researchers, program staff, other community members, and so on.
Then we put all data in single framework & apply various statistical tools to find out the dynamic on the market.
During the analysis stage, feedback from the stakeholder groups would be compared to determine areas of agreement as well as areas of divergence