

Key Insights
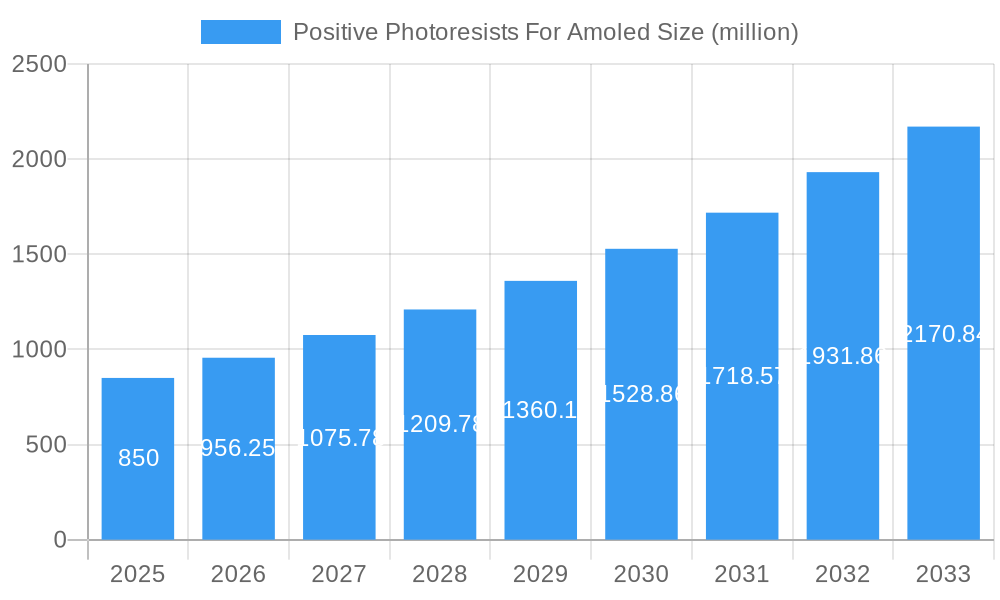
The global market for Positive Photoresists for AMOLED displays is poised for significant expansion, driven by the escalating demand for advanced display technologies in consumer electronics and automotive applications. Valued at an estimated $850 million in 2025, the market is projected to witness a robust Compound Annual Growth Rate (CAGR) of 12.5% over the forecast period of 2025-2033. This growth is primarily fueled by the superior performance characteristics of AMOLED displays, including enhanced color accuracy, deeper blacks, faster response times, and greater energy efficiency, which are increasingly sought after by consumers. The burgeoning adoption of AMOLED technology in smartphones, wearables, televisions, and automotive infotainment systems directly translates to a higher consumption of specialized positive photoresists crucial for the fabrication of these intricate circuits.
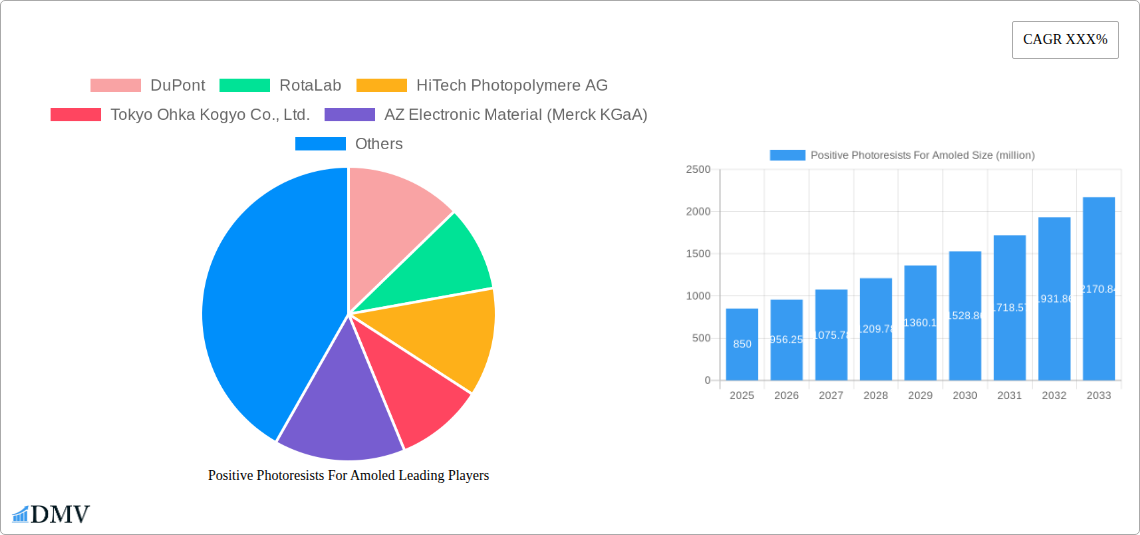
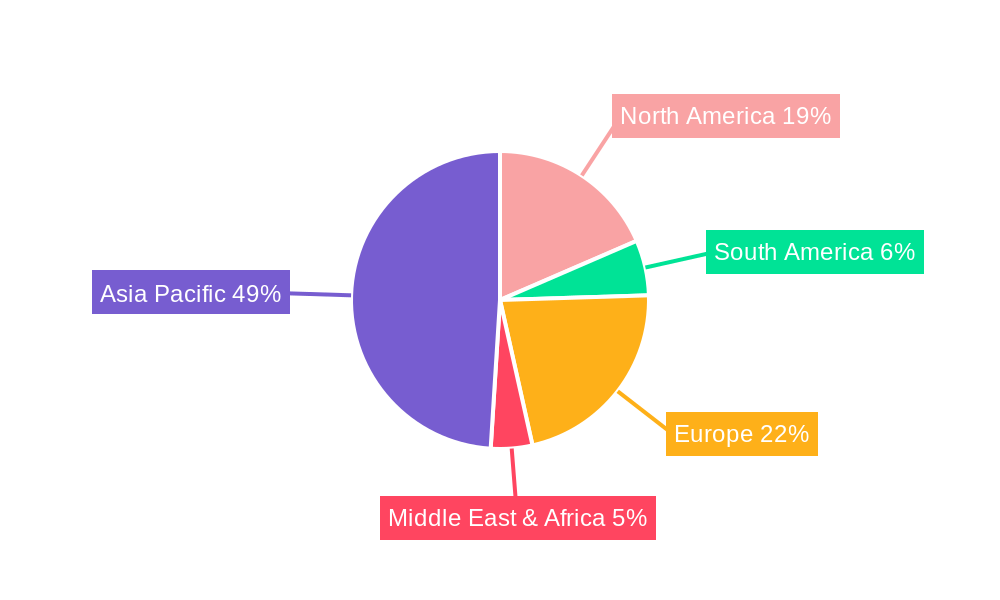
Positive Photoresists For Amoled Market Size (In Million)
The market's expansion is further propelled by ongoing innovations in photopolymerizing photoresist formulations, leading to improved resolution, sensitivity, and processing efficiency. These advancements are critical for enabling the production of smaller, higher-resolution AMOLED panels with more complex pixel structures. While the market enjoys strong growth drivers, certain restraints, such as the high cost of advanced photoresist materials and the complex manufacturing processes involved in AMOLED production, could pose challenges. However, the relentless pursuit of miniaturization and performance in electronic devices, coupled with increasing investments in display technology research and development, is expected to outweigh these limitations. Key application segments, including Electronics and Automotive, are anticipated to dominate market demand, while the Type segment is expected to see strong traction for advanced photopolymerizing photoresists designed for high-resolution patterning. Geographically, the Asia Pacific region, led by China and South Korea, is expected to maintain its leadership position due to its robust manufacturing infrastructure and significant contribution to global AMOLED panel production.
Positive Photoresists For Amoled Company Market Share
This in-depth market research report delivers a strategic analysis of the positive photoresists for AMOLED market, a critical component in the manufacturing of advanced display technologies. Covering the historical period from 2019 to 2024, the base year of 2025, and extending through a robust forecast period to 2033, this report provides unparalleled insights into market dynamics, technological advancements, and future growth trajectories. Stakeholders will gain a comprehensive understanding of the competitive landscape, key drivers, emerging opportunities, and potential challenges shaping this rapidly evolving sector.
Positive Photoresists For Amoled Market Composition & Trends
The positive photoresists for AMOLED market exhibits a moderate to high concentration, with a few key players dominating market share. Innovation catalysts are primarily driven by the relentless demand for higher resolution, greater energy efficiency, and enhanced durability in AMOLED displays across various applications. The regulatory landscape, while not overtly restrictive, emphasizes environmental sustainability and worker safety, influencing the formulation and adoption of new photoresist technologies. Substitute products, though present in nascent forms, are yet to pose a significant threat to the established positive photoresist for AMOLED solutions. End-user profiles are diverse, ranging from consumer electronics giants to automotive manufacturers and telecommunication firms, each with distinct performance requirements. Mergers and acquisitions (M&A) activities are expected to remain strategic, focusing on synergistic technologies and expanding geographical reach. For instance, key players like DuPont and DOW have historically engaged in strategic partnerships to bolster their product portfolios. The market share distribution is influenced by technological leadership and supply chain integration, with estimated combined M&A deal values projected to reach several hundred million dollars over the forecast period.
- Market Concentration: Moderate to High, driven by technological expertise and manufacturing scale.
- Innovation Drivers: Demand for higher resolution, improved efficiency, and enhanced device longevity.
- Regulatory Influence: Focus on environmental compliance and worker safety in chemical manufacturing.
- Substitute Products: Emerging alternative lithography techniques are under development but not yet market-ready for large-scale AMOLED production.
- End-User Segments:
- Consumer Electronics (smartphones, wearables, TVs)
- Automotive Displays (infotainment, dashboards)
- Communication Devices (tablets, foldable phones)
- Other Emerging Applications
- M&A Landscape: Strategic consolidations to acquire intellectual property and market access, with projected deal values in the hundreds of millions.
Positive Photoresists For Amoled Industry Evolution
The positive photoresist for AMOLED industry has witnessed significant evolution, driven by the exponential growth of AMOLED display technology. From 2019 to 2024, the market experienced a steady upward trajectory, fueled by increasing consumer adoption of devices featuring these advanced displays. The base year, 2025, marks a pivotal point where further technological advancements are expected to accelerate growth. The forecast period (2025–2033) is poised for substantial expansion, with projected compound annual growth rates (CAGRs) in the high single digits, potentially exceeding 7%. This growth is underpinned by the continuous miniaturization of electronic components, the demand for flexible and foldable displays, and the increasing integration of AMOLED screens in automotive and industrial applications.
Technological advancements have been a cornerstone of this evolution. The development of photopolymerizing photoresists has enabled higher resolution patterning, crucial for intricate AMOLED pixel structures. Similarly, innovations in photodegradable photoresists are addressing environmental concerns by offering more sustainable manufacturing processes. The shift towards advanced lithography techniques, including immersion lithography and extreme ultraviolet (EUV) lithography, has necessitated the development of photoresists with enhanced sensitivity and resolution capabilities. Consumer demand has also played a pivotal role, with a growing preference for immersive visual experiences, brighter displays, and energy-efficient devices, all of which are hallmarks of AMOLED technology. The adoption metrics for AMOLED displays in smartphones have already surpassed 80%, and significant growth is anticipated in the wearable and automotive sectors, further stimulating the demand for specialized photoresists. The historical period (2019–2024) saw an average market growth of approximately 5% annually, with estimations for the estimated year (2025) to maintain this robust pace. Over the forecast period, this growth is projected to escalate as new applications mature and existing ones expand.
Leading Regions, Countries, or Segments in Positive Photoresists For Amoled
The positive photoresists for AMOLED market is currently dominated by the Electronics application segment, primarily driven by the insatiable global demand for smartphones, tablets, and televisions. Within this segment, the Asia-Pacific region, particularly countries like South Korea, Taiwan, and China, stands as the undisputed leader. This dominance is a direct consequence of the region's robust manufacturing infrastructure for display panels, significant investments in research and development (R&D) by major display manufacturers, and a vast consumer base driving demand for electronic devices.
The Type: Photopolymerizing Photoresist segment holds the largest market share due to its established reliability, versatility, and proven performance in achieving the fine feature sizes required for AMOLED pixel patterning. Investment trends in this region are characterized by substantial capital expenditure in advanced manufacturing facilities and a continuous pursuit of next-generation display technologies. Regulatory support, while primarily focused on environmental standards, indirectly favors regions that can adapt and innovate within these frameworks.
Dominant Application Segment: Electronics
- Drivers:
- Massive consumer demand for smartphones and TVs.
- Technological leadership of display manufacturers in South Korea and Taiwan.
- Growing adoption of AMOLED in wearable devices.
- Analysis: The "Electronics" segment's dominance is a direct reflection of the AMOLED industry's core market. The continuous innovation in smartphone designs, from foldable screens to higher refresh rates, directly translates into a demand for sophisticated positive photoresists for AMOLED.
- Drivers:
Dominant Segment Type: Photopolymerizing Photoresist
- Drivers:
- Established performance and reliability for high-resolution patterning.
- Versatility in addressing various manufacturing processes.
- Ongoing R&D leading to incremental improvements in sensitivity and resolution.
- Analysis: Photopolymerizing photoresists are the workhorse of AMOLED manufacturing. Their ability to precisely define sub-micron features is critical for the intricate pixel structures of AMOLED displays. While photodegradable photoresists offer environmental benefits, their widespread adoption for high-volume AMOLED production is still in earlier stages compared to their photopolymerizing counterparts.
- Drivers:
Leading Region: Asia-Pacific
- Drivers:
- Presence of global AMOLED panel manufacturing giants (e.g., Samsung Display, LG Display, BOE).
- Government incentives for high-tech manufacturing and R&D.
- Proximity to a large and growing consumer market for electronics.
- Analysis: The concentration of display manufacturing capabilities in Asia-Pacific, coupled with strong governmental support for the semiconductor and display industries, creates a self-reinforcing ecosystem for positive photoresists for AMOLED. Companies like Tokyo Ohka Kogyo Co., Ltd. and AZ Electronic Material (Merck KGaA) have a significant presence and influence in this region.
- Drivers:
Positive Photoresists For Amoled Product Innovations
Recent product innovations in positive photoresists for AMOLED focus on enhancing resolution, improving lithographic latitude, and achieving higher sensitivity to reduce exposure times and energy consumption. Companies are developing advanced formulations that enable finer feature definition, crucial for next-generation displays with higher pixel densities. Novel resist chemistries are being introduced to improve etch resistance and developability, leading to higher yields and reduced defect rates. Performance metrics like contrast ratio, line edge roughness, and process window are continuously being optimized. For example, advancements in photopolymerizing photoresists now allow for resolutions below 10 micrometers, a significant leap for intricate AMOLED designs.
Propelling Factors for Positive Photoresists For Amoled Growth
The growth of the positive photoresists for AMOLED market is propelled by several key factors. Firstly, the relentless demand for higher resolution and more vibrant displays in consumer electronics, particularly smartphones and televisions, is a primary driver. Secondly, the expanding application of AMOLED technology in the automotive sector, for advanced dashboard and infotainment systems, is creating new avenues for growth. Thirdly, technological advancements in lithography, enabling finer feature patterning, necessitate the development of more sophisticated photoresists. Finally, supportive government initiatives in key manufacturing regions, aimed at fostering high-tech industries, further contribute to the market's expansion. For instance, RotaLab's ongoing research into next-generation photoresist materials is a testament to this innovation-driven growth.
Obstacles in the Positive Photoresists For Amoled Market
Despite its robust growth, the positive photoresists for AMOLED market faces several obstacles. Stringent environmental regulations regarding the use and disposal of chemical materials can increase manufacturing costs and necessitate significant investment in greener alternatives. Supply chain disruptions, as witnessed in recent global events, can impact the availability of critical raw materials and intermediate chemicals, leading to price volatility. Intense competition among established players and emerging entrants, coupled with the high cost of R&D, can also pose a challenge. Furthermore, the rapid pace of technological change requires continuous innovation, which can be resource-intensive and carries inherent risks.
Future Opportunities in Positive Photoresists For Amoled
Emerging opportunities in the positive photoresists for AMOLED market are abundant. The burgeoning demand for flexible and foldable displays presents a significant growth area, requiring photoresists with enhanced mechanical properties and adhesion. The increasing adoption of AMOLED in automotive, aerospace, and medical devices opens up niche markets with unique performance requirements. Advancements in additive manufacturing and 3D printing technologies could also create new applications for specialized photoresists. Furthermore, the development of bio-based or sustainable photoresists presents a long-term opportunity aligned with global environmental concerns. The exploration of novel resist chemistries by companies like HiTech Photopolymere AG is indicative of this future-oriented approach.
Major Players in the Positive Photoresists For Amoled Ecosystem
- DuPont
- RotaLab
- HiTech Photopolymere AG
- Tokyo Ohka Kogyo Co., Ltd.
- AZ Electronic Material (Merck KGaA)
- DOW
- RED AVENUE
- SIN YANG
- HMT
- Demt
- BAE
Key Developments in Positive Photoresists For Amoled Industry
- 2023: DuPont launched a new line of high-resolution positive photoresists for AMOLED targeting advanced display manufacturing, significantly improving throughput.
- 2023: RotaLab announced a breakthrough in the development of environmentally friendly photodegradable photoresists with enhanced performance for AMOLED applications.
- 2022: Tokyo Ohka Kogyo Co., Ltd. expanded its manufacturing capacity for specialized photoresists, anticipating increased demand from the booming smartphone market.
- 2022: AZ Electronic Material (Merck KGaA) introduced an innovative photopolymerizing photoresist offering superior etch resistance and process latitude for AMOLED production.
- 2021: DOW showcased its commitment to sustainable material solutions with the unveiling of new photoresist formulations designed for reduced environmental impact.
- 2020: RED AVENUE secured strategic funding to accelerate R&D efforts in developing ultra-high-resolution photoresists for next-generation displays.
- 2019: HMT acquired a smaller competitor, strengthening its position in the European positive photoresist for AMOLED market.
Strategic Positive Photoresists For Amoled Market Forecast
The strategic forecast for the positive photoresists for AMOLED market projects sustained and accelerated growth. Key growth catalysts include the increasing penetration of AMOLED displays in emerging applications like automotive and augmented reality (AR)/virtual reality (VR) devices, alongside the continuous evolution of smartphone technology. Further advancements in photopolymerizing photoresists and the gradual adoption of more sustainable photodegradable photoresists will shape market dynamics. The market potential is further enhanced by ongoing R&D efforts by leading companies such as DuPont and DOW, focusing on enhanced resolution, sensitivity, and environmental compatibility. The strategic importance of these materials in enabling cutting-edge display technologies ensures a positive outlook for the market.
Positive Photoresists For Amoled Segmentation
-
1. Application
- 1.1. Electronics
- 1.2. Automotive
- 1.3. Communication
- 1.4. Others
-
2. Type
- 2.1. Photopolymerizing Photoresist
- 2.2. Photodegradable Photoresist
Positive Photoresists For Amoled Segmentation By Geography
-
1. North America
- 1.1. United States
- 1.2. Canada
- 1.3. Mexico
-
2. South America
- 2.1. Brazil
- 2.2. Argentina
- 2.3. Rest of South America
-
3. Europe
- 3.1. United Kingdom
- 3.2. Germany
- 3.3. France
- 3.4. Italy
- 3.5. Spain
- 3.6. Russia
- 3.7. Benelux
- 3.8. Nordics
- 3.9. Rest of Europe
-
4. Middle East & Africa
- 4.1. Turkey
- 4.2. Israel
- 4.3. GCC
- 4.4. North Africa
- 4.5. South Africa
- 4.6. Rest of Middle East & Africa
-
5. Asia Pacific
- 5.1. China
- 5.2. India
- 5.3. Japan
- 5.4. South Korea
- 5.5. ASEAN
- 5.6. Oceania
- 5.7. Rest of Asia Pacific
Positive Photoresists For Amoled Regional Market Share
Geographic Coverage of Positive Photoresists For Amoled
Positive Photoresists For Amoled REPORT HIGHLIGHTS
| Aspects | Details |
|---|---|
| Study Period | 2020-2034 |
| Base Year | 2025 |
| Estimated Year | 2026 |
| Forecast Period | 2026-2034 |
| Historical Period | 2020-2025 |
| Growth Rate | CAGR of XXX% from 2020-2034 |
| Segmentation |
|
Table of Contents
- 1. Introduction
- 1.1. Research Scope
- 1.2. Market Segmentation
- 1.3. Research Objective
- 1.4. Definitions and Assumptions
- 2. Executive Summary
- 2.1. Market Snapshot
- 3. Market Dynamics
- 3.1. Market Drivers
- 3.2. Market Restrains
- 3.3. Market Trends
- 3.4. Market Opportunities
- 4. Market Factor Analysis
- 4.1. Porters Five Forces
- 4.1.1. Bargaining Power of Suppliers
- 4.1.2. Bargaining Power of Buyers
- 4.1.3. Threat of New Entrants
- 4.1.4. Threat of Substitutes
- 4.1.5. Competitive Rivalry
- 4.2. PESTEL analysis
- 4.3. BCG Analysis
- 4.3.1. Stars (High Growth, High Market Share)
- 4.3.2. Cash Cows (Low Growth, High Market Share)
- 4.3.3. Question Mark (High Growth, Low Market Share)
- 4.3.4. Dogs (Low Growth, Low Market Share)
- 4.4. Ansoff Matrix Analysis
- 4.5. Supply Chain Analysis
- 4.6. Regulatory Landscape
- 4.7. Current Market Potential and Opportunity Assessment (TAM–SAM–SOM Framework)
- 4.8. DMV Analyst Note
- 4.1. Porters Five Forces
- 5. Market Analysis, Insights and Forecast 2021-2033
- 5.1. Market Analysis, Insights and Forecast - by Application
- 5.1.1. Electronics
- 5.1.2. Automotive
- 5.1.3. Communication
- 5.1.4. Others
- 5.2. Market Analysis, Insights and Forecast - by Type
- 5.2.1. Photopolymerizing Photoresist
- 5.2.2. Photodegradable Photoresist
- 5.3. Market Analysis, Insights and Forecast - by Region
- 5.3.1. North America
- 5.3.2. South America
- 5.3.3. Europe
- 5.3.4. Middle East & Africa
- 5.3.5. Asia Pacific
- 5.1. Market Analysis, Insights and Forecast - by Application
- 6. Global Positive Photoresists For Amoled Analysis, Insights and Forecast, 2021-2033
- 6.1. Market Analysis, Insights and Forecast - by Application
- 6.1.1. Electronics
- 6.1.2. Automotive
- 6.1.3. Communication
- 6.1.4. Others
- 6.2. Market Analysis, Insights and Forecast - by Type
- 6.2.1. Photopolymerizing Photoresist
- 6.2.2. Photodegradable Photoresist
- 6.1. Market Analysis, Insights and Forecast - by Application
- 7. North America Positive Photoresists For Amoled Analysis, Insights and Forecast, 2020-2032
- 7.1. Market Analysis, Insights and Forecast - by Application
- 7.1.1. Electronics
- 7.1.2. Automotive
- 7.1.3. Communication
- 7.1.4. Others
- 7.2. Market Analysis, Insights and Forecast - by Type
- 7.2.1. Photopolymerizing Photoresist
- 7.2.2. Photodegradable Photoresist
- 7.1. Market Analysis, Insights and Forecast - by Application
- 8. South America Positive Photoresists For Amoled Analysis, Insights and Forecast, 2020-2032
- 8.1. Market Analysis, Insights and Forecast - by Application
- 8.1.1. Electronics
- 8.1.2. Automotive
- 8.1.3. Communication
- 8.1.4. Others
- 8.2. Market Analysis, Insights and Forecast - by Type
- 8.2.1. Photopolymerizing Photoresist
- 8.2.2. Photodegradable Photoresist
- 8.1. Market Analysis, Insights and Forecast - by Application
- 9. Europe Positive Photoresists For Amoled Analysis, Insights and Forecast, 2020-2032
- 9.1. Market Analysis, Insights and Forecast - by Application
- 9.1.1. Electronics
- 9.1.2. Automotive
- 9.1.3. Communication
- 9.1.4. Others
- 9.2. Market Analysis, Insights and Forecast - by Type
- 9.2.1. Photopolymerizing Photoresist
- 9.2.2. Photodegradable Photoresist
- 9.1. Market Analysis, Insights and Forecast - by Application
- 10. Middle East & Africa Positive Photoresists For Amoled Analysis, Insights and Forecast, 2020-2032
- 10.1. Market Analysis, Insights and Forecast - by Application
- 10.1.1. Electronics
- 10.1.2. Automotive
- 10.1.3. Communication
- 10.1.4. Others
- 10.2. Market Analysis, Insights and Forecast - by Type
- 10.2.1. Photopolymerizing Photoresist
- 10.2.2. Photodegradable Photoresist
- 10.1. Market Analysis, Insights and Forecast - by Application
- 11. Asia Pacific Positive Photoresists For Amoled Analysis, Insights and Forecast, 2020-2032
- 11.1. Market Analysis, Insights and Forecast - by Application
- 11.1.1. Electronics
- 11.1.2. Automotive
- 11.1.3. Communication
- 11.1.4. Others
- 11.2. Market Analysis, Insights and Forecast - by Type
- 11.2.1. Photopolymerizing Photoresist
- 11.2.2. Photodegradable Photoresist
- 11.1. Market Analysis, Insights and Forecast - by Application
- 12. Competitive Analysis
- 12.1. Company Profiles
- 12.1.1 DuPont
- 12.1.1.1. Company Overview
- 12.1.1.2. Products
- 12.1.1.3. Company Financials
- 12.1.1.4. SWOT Analysis
- 12.1.2 RotaLab
- 12.1.2.1. Company Overview
- 12.1.2.2. Products
- 12.1.2.3. Company Financials
- 12.1.2.4. SWOT Analysis
- 12.1.3 HiTech Photopolymere AG
- 12.1.3.1. Company Overview
- 12.1.3.2. Products
- 12.1.3.3. Company Financials
- 12.1.3.4. SWOT Analysis
- 12.1.4 Tokyo Ohka Kogyo Co. Ltd.
- 12.1.4.1. Company Overview
- 12.1.4.2. Products
- 12.1.4.3. Company Financials
- 12.1.4.4. SWOT Analysis
- 12.1.5 AZ Electronic Material (Merck KGaA)
- 12.1.5.1. Company Overview
- 12.1.5.2. Products
- 12.1.5.3. Company Financials
- 12.1.5.4. SWOT Analysis
- 12.1.6 DOW
- 12.1.6.1. Company Overview
- 12.1.6.2. Products
- 12.1.6.3. Company Financials
- 12.1.6.4. SWOT Analysis
- 12.1.7 RED AVENUE
- 12.1.7.1. Company Overview
- 12.1.7.2. Products
- 12.1.7.3. Company Financials
- 12.1.7.4. SWOT Analysis
- 12.1.8 SIN YANG
- 12.1.8.1. Company Overview
- 12.1.8.2. Products
- 12.1.8.3. Company Financials
- 12.1.8.4. SWOT Analysis
- 12.1.9 HMT
- 12.1.9.1. Company Overview
- 12.1.9.2. Products
- 12.1.9.3. Company Financials
- 12.1.9.4. SWOT Analysis
- 12.1.10 Demt
- 12.1.10.1. Company Overview
- 12.1.10.2. Products
- 12.1.10.3. Company Financials
- 12.1.10.4. SWOT Analysis
- 12.1.11 BAE
- 12.1.11.1. Company Overview
- 12.1.11.2. Products
- 12.1.11.3. Company Financials
- 12.1.11.4. SWOT Analysis
- 12.1.1 DuPont
- 12.2. Market Entropy
- 12.2.1 Company's Key Areas Served
- 12.2.2 Recent Developments
- 12.3. Company Market Share Analysis 2025
- 12.3.1 Top 5 Companies Market Share Analysis
- 12.3.2 Top 3 Companies Market Share Analysis
- 12.4. List of Potential Customers
- 13. Research Methodology
List of Figures
- Figure 1: Global Positive Photoresists For Amoled Revenue Breakdown (million, %) by Region 2025 & 2033
- Figure 2: North America Positive Photoresists For Amoled Revenue (million), by Application 2025 & 2033
- Figure 3: North America Positive Photoresists For Amoled Revenue Share (%), by Application 2025 & 2033
- Figure 4: North America Positive Photoresists For Amoled Revenue (million), by Type 2025 & 2033
- Figure 5: North America Positive Photoresists For Amoled Revenue Share (%), by Type 2025 & 2033
- Figure 6: North America Positive Photoresists For Amoled Revenue (million), by Country 2025 & 2033
- Figure 7: North America Positive Photoresists For Amoled Revenue Share (%), by Country 2025 & 2033
- Figure 8: South America Positive Photoresists For Amoled Revenue (million), by Application 2025 & 2033
- Figure 9: South America Positive Photoresists For Amoled Revenue Share (%), by Application 2025 & 2033
- Figure 10: South America Positive Photoresists For Amoled Revenue (million), by Type 2025 & 2033
- Figure 11: South America Positive Photoresists For Amoled Revenue Share (%), by Type 2025 & 2033
- Figure 12: South America Positive Photoresists For Amoled Revenue (million), by Country 2025 & 2033
- Figure 13: South America Positive Photoresists For Amoled Revenue Share (%), by Country 2025 & 2033
- Figure 14: Europe Positive Photoresists For Amoled Revenue (million), by Application 2025 & 2033
- Figure 15: Europe Positive Photoresists For Amoled Revenue Share (%), by Application 2025 & 2033
- Figure 16: Europe Positive Photoresists For Amoled Revenue (million), by Type 2025 & 2033
- Figure 17: Europe Positive Photoresists For Amoled Revenue Share (%), by Type 2025 & 2033
- Figure 18: Europe Positive Photoresists For Amoled Revenue (million), by Country 2025 & 2033
- Figure 19: Europe Positive Photoresists For Amoled Revenue Share (%), by Country 2025 & 2033
- Figure 20: Middle East & Africa Positive Photoresists For Amoled Revenue (million), by Application 2025 & 2033
- Figure 21: Middle East & Africa Positive Photoresists For Amoled Revenue Share (%), by Application 2025 & 2033
- Figure 22: Middle East & Africa Positive Photoresists For Amoled Revenue (million), by Type 2025 & 2033
- Figure 23: Middle East & Africa Positive Photoresists For Amoled Revenue Share (%), by Type 2025 & 2033
- Figure 24: Middle East & Africa Positive Photoresists For Amoled Revenue (million), by Country 2025 & 2033
- Figure 25: Middle East & Africa Positive Photoresists For Amoled Revenue Share (%), by Country 2025 & 2033
- Figure 26: Asia Pacific Positive Photoresists For Amoled Revenue (million), by Application 2025 & 2033
- Figure 27: Asia Pacific Positive Photoresists For Amoled Revenue Share (%), by Application 2025 & 2033
- Figure 28: Asia Pacific Positive Photoresists For Amoled Revenue (million), by Type 2025 & 2033
- Figure 29: Asia Pacific Positive Photoresists For Amoled Revenue Share (%), by Type 2025 & 2033
- Figure 30: Asia Pacific Positive Photoresists For Amoled Revenue (million), by Country 2025 & 2033
- Figure 31: Asia Pacific Positive Photoresists For Amoled Revenue Share (%), by Country 2025 & 2033
List of Tables
- Table 1: Global Positive Photoresists For Amoled Revenue million Forecast, by Application 2020 & 2033
- Table 2: Global Positive Photoresists For Amoled Revenue million Forecast, by Type 2020 & 2033
- Table 3: Global Positive Photoresists For Amoled Revenue million Forecast, by Region 2020 & 2033
- Table 4: Global Positive Photoresists For Amoled Revenue million Forecast, by Application 2020 & 2033
- Table 5: Global Positive Photoresists For Amoled Revenue million Forecast, by Type 2020 & 2033
- Table 6: Global Positive Photoresists For Amoled Revenue million Forecast, by Country 2020 & 2033
- Table 7: United States Positive Photoresists For Amoled Revenue (million) Forecast, by Application 2020 & 2033
- Table 8: Canada Positive Photoresists For Amoled Revenue (million) Forecast, by Application 2020 & 2033
- Table 9: Mexico Positive Photoresists For Amoled Revenue (million) Forecast, by Application 2020 & 2033
- Table 10: Global Positive Photoresists For Amoled Revenue million Forecast, by Application 2020 & 2033
- Table 11: Global Positive Photoresists For Amoled Revenue million Forecast, by Type 2020 & 2033
- Table 12: Global Positive Photoresists For Amoled Revenue million Forecast, by Country 2020 & 2033
- Table 13: Brazil Positive Photoresists For Amoled Revenue (million) Forecast, by Application 2020 & 2033
- Table 14: Argentina Positive Photoresists For Amoled Revenue (million) Forecast, by Application 2020 & 2033
- Table 15: Rest of South America Positive Photoresists For Amoled Revenue (million) Forecast, by Application 2020 & 2033
- Table 16: Global Positive Photoresists For Amoled Revenue million Forecast, by Application 2020 & 2033
- Table 17: Global Positive Photoresists For Amoled Revenue million Forecast, by Type 2020 & 2033
- Table 18: Global Positive Photoresists For Amoled Revenue million Forecast, by Country 2020 & 2033
- Table 19: United Kingdom Positive Photoresists For Amoled Revenue (million) Forecast, by Application 2020 & 2033
- Table 20: Germany Positive Photoresists For Amoled Revenue (million) Forecast, by Application 2020 & 2033
- Table 21: France Positive Photoresists For Amoled Revenue (million) Forecast, by Application 2020 & 2033
- Table 22: Italy Positive Photoresists For Amoled Revenue (million) Forecast, by Application 2020 & 2033
- Table 23: Spain Positive Photoresists For Amoled Revenue (million) Forecast, by Application 2020 & 2033
- Table 24: Russia Positive Photoresists For Amoled Revenue (million) Forecast, by Application 2020 & 2033
- Table 25: Benelux Positive Photoresists For Amoled Revenue (million) Forecast, by Application 2020 & 2033
- Table 26: Nordics Positive Photoresists For Amoled Revenue (million) Forecast, by Application 2020 & 2033
- Table 27: Rest of Europe Positive Photoresists For Amoled Revenue (million) Forecast, by Application 2020 & 2033
- Table 28: Global Positive Photoresists For Amoled Revenue million Forecast, by Application 2020 & 2033
- Table 29: Global Positive Photoresists For Amoled Revenue million Forecast, by Type 2020 & 2033
- Table 30: Global Positive Photoresists For Amoled Revenue million Forecast, by Country 2020 & 2033
- Table 31: Turkey Positive Photoresists For Amoled Revenue (million) Forecast, by Application 2020 & 2033
- Table 32: Israel Positive Photoresists For Amoled Revenue (million) Forecast, by Application 2020 & 2033
- Table 33: GCC Positive Photoresists For Amoled Revenue (million) Forecast, by Application 2020 & 2033
- Table 34: North Africa Positive Photoresists For Amoled Revenue (million) Forecast, by Application 2020 & 2033
- Table 35: South Africa Positive Photoresists For Amoled Revenue (million) Forecast, by Application 2020 & 2033
- Table 36: Rest of Middle East & Africa Positive Photoresists For Amoled Revenue (million) Forecast, by Application 2020 & 2033
- Table 37: Global Positive Photoresists For Amoled Revenue million Forecast, by Application 2020 & 2033
- Table 38: Global Positive Photoresists For Amoled Revenue million Forecast, by Type 2020 & 2033
- Table 39: Global Positive Photoresists For Amoled Revenue million Forecast, by Country 2020 & 2033
- Table 40: China Positive Photoresists For Amoled Revenue (million) Forecast, by Application 2020 & 2033
- Table 41: India Positive Photoresists For Amoled Revenue (million) Forecast, by Application 2020 & 2033
- Table 42: Japan Positive Photoresists For Amoled Revenue (million) Forecast, by Application 2020 & 2033
- Table 43: South Korea Positive Photoresists For Amoled Revenue (million) Forecast, by Application 2020 & 2033
- Table 44: ASEAN Positive Photoresists For Amoled Revenue (million) Forecast, by Application 2020 & 2033
- Table 45: Oceania Positive Photoresists For Amoled Revenue (million) Forecast, by Application 2020 & 2033
- Table 46: Rest of Asia Pacific Positive Photoresists For Amoled Revenue (million) Forecast, by Application 2020 & 2033
Frequently Asked Questions
1. What is the projected Compound Annual Growth Rate (CAGR) of the Positive Photoresists For Amoled?
The projected CAGR is approximately XXX%.
2. Which companies are prominent players in the Positive Photoresists For Amoled?
Key companies in the market include DuPont, RotaLab, HiTech Photopolymere AG, Tokyo Ohka Kogyo Co., Ltd., AZ Electronic Material (Merck KGaA), DOW, RED AVENUE, SIN YANG, HMT, Demt, BAE.
3. What are the main segments of the Positive Photoresists For Amoled?
The market segments include Application, Type.
4. Can you provide details about the market size?
The market size is estimated to be USD XXX million as of 2022.
5. What are some drivers contributing to market growth?
N/A
6. What are the notable trends driving market growth?
N/A
7. Are there any restraints impacting market growth?
N/A
8. Can you provide examples of recent developments in the market?
N/A
9. What pricing options are available for accessing the report?
Pricing options include single-user, multi-user, and enterprise licenses priced at USD 2900.00, USD 4350.00, and USD 5800.00 respectively.
10. Is the market size provided in terms of value or volume?
The market size is provided in terms of value, measured in million.
11. Are there any specific market keywords associated with the report?
Yes, the market keyword associated with the report is "Positive Photoresists For Amoled," which aids in identifying and referencing the specific market segment covered.
12. How do I determine which pricing option suits my needs best?
The pricing options vary based on user requirements and access needs. Individual users may opt for single-user licenses, while businesses requiring broader access may choose multi-user or enterprise licenses for cost-effective access to the report.
13. Are there any additional resources or data provided in the Positive Photoresists For Amoled report?
While the report offers comprehensive insights, it's advisable to review the specific contents or supplementary materials provided to ascertain if additional resources or data are available.
14. How can I stay updated on further developments or reports in the Positive Photoresists For Amoled?
To stay informed about further developments, trends, and reports in the Positive Photoresists For Amoled, consider subscribing to industry newsletters, following relevant companies and organizations, or regularly checking reputable industry news sources and publications.
Methodology
Step 1 - Identification of Relevant Samples Size from Population Database


Step 2 - Approaches for Defining Global Market Size (Value, Volume* & Price*)

Note*: In applicable scenarios
Step 3 - Data Sources
Primary Research
- Web Analytics
- Survey Reports
- Research Institute
- Latest Research Reports
- Opinion Leaders
Secondary Research
- Annual Reports
- White Paper
- Latest Press Release
- Industry Association
- Paid Database
- Investor Presentations

Step 4 - Data Triangulation
Involves using different sources of information in order to increase the validity of a study
These sources are likely to be stakeholders in a program - participants, other researchers, program staff, other community members, and so on.
Then we put all data in single framework & apply various statistical tools to find out the dynamic on the market.
During the analysis stage, feedback from the stakeholder groups would be compared to determine areas of agreement as well as areas of divergence