

Key Insights
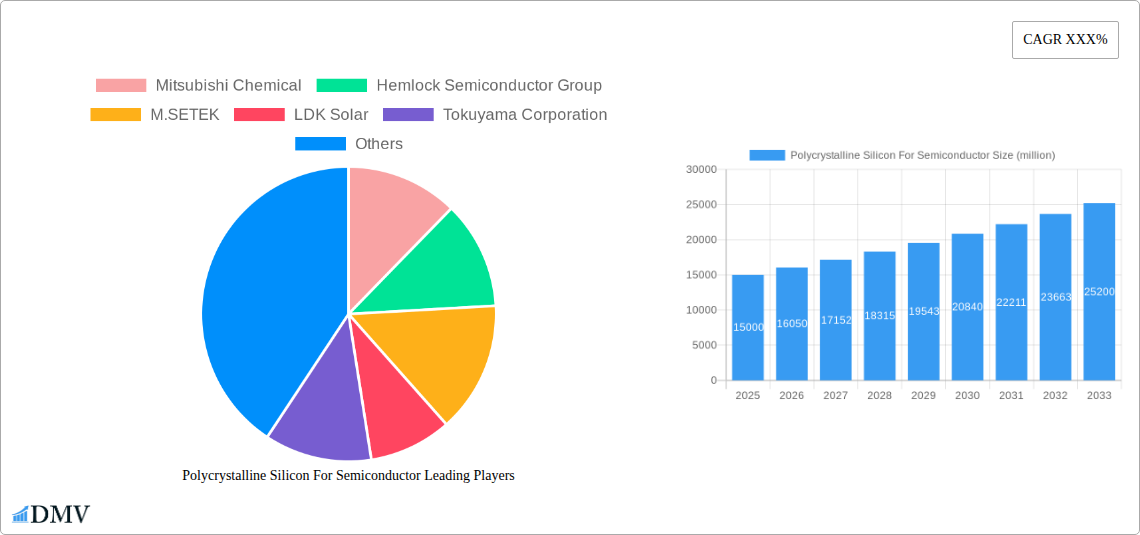
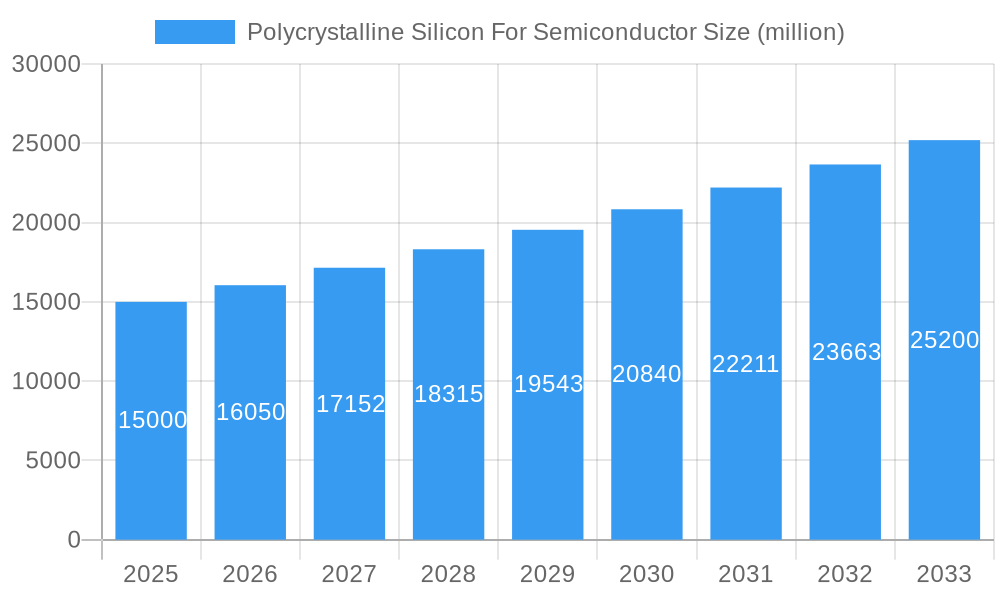
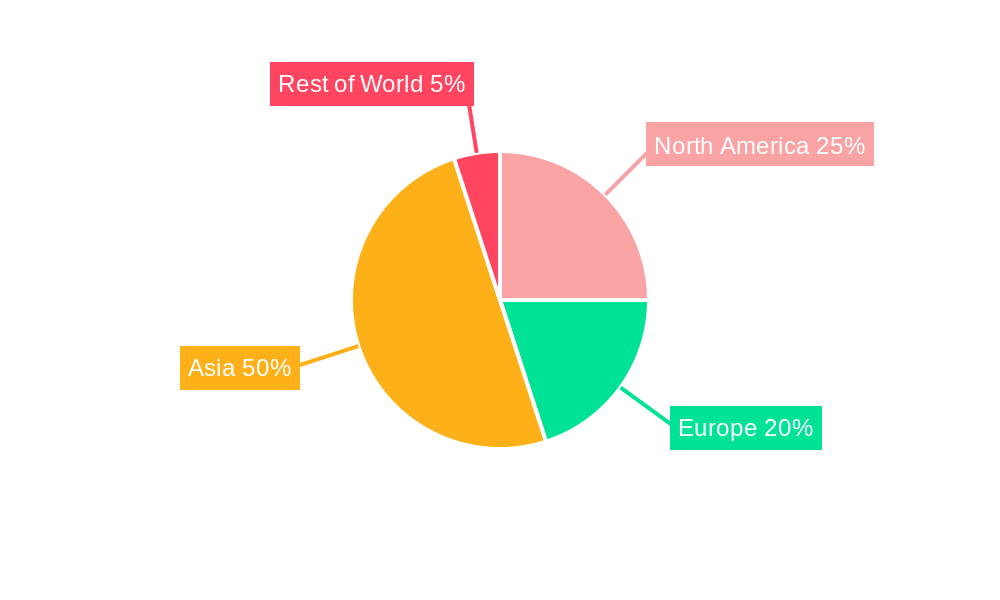
The polycrystalline silicon (polysilicon) market for semiconductors is experiencing robust growth, driven primarily by the burgeoning demand for electronic devices and renewable energy technologies. The market, estimated at $15 billion in 2025, is projected to exhibit a Compound Annual Growth Rate (CAGR) of 7% from 2025 to 2033, reaching an estimated $25 billion by 2033. This expansion is fueled by several key factors. The increasing adoption of high-power electronics in electric vehicles, 5G infrastructure, and industrial automation necessitates large quantities of high-purity polysilicon. Furthermore, the renewable energy sector, particularly solar power, is a significant driver, as polysilicon forms the bedrock of solar cells. Technological advancements in polysilicon production, such as improved efficiency and reduced energy consumption in the manufacturing process, are further contributing to market growth. However, challenges remain. Price volatility of raw materials, geopolitical uncertainties impacting supply chains, and the emergence of alternative semiconductor materials pose potential restraints on market expansion. Market segmentation reveals a significant share held by established players such as Mitsubishi Chemical and Hemlock Semiconductor, alongside the increasing participation of Chinese manufacturers like Tongwei and GCL-Poly. Regional analysis suggests a concentration of manufacturing and consumption in Asia, with North America and Europe also holding substantial market shares. The competitive landscape is characterized by both established players and new entrants, leading to ongoing innovation and consolidation within the industry.
Polycrystalline Silicon For Semiconductor Market Size (In Billion)
The future of the polysilicon market for semiconductors hinges on continued technological innovation to improve production efficiency, reduce costs, and enhance the material's performance characteristics. Government policies promoting renewable energy adoption and technological advancement will be crucial in driving market expansion. Supply chain resilience and diversification will be key for companies to navigate geopolitical risks and maintain market competitiveness. Moreover, companies are likely to focus on strategic partnerships and acquisitions to secure raw materials and expand their market reach. The overall outlook remains positive, with significant potential for growth driven by strong demand and ongoing technological developments. The continuous miniaturization of electronics and the expansion of the renewable energy sector ensure a long-term positive trajectory for this essential semiconductor material.
Polycrystalline Silicon For Semiconductor Company Market Share
Polycrystalline Silicon For Semiconductor Market Report: 2019-2033
This comprehensive report provides an in-depth analysis of the Polycrystalline Silicon For Semiconductor market, projecting a robust growth trajectory from 2019 to 2033. The study meticulously examines market dynamics, competitive landscapes, technological advancements, and regional variations, offering invaluable insights for stakeholders across the semiconductor value chain. With a base year of 2025 and an estimated year of 2025, the forecast period spans from 2025 to 2033, building upon the historical data from 2019 to 2024. The report leverages extensive primary and secondary research, providing a detailed understanding of the market valued at xx million USD in 2025, projected to reach xx million USD by 2033, exhibiting a Compound Annual Growth Rate (CAGR) of xx%.
Polycrystalline Silicon For Semiconductor Market Composition & Trends
This section analyzes the market's competitive landscape, including market share distribution amongst key players and the impact of mergers and acquisitions (M&A) activities. The report evaluates the influence of innovation, regulatory changes, substitute products, and end-user demands on market evolution.
Market Concentration: The market exhibits a moderately concentrated structure, with the top five players—Mitsubishi Chemical, Hemlock Semiconductor Group, Wacker Chemie, OCI Company, and Tokuyama Corporation—holding a combined market share of approximately xx%. Smaller players such as Daqo New Energy Corp, REC Silicon ASA, and others contribute to the remaining market share.
Innovation Catalysts: Ongoing advancements in semiconductor technology, particularly in the areas of higher efficiency and reduced production costs, are driving innovation within the polycrystalline silicon market.
Regulatory Landscape: Stringent environmental regulations and trade policies significantly influence production costs and market access.
Substitute Products: While few direct substitutes exist, advancements in alternative semiconductor materials are impacting market growth.
End-User Profiles: The primary end-users are semiconductor manufacturers serving various electronics applications, including smartphones, computers, and automotive electronics.
M&A Activities: The past five years have witnessed significant M&A activity, with deal values exceeding xx million USD, resulting in consolidation and market restructuring.
Polycrystalline Silicon For Semiconductor Industry Evolution
This in-depth analysis explores the historical and projected growth trajectories of the polycrystalline silicon market. The report examines technological advancements, including improvements in production processes and energy efficiency, which have significantly influenced market dynamics. Shifting consumer demands, particularly toward miniaturization and higher performance in electronic devices, are also considered. The analysis incorporates specific data points such as growth rates and adoption metrics for different technologies and applications. The market witnessed a CAGR of xx% during the historical period (2019-2024) and is expected to grow at a CAGR of xx% during the forecast period (2025-2033). This growth is primarily driven by increasing demand from the semiconductor industry, particularly in high-growth segments like 5G and automotive electronics. Technological advancements in purification and manufacturing techniques are enhancing the quality and reducing the cost of polycrystalline silicon, further fueling market expansion.
Leading Regions, Countries, or Segments in Polycrystalline Silicon For Semiconductor
This section identifies the dominant regions and countries in the polycrystalline silicon market. Asia, particularly China and South Korea, holds a significant share due to a concentration of semiconductor manufacturing facilities and supportive government policies.
Key Drivers in Asia:
- Substantial investments in semiconductor manufacturing capacity.
- Favorable government policies promoting domestic semiconductor industries.
- High demand for electronic devices.
Dominance Factors: The dominance of Asia is primarily attributed to the region's established semiconductor industry, significant investments in research and development, and robust government support for the sector. China's emergence as a major producer and consumer of polycrystalline silicon has also significantly contributed to Asia's leading position. Specific countries like China, Japan, and South Korea show remarkable growth compared to other parts of the world.
Polycrystalline Silicon For Semiconductor Product Innovations
Recent innovations in polycrystalline silicon focus on enhancing purity, improving crystal quality, and optimizing production processes to reduce costs. These advancements enable the manufacturing of higher-performance semiconductors with improved efficiency and reliability. Unique selling propositions include enhanced material properties that lead to superior device performance and improved manufacturing yields. For instance, the development of novel purification techniques has resulted in polycrystalline silicon with significantly reduced impurity levels, enabling the fabrication of more advanced semiconductor devices.
Propelling Factors for Polycrystalline Silicon For Semiconductor Growth
The growth of the polycrystalline silicon market is driven by several factors: the increasing demand for semiconductors in electronics, particularly smartphones and other consumer electronics, the expanding use of semiconductors in the automotive industry, and the growth of renewable energy sectors, driving the demand for solar cells. Government incentives and investments in research and development further propel market expansion.
Obstacles in the Polycrystalline Silicon For Semiconductor Market
The polycrystalline silicon market faces challenges such as fluctuating raw material prices, intense competition from other semiconductor materials, and environmental regulations related to silicon production. Supply chain disruptions and geopolitical uncertainties can also impact market stability.
Future Opportunities in Polycrystalline Silicon For Semiconductor
Future opportunities lie in the development of new applications for polycrystalline silicon, such as in advanced semiconductor devices and high-efficiency solar cells. The increasing demand for high-performance electronics and the growth of renewable energy sectors are expected to create significant market opportunities.
Major Players in the Polycrystalline Silicon For Semiconductor Ecosystem
- Mitsubishi Chemical
- Hemlock Semiconductor Group
- M.SETEK
- LDK Solar
- Tokuyama Corporation
- SunEdison
- REC Silicon ASA
- Daqo New Energy Corp
- Wacker Chemie
- OCI Company
- Tongwei
- GCL-Poly
- Xinte Energy
- East Hope
- Asia Silicon
- Inner Mongolia Dongli Photovoltaic Electronics
Key Developments in Polycrystalline Silicon For Semiconductor Industry
- 2022-Q4: Mitsubishi Chemical announced a significant expansion of its polycrystalline silicon production capacity.
- 2023-Q1: Hemlock Semiconductor Group partnered with a major semiconductor manufacturer to develop a new generation of high-purity polycrystalline silicon.
- 2023-Q2: A major merger between two polycrystalline silicon producers reshaped the competitive landscape. (Further details on mergers and acquisitions would be added here)
Strategic Polycrystalline Silicon For Semiconductor Market Forecast
The polycrystalline silicon market is poised for continued growth, driven by increasing demand from the electronics and renewable energy sectors. Technological advancements and supportive government policies will further enhance market expansion. The forecast suggests a robust growth trajectory, presenting attractive opportunities for market players. The anticipated expansion of the semiconductor industry and the growing adoption of renewable energy will fuel demand for polycrystalline silicon.
Polycrystalline Silicon For Semiconductor Segmentation
-
1. Application
- 1.1. Single-crystal Wafers
- 1.2. Solar Cells
-
2. Type
- 2.1. 10 N
- 2.2. 11 N
- 2.3. Others
Polycrystalline Silicon For Semiconductor Segmentation By Geography
-
1. North America
- 1.1. United States
- 1.2. Canada
- 1.3. Mexico
-
2. South America
- 2.1. Brazil
- 2.2. Argentina
- 2.3. Rest of South America
-
3. Europe
- 3.1. United Kingdom
- 3.2. Germany
- 3.3. France
- 3.4. Italy
- 3.5. Spain
- 3.6. Russia
- 3.7. Benelux
- 3.8. Nordics
- 3.9. Rest of Europe
-
4. Middle East & Africa
- 4.1. Turkey
- 4.2. Israel
- 4.3. GCC
- 4.4. North Africa
- 4.5. South Africa
- 4.6. Rest of Middle East & Africa
-
5. Asia Pacific
- 5.1. China
- 5.2. India
- 5.3. Japan
- 5.4. South Korea
- 5.5. ASEAN
- 5.6. Oceania
- 5.7. Rest of Asia Pacific
Polycrystalline Silicon For Semiconductor Regional Market Share
Geographic Coverage of Polycrystalline Silicon For Semiconductor
Polycrystalline Silicon For Semiconductor REPORT HIGHLIGHTS
| Aspects | Details |
|---|---|
| Study Period | 2020-2034 |
| Base Year | 2025 |
| Estimated Year | 2026 |
| Forecast Period | 2026-2034 |
| Historical Period | 2020-2025 |
| Growth Rate | CAGR of XXX% from 2020-2034 |
| Segmentation |
|
Table of Contents
- 1. Introduction
- 1.1. Research Scope
- 1.2. Market Segmentation
- 1.3. Research Objective
- 1.4. Definitions and Assumptions
- 2. Executive Summary
- 2.1. Market Snapshot
- 3. Market Dynamics
- 3.1. Market Drivers
- 3.2. Market Restrains
- 3.3. Market Trends
- 3.4. Market Opportunities
- 4. Market Factor Analysis
- 4.1. Porters Five Forces
- 4.1.1. Bargaining Power of Suppliers
- 4.1.2. Bargaining Power of Buyers
- 4.1.3. Threat of New Entrants
- 4.1.4. Threat of Substitutes
- 4.1.5. Competitive Rivalry
- 4.2. PESTEL analysis
- 4.3. BCG Analysis
- 4.3.1. Stars (High Growth, High Market Share)
- 4.3.2. Cash Cows (Low Growth, High Market Share)
- 4.3.3. Question Mark (High Growth, Low Market Share)
- 4.3.4. Dogs (Low Growth, Low Market Share)
- 4.4. Ansoff Matrix Analysis
- 4.5. Supply Chain Analysis
- 4.6. Regulatory Landscape
- 4.7. Current Market Potential and Opportunity Assessment (TAM–SAM–SOM Framework)
- 4.8. DMV Analyst Note
- 4.1. Porters Five Forces
- 5. Market Analysis, Insights and Forecast 2021-2033
- 5.1. Market Analysis, Insights and Forecast - by Application
- 5.1.1. Single-crystal Wafers
- 5.1.2. Solar Cells
- 5.2. Market Analysis, Insights and Forecast - by Type
- 5.2.1. 10 N
- 5.2.2. 11 N
- 5.2.3. Others
- 5.3. Market Analysis, Insights and Forecast - by Region
- 5.3.1. North America
- 5.3.2. South America
- 5.3.3. Europe
- 5.3.4. Middle East & Africa
- 5.3.5. Asia Pacific
- 5.1. Market Analysis, Insights and Forecast - by Application
- 6. Global Polycrystalline Silicon For Semiconductor Analysis, Insights and Forecast, 2021-2033
- 6.1. Market Analysis, Insights and Forecast - by Application
- 6.1.1. Single-crystal Wafers
- 6.1.2. Solar Cells
- 6.2. Market Analysis, Insights and Forecast - by Type
- 6.2.1. 10 N
- 6.2.2. 11 N
- 6.2.3. Others
- 6.1. Market Analysis, Insights and Forecast - by Application
- 7. North America Polycrystalline Silicon For Semiconductor Analysis, Insights and Forecast, 2020-2032
- 7.1. Market Analysis, Insights and Forecast - by Application
- 7.1.1. Single-crystal Wafers
- 7.1.2. Solar Cells
- 7.2. Market Analysis, Insights and Forecast - by Type
- 7.2.1. 10 N
- 7.2.2. 11 N
- 7.2.3. Others
- 7.1. Market Analysis, Insights and Forecast - by Application
- 8. South America Polycrystalline Silicon For Semiconductor Analysis, Insights and Forecast, 2020-2032
- 8.1. Market Analysis, Insights and Forecast - by Application
- 8.1.1. Single-crystal Wafers
- 8.1.2. Solar Cells
- 8.2. Market Analysis, Insights and Forecast - by Type
- 8.2.1. 10 N
- 8.2.2. 11 N
- 8.2.3. Others
- 8.1. Market Analysis, Insights and Forecast - by Application
- 9. Europe Polycrystalline Silicon For Semiconductor Analysis, Insights and Forecast, 2020-2032
- 9.1. Market Analysis, Insights and Forecast - by Application
- 9.1.1. Single-crystal Wafers
- 9.1.2. Solar Cells
- 9.2. Market Analysis, Insights and Forecast - by Type
- 9.2.1. 10 N
- 9.2.2. 11 N
- 9.2.3. Others
- 9.1. Market Analysis, Insights and Forecast - by Application
- 10. Middle East & Africa Polycrystalline Silicon For Semiconductor Analysis, Insights and Forecast, 2020-2032
- 10.1. Market Analysis, Insights and Forecast - by Application
- 10.1.1. Single-crystal Wafers
- 10.1.2. Solar Cells
- 10.2. Market Analysis, Insights and Forecast - by Type
- 10.2.1. 10 N
- 10.2.2. 11 N
- 10.2.3. Others
- 10.1. Market Analysis, Insights and Forecast - by Application
- 11. Asia Pacific Polycrystalline Silicon For Semiconductor Analysis, Insights and Forecast, 2020-2032
- 11.1. Market Analysis, Insights and Forecast - by Application
- 11.1.1. Single-crystal Wafers
- 11.1.2. Solar Cells
- 11.2. Market Analysis, Insights and Forecast - by Type
- 11.2.1. 10 N
- 11.2.2. 11 N
- 11.2.3. Others
- 11.1. Market Analysis, Insights and Forecast - by Application
- 12. Competitive Analysis
- 12.1. Company Profiles
- 12.1.1 Mitsubishi Chemical
- 12.1.1.1. Company Overview
- 12.1.1.2. Products
- 12.1.1.3. Company Financials
- 12.1.1.4. SWOT Analysis
- 12.1.2 Hemlock Semiconductor Group
- 12.1.2.1. Company Overview
- 12.1.2.2. Products
- 12.1.2.3. Company Financials
- 12.1.2.4. SWOT Analysis
- 12.1.3 M.SETEK
- 12.1.3.1. Company Overview
- 12.1.3.2. Products
- 12.1.3.3. Company Financials
- 12.1.3.4. SWOT Analysis
- 12.1.4 LDK Solar
- 12.1.4.1. Company Overview
- 12.1.4.2. Products
- 12.1.4.3. Company Financials
- 12.1.4.4. SWOT Analysis
- 12.1.5 Tokuyama Corporation
- 12.1.5.1. Company Overview
- 12.1.5.2. Products
- 12.1.5.3. Company Financials
- 12.1.5.4. SWOT Analysis
- 12.1.6 SunEdison
- 12.1.6.1. Company Overview
- 12.1.6.2. Products
- 12.1.6.3. Company Financials
- 12.1.6.4. SWOT Analysis
- 12.1.7 REC Silicon ASA
- 12.1.7.1. Company Overview
- 12.1.7.2. Products
- 12.1.7.3. Company Financials
- 12.1.7.4. SWOT Analysis
- 12.1.8 Daqo New Energy Corp
- 12.1.8.1. Company Overview
- 12.1.8.2. Products
- 12.1.8.3. Company Financials
- 12.1.8.4. SWOT Analysis
- 12.1.9 Wacker Chemie
- 12.1.9.1. Company Overview
- 12.1.9.2. Products
- 12.1.9.3. Company Financials
- 12.1.9.4. SWOT Analysis
- 12.1.10 OCI Company
- 12.1.10.1. Company Overview
- 12.1.10.2. Products
- 12.1.10.3. Company Financials
- 12.1.10.4. SWOT Analysis
- 12.1.11 Tongwei
- 12.1.11.1. Company Overview
- 12.1.11.2. Products
- 12.1.11.3. Company Financials
- 12.1.11.4. SWOT Analysis
- 12.1.12 GCL-Poly
- 12.1.12.1. Company Overview
- 12.1.12.2. Products
- 12.1.12.3. Company Financials
- 12.1.12.4. SWOT Analysis
- 12.1.13 Xinte Energy
- 12.1.13.1. Company Overview
- 12.1.13.2. Products
- 12.1.13.3. Company Financials
- 12.1.13.4. SWOT Analysis
- 12.1.14 East Hope
- 12.1.14.1. Company Overview
- 12.1.14.2. Products
- 12.1.14.3. Company Financials
- 12.1.14.4. SWOT Analysis
- 12.1.15 Asia Silicon
- 12.1.15.1. Company Overview
- 12.1.15.2. Products
- 12.1.15.3. Company Financials
- 12.1.15.4. SWOT Analysis
- 12.1.16 Inner Mongolia Dongli Photovoltaic Electronics
- 12.1.16.1. Company Overview
- 12.1.16.2. Products
- 12.1.16.3. Company Financials
- 12.1.16.4. SWOT Analysis
- 12.1.1 Mitsubishi Chemical
- 12.2. Market Entropy
- 12.2.1 Company's Key Areas Served
- 12.2.2 Recent Developments
- 12.3. Company Market Share Analysis 2025
- 12.3.1 Top 5 Companies Market Share Analysis
- 12.3.2 Top 3 Companies Market Share Analysis
- 12.4. List of Potential Customers
- 13. Research Methodology
List of Figures
- Figure 1: Global Polycrystalline Silicon For Semiconductor Revenue Breakdown (million, %) by Region 2025 & 2033
- Figure 2: North America Polycrystalline Silicon For Semiconductor Revenue (million), by Application 2025 & 2033
- Figure 3: North America Polycrystalline Silicon For Semiconductor Revenue Share (%), by Application 2025 & 2033
- Figure 4: North America Polycrystalline Silicon For Semiconductor Revenue (million), by Type 2025 & 2033
- Figure 5: North America Polycrystalline Silicon For Semiconductor Revenue Share (%), by Type 2025 & 2033
- Figure 6: North America Polycrystalline Silicon For Semiconductor Revenue (million), by Country 2025 & 2033
- Figure 7: North America Polycrystalline Silicon For Semiconductor Revenue Share (%), by Country 2025 & 2033
- Figure 8: South America Polycrystalline Silicon For Semiconductor Revenue (million), by Application 2025 & 2033
- Figure 9: South America Polycrystalline Silicon For Semiconductor Revenue Share (%), by Application 2025 & 2033
- Figure 10: South America Polycrystalline Silicon For Semiconductor Revenue (million), by Type 2025 & 2033
- Figure 11: South America Polycrystalline Silicon For Semiconductor Revenue Share (%), by Type 2025 & 2033
- Figure 12: South America Polycrystalline Silicon For Semiconductor Revenue (million), by Country 2025 & 2033
- Figure 13: South America Polycrystalline Silicon For Semiconductor Revenue Share (%), by Country 2025 & 2033
- Figure 14: Europe Polycrystalline Silicon For Semiconductor Revenue (million), by Application 2025 & 2033
- Figure 15: Europe Polycrystalline Silicon For Semiconductor Revenue Share (%), by Application 2025 & 2033
- Figure 16: Europe Polycrystalline Silicon For Semiconductor Revenue (million), by Type 2025 & 2033
- Figure 17: Europe Polycrystalline Silicon For Semiconductor Revenue Share (%), by Type 2025 & 2033
- Figure 18: Europe Polycrystalline Silicon For Semiconductor Revenue (million), by Country 2025 & 2033
- Figure 19: Europe Polycrystalline Silicon For Semiconductor Revenue Share (%), by Country 2025 & 2033
- Figure 20: Middle East & Africa Polycrystalline Silicon For Semiconductor Revenue (million), by Application 2025 & 2033
- Figure 21: Middle East & Africa Polycrystalline Silicon For Semiconductor Revenue Share (%), by Application 2025 & 2033
- Figure 22: Middle East & Africa Polycrystalline Silicon For Semiconductor Revenue (million), by Type 2025 & 2033
- Figure 23: Middle East & Africa Polycrystalline Silicon For Semiconductor Revenue Share (%), by Type 2025 & 2033
- Figure 24: Middle East & Africa Polycrystalline Silicon For Semiconductor Revenue (million), by Country 2025 & 2033
- Figure 25: Middle East & Africa Polycrystalline Silicon For Semiconductor Revenue Share (%), by Country 2025 & 2033
- Figure 26: Asia Pacific Polycrystalline Silicon For Semiconductor Revenue (million), by Application 2025 & 2033
- Figure 27: Asia Pacific Polycrystalline Silicon For Semiconductor Revenue Share (%), by Application 2025 & 2033
- Figure 28: Asia Pacific Polycrystalline Silicon For Semiconductor Revenue (million), by Type 2025 & 2033
- Figure 29: Asia Pacific Polycrystalline Silicon For Semiconductor Revenue Share (%), by Type 2025 & 2033
- Figure 30: Asia Pacific Polycrystalline Silicon For Semiconductor Revenue (million), by Country 2025 & 2033
- Figure 31: Asia Pacific Polycrystalline Silicon For Semiconductor Revenue Share (%), by Country 2025 & 2033
List of Tables
- Table 1: Global Polycrystalline Silicon For Semiconductor Revenue million Forecast, by Application 2020 & 2033
- Table 2: Global Polycrystalline Silicon For Semiconductor Revenue million Forecast, by Type 2020 & 2033
- Table 3: Global Polycrystalline Silicon For Semiconductor Revenue million Forecast, by Region 2020 & 2033
- Table 4: Global Polycrystalline Silicon For Semiconductor Revenue million Forecast, by Application 2020 & 2033
- Table 5: Global Polycrystalline Silicon For Semiconductor Revenue million Forecast, by Type 2020 & 2033
- Table 6: Global Polycrystalline Silicon For Semiconductor Revenue million Forecast, by Country 2020 & 2033
- Table 7: United States Polycrystalline Silicon For Semiconductor Revenue (million) Forecast, by Application 2020 & 2033
- Table 8: Canada Polycrystalline Silicon For Semiconductor Revenue (million) Forecast, by Application 2020 & 2033
- Table 9: Mexico Polycrystalline Silicon For Semiconductor Revenue (million) Forecast, by Application 2020 & 2033
- Table 10: Global Polycrystalline Silicon For Semiconductor Revenue million Forecast, by Application 2020 & 2033
- Table 11: Global Polycrystalline Silicon For Semiconductor Revenue million Forecast, by Type 2020 & 2033
- Table 12: Global Polycrystalline Silicon For Semiconductor Revenue million Forecast, by Country 2020 & 2033
- Table 13: Brazil Polycrystalline Silicon For Semiconductor Revenue (million) Forecast, by Application 2020 & 2033
- Table 14: Argentina Polycrystalline Silicon For Semiconductor Revenue (million) Forecast, by Application 2020 & 2033
- Table 15: Rest of South America Polycrystalline Silicon For Semiconductor Revenue (million) Forecast, by Application 2020 & 2033
- Table 16: Global Polycrystalline Silicon For Semiconductor Revenue million Forecast, by Application 2020 & 2033
- Table 17: Global Polycrystalline Silicon For Semiconductor Revenue million Forecast, by Type 2020 & 2033
- Table 18: Global Polycrystalline Silicon For Semiconductor Revenue million Forecast, by Country 2020 & 2033
- Table 19: United Kingdom Polycrystalline Silicon For Semiconductor Revenue (million) Forecast, by Application 2020 & 2033
- Table 20: Germany Polycrystalline Silicon For Semiconductor Revenue (million) Forecast, by Application 2020 & 2033
- Table 21: France Polycrystalline Silicon For Semiconductor Revenue (million) Forecast, by Application 2020 & 2033
- Table 22: Italy Polycrystalline Silicon For Semiconductor Revenue (million) Forecast, by Application 2020 & 2033
- Table 23: Spain Polycrystalline Silicon For Semiconductor Revenue (million) Forecast, by Application 2020 & 2033
- Table 24: Russia Polycrystalline Silicon For Semiconductor Revenue (million) Forecast, by Application 2020 & 2033
- Table 25: Benelux Polycrystalline Silicon For Semiconductor Revenue (million) Forecast, by Application 2020 & 2033
- Table 26: Nordics Polycrystalline Silicon For Semiconductor Revenue (million) Forecast, by Application 2020 & 2033
- Table 27: Rest of Europe Polycrystalline Silicon For Semiconductor Revenue (million) Forecast, by Application 2020 & 2033
- Table 28: Global Polycrystalline Silicon For Semiconductor Revenue million Forecast, by Application 2020 & 2033
- Table 29: Global Polycrystalline Silicon For Semiconductor Revenue million Forecast, by Type 2020 & 2033
- Table 30: Global Polycrystalline Silicon For Semiconductor Revenue million Forecast, by Country 2020 & 2033
- Table 31: Turkey Polycrystalline Silicon For Semiconductor Revenue (million) Forecast, by Application 2020 & 2033
- Table 32: Israel Polycrystalline Silicon For Semiconductor Revenue (million) Forecast, by Application 2020 & 2033
- Table 33: GCC Polycrystalline Silicon For Semiconductor Revenue (million) Forecast, by Application 2020 & 2033
- Table 34: North Africa Polycrystalline Silicon For Semiconductor Revenue (million) Forecast, by Application 2020 & 2033
- Table 35: South Africa Polycrystalline Silicon For Semiconductor Revenue (million) Forecast, by Application 2020 & 2033
- Table 36: Rest of Middle East & Africa Polycrystalline Silicon For Semiconductor Revenue (million) Forecast, by Application 2020 & 2033
- Table 37: Global Polycrystalline Silicon For Semiconductor Revenue million Forecast, by Application 2020 & 2033
- Table 38: Global Polycrystalline Silicon For Semiconductor Revenue million Forecast, by Type 2020 & 2033
- Table 39: Global Polycrystalline Silicon For Semiconductor Revenue million Forecast, by Country 2020 & 2033
- Table 40: China Polycrystalline Silicon For Semiconductor Revenue (million) Forecast, by Application 2020 & 2033
- Table 41: India Polycrystalline Silicon For Semiconductor Revenue (million) Forecast, by Application 2020 & 2033
- Table 42: Japan Polycrystalline Silicon For Semiconductor Revenue (million) Forecast, by Application 2020 & 2033
- Table 43: South Korea Polycrystalline Silicon For Semiconductor Revenue (million) Forecast, by Application 2020 & 2033
- Table 44: ASEAN Polycrystalline Silicon For Semiconductor Revenue (million) Forecast, by Application 2020 & 2033
- Table 45: Oceania Polycrystalline Silicon For Semiconductor Revenue (million) Forecast, by Application 2020 & 2033
- Table 46: Rest of Asia Pacific Polycrystalline Silicon For Semiconductor Revenue (million) Forecast, by Application 2020 & 2033
Frequently Asked Questions
1. What is the projected Compound Annual Growth Rate (CAGR) of the Polycrystalline Silicon For Semiconductor?
The projected CAGR is approximately XXX%.
2. Which companies are prominent players in the Polycrystalline Silicon For Semiconductor?
Key companies in the market include Mitsubishi Chemical, Hemlock Semiconductor Group, M.SETEK, LDK Solar, Tokuyama Corporation, SunEdison, REC Silicon ASA, Daqo New Energy Corp, Wacker Chemie, OCI Company, Tongwei, GCL-Poly, Xinte Energy, East Hope, Asia Silicon, Inner Mongolia Dongli Photovoltaic Electronics.
3. What are the main segments of the Polycrystalline Silicon For Semiconductor?
The market segments include Application, Type.
4. Can you provide details about the market size?
The market size is estimated to be USD XXX million as of 2022.
5. What are some drivers contributing to market growth?
N/A
6. What are the notable trends driving market growth?
N/A
7. Are there any restraints impacting market growth?
N/A
8. Can you provide examples of recent developments in the market?
N/A
9. What pricing options are available for accessing the report?
Pricing options include single-user, multi-user, and enterprise licenses priced at USD 2900.00, USD 4350.00, and USD 5800.00 respectively.
10. Is the market size provided in terms of value or volume?
The market size is provided in terms of value, measured in million.
11. Are there any specific market keywords associated with the report?
Yes, the market keyword associated with the report is "Polycrystalline Silicon For Semiconductor," which aids in identifying and referencing the specific market segment covered.
12. How do I determine which pricing option suits my needs best?
The pricing options vary based on user requirements and access needs. Individual users may opt for single-user licenses, while businesses requiring broader access may choose multi-user or enterprise licenses for cost-effective access to the report.
13. Are there any additional resources or data provided in the Polycrystalline Silicon For Semiconductor report?
While the report offers comprehensive insights, it's advisable to review the specific contents or supplementary materials provided to ascertain if additional resources or data are available.
14. How can I stay updated on further developments or reports in the Polycrystalline Silicon For Semiconductor?
To stay informed about further developments, trends, and reports in the Polycrystalline Silicon For Semiconductor, consider subscribing to industry newsletters, following relevant companies and organizations, or regularly checking reputable industry news sources and publications.
Methodology
Step 1 - Identification of Relevant Samples Size from Population Database


Step 2 - Approaches for Defining Global Market Size (Value, Volume* & Price*)

Note*: In applicable scenarios
Step 3 - Data Sources
Primary Research
- Web Analytics
- Survey Reports
- Research Institute
- Latest Research Reports
- Opinion Leaders
Secondary Research
- Annual Reports
- White Paper
- Latest Press Release
- Industry Association
- Paid Database
- Investor Presentations

Step 4 - Data Triangulation
Involves using different sources of information in order to increase the validity of a study
These sources are likely to be stakeholders in a program - participants, other researchers, program staff, other community members, and so on.
Then we put all data in single framework & apply various statistical tools to find out the dynamic on the market.
During the analysis stage, feedback from the stakeholder groups would be compared to determine areas of agreement as well as areas of divergence