

Key Insights
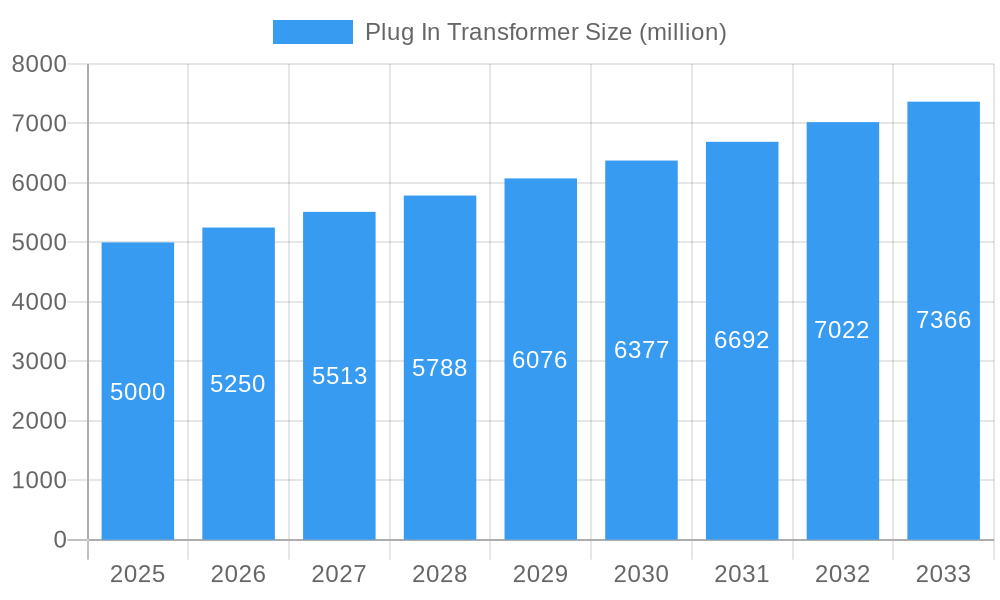
The plug-in transformer market, while experiencing a moderate growth trajectory, is poised for expansion driven by several key factors. The increasing demand for reliable power solutions in industrial automation, renewable energy integration, and consumer electronics fuels market growth. Furthermore, advancements in miniaturization and efficiency are creating smaller, lighter, and more energy-efficient plug-in transformers, appealing to a wider range of applications. Stringent energy efficiency regulations globally also incentivize the adoption of high-efficiency transformers, bolstering market growth. However, the market faces challenges such as fluctuating raw material prices and increasing competition from alternative power supply solutions. We estimate the market size to be approximately $5 billion in 2025, growing at a Compound Annual Growth Rate (CAGR) of 5% from 2025 to 2033. This growth is expected to be largely driven by the increasing demand from the industrial and renewable energy sectors, which are expected to adopt higher-power plug-in transformers. This growth will be moderated by the availability of alternative technologies and potential price fluctuations of core materials.
Plug In Transformer Market Size (In Billion)
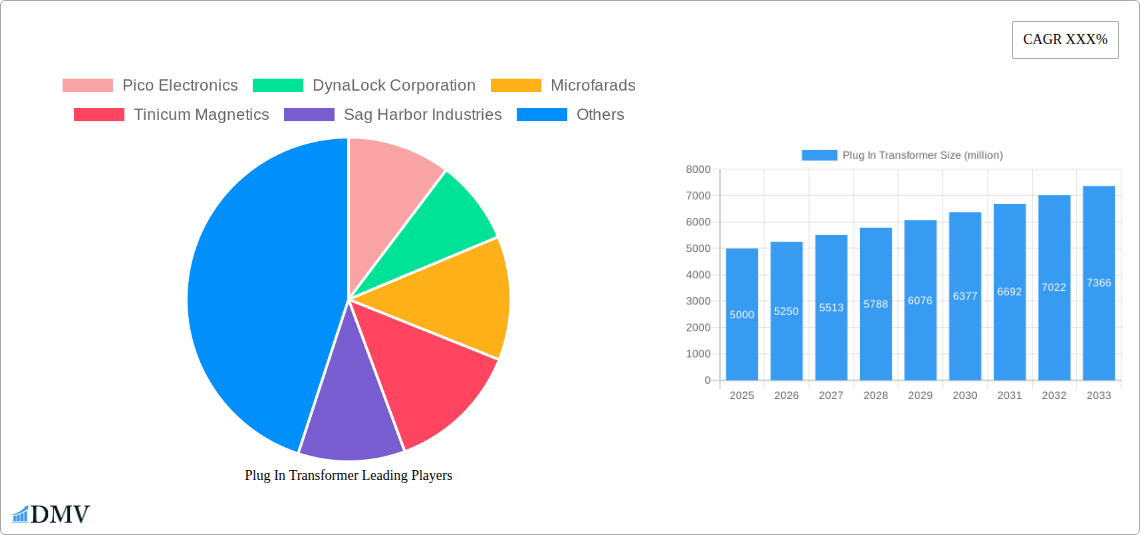
Segmentation within the plug-in transformer market is diverse, encompassing various power ratings, voltage levels, and application-specific designs. Key players such as Pico Electronics, DynaLock Corporation, and others compete based on product quality, innovation, and pricing strategies. Regional growth varies, with North America and Europe currently leading in market share due to established infrastructure and technological advancements. However, rapid industrialization in Asia-Pacific is expected to drive significant growth in this region over the forecast period. Continued technological innovation, focusing on improved energy efficiency and miniaturization, will be crucial for market leaders to maintain competitiveness and capture market share in this evolving landscape. The market is likely to see increased consolidation in the coming years, with larger players potentially acquiring smaller companies to strengthen their market position.
Plug In Transformer Company Market Share
Plug In Transformer Market Report: A Comprehensive Analysis (2019-2033)
This insightful report delivers a comprehensive analysis of the Plug In Transformer market, providing critical insights for stakeholders seeking to navigate this dynamic landscape. The study period spans from 2019 to 2033, with 2025 serving as the base and estimated year. The report meticulously examines market composition, technological advancements, regional dominance, and future opportunities, offering a detailed forecast from 2025 to 2033. With millions of dollars at stake, understanding this market is crucial for strategic decision-making.
Plug In Transformer Market Composition & Trends
This section delves into the intricate structure of the Plug In Transformer market, analyzing its concentration, innovative drivers, regulatory environment, substitute products, end-user profiles, and merger & acquisition (M&A) activities. Market share distribution amongst key players like Pico Electronics, DynaLock Corporation, and Microfarads will be examined, revealing the competitive intensity. We will also quantify the value of significant M&A deals within the period 2019-2024, showcasing the consolidation trends within the industry. The analysis will highlight the influence of regulatory landscapes on market growth and innovation. The impact of substitute products and evolving end-user demands will be thoroughly evaluated, providing a nuanced understanding of the market's evolution.
- Market Concentration: Analysis of market share held by top 5 players, revealing the degree of consolidation. xx% of the market is controlled by the top 5 players in 2024.
- Innovation Catalysts: Detailed examination of technological advancements driving market growth, including specific examples of new product features and functionalities.
- Regulatory Landscape: Analysis of key regulations and their impact on market access, product standards, and manufacturing processes. Specific examples of relevant regulations will be cited.
- Substitute Products: Identification and evaluation of potential substitute products and their impact on market share. Market share shift analysis from 2019 to 2024 due to substitution will be presented.
- End-User Profiles: Segmentation of end-users based on industry, application, and geographic location, highlighting their specific needs and preferences.
- M&A Activities: Analysis of significant M&A transactions (over $xx million) during 2019-2024, assessing their impact on market dynamics.
Plug In Transformer Industry Evolution
This section provides a detailed chronological overview of the Plug In Transformer market’s evolution from 2019 to 2024 and its projected trajectory to 2033. The analysis will cover market growth trajectories, technological advancements influencing product design and functionality, and the ever-shifting consumer demands. Specific data points, including compound annual growth rates (CAGRs) for different market segments and adoption rates of key technologies, will be presented to paint a comprehensive picture of the industry's transformation. We will examine the factors driving market growth and the impact of technological disruptions.
Leading Regions, Countries, or Segments in Plug In Transformer
This section identifies the leading geographic regions, countries, and market segments within the Plug In Transformer market. Through in-depth analysis, we will pinpoint the key factors driving their dominance. Detailed evaluation of investment trends, government support initiatives, and other factors contributing to the regional or segmental leadership will be presented.
- Key Drivers for Dominant Regions/Segments:
- Stronger governmental support and investment in infrastructure projects.
- Higher adoption rates of advanced Plug In Transformer technologies.
- Favorable regulatory environment stimulating market growth.
- Presence of established manufacturing facilities and supply chains.
- High consumer demand driven by specific application needs.
- Detailed Analysis of Dominance Factors: This section provides in-depth examination of the specific factors that led to the dominance of the identified region(s), including market size, growth trajectory, and competitiveness.
Plug In Transformer Product Innovations
This section highlights recent advancements in Plug In Transformer technology, focusing on novel designs, improved performance metrics, and innovative applications. The analysis will focus on the unique selling propositions (USPs) of these new products and their competitive advantages. Specific examples of groundbreaking technological breakthroughs will be included, emphasizing their impact on market dynamics.
Propelling Factors for Plug In Transformer Growth
This section identifies and analyzes the key growth drivers in the Plug In Transformer market. Technological innovations, favorable economic conditions, and supportive regulatory frameworks will be evaluated for their specific contribution to market expansion. We will illustrate this with real-world examples.
Obstacles in the Plug In Transformer Market
This section identifies and analyzes the significant barriers and restraints impacting the growth of the Plug In Transformer market. We will explore challenges posed by regulatory hurdles, supply chain disruptions, and intense competitive pressures, quantifying their impact on market growth.
Future Opportunities in Plug In Transformer
This section explores emerging opportunities that promise significant growth in the Plug In Transformer market. The analysis will focus on the potential for expansion into new markets, the adoption of innovative technologies, and emerging consumer trends.
Major Players in the Plug In Transformer Ecosystem
- Pico Electronics
- DynaLock Corporation
- Microfarads
- Tinicum Magnetics
- Sag Harbor Industries
- Vee Industries
- Lee Dan Communications
- Atco Technologies, Inc.
- 2MCCTV
- WAGO
- Manutech
- Andeli Group Company
- Contrel Elettronica
- Dongguan Wahhing Electrical Appliance
- HSGM
- INDU-ELECTRIC Gerber GmbH
Key Developments in Plug In Transformer Industry
- [Month, Year]: Launch of a new, high-efficiency Plug In Transformer model by [Company Name], increasing market competitiveness.
- [Month, Year]: Merger between [Company A] and [Company B], resulting in a larger market share and increased R&D capabilities.
- [Month, Year]: Introduction of a new industry regulation impacting product standards, influencing market dynamics.
- [Month, Year]: Significant investment by [Company Name] in a new manufacturing facility, expanding production capacity.
(Note: Further specific developments will be detailed in the full report.)
Strategic Plug In Transformer Market Forecast
This section provides a concise summary of the key growth catalysts expected to drive the Plug In Transformer market during the forecast period (2025-2033). The analysis will focus on the opportunities presented by emerging technologies and new market segments, highlighting the overall potential for substantial market expansion. We will project a total market value of $xx million by 2033.
Plug In Transformer Segmentation
-
1. Application
- 1.1. Power Engineering
- 1.2. Railway
- 1.3. Ship
- 1.4. Others
-
2. Type
- 2.1. AC Transformer
- 2.2. DC Transformer
Plug In Transformer Segmentation By Geography
-
1. North America
- 1.1. United States
- 1.2. Canada
- 1.3. Mexico
-
2. South America
- 2.1. Brazil
- 2.2. Argentina
- 2.3. Rest of South America
-
3. Europe
- 3.1. United Kingdom
- 3.2. Germany
- 3.3. France
- 3.4. Italy
- 3.5. Spain
- 3.6. Russia
- 3.7. Benelux
- 3.8. Nordics
- 3.9. Rest of Europe
-
4. Middle East & Africa
- 4.1. Turkey
- 4.2. Israel
- 4.3. GCC
- 4.4. North Africa
- 4.5. South Africa
- 4.6. Rest of Middle East & Africa
-
5. Asia Pacific
- 5.1. China
- 5.2. India
- 5.3. Japan
- 5.4. South Korea
- 5.5. ASEAN
- 5.6. Oceania
- 5.7. Rest of Asia Pacific

Plug In Transformer Regional Market Share
Geographic Coverage of Plug In Transformer
Plug In Transformer REPORT HIGHLIGHTS
| Aspects | Details |
|---|---|
| Study Period | 2020-2034 |
| Base Year | 2025 |
| Estimated Year | 2026 |
| Forecast Period | 2026-2034 |
| Historical Period | 2020-2025 |
| Growth Rate | CAGR of XXX% from 2020-2034 |
| Segmentation |
|
Table of Contents
- 1. Introduction
- 1.1. Research Scope
- 1.2. Market Segmentation
- 1.3. Research Objective
- 1.4. Definitions and Assumptions
- 2. Executive Summary
- 2.1. Market Snapshot
- 3. Market Dynamics
- 3.1. Market Drivers
- 3.2. Market Restrains
- 3.3. Market Trends
- 3.4. Market Opportunities
- 4. Market Factor Analysis
- 4.1. Porters Five Forces
- 4.1.1. Bargaining Power of Suppliers
- 4.1.2. Bargaining Power of Buyers
- 4.1.3. Threat of New Entrants
- 4.1.4. Threat of Substitutes
- 4.1.5. Competitive Rivalry
- 4.2. PESTEL analysis
- 4.3. BCG Analysis
- 4.3.1. Stars (High Growth, High Market Share)
- 4.3.2. Cash Cows (Low Growth, High Market Share)
- 4.3.3. Question Mark (High Growth, Low Market Share)
- 4.3.4. Dogs (Low Growth, Low Market Share)
- 4.4. Ansoff Matrix Analysis
- 4.5. Supply Chain Analysis
- 4.6. Regulatory Landscape
- 4.7. Current Market Potential and Opportunity Assessment (TAM–SAM–SOM Framework)
- 4.8. DMV Analyst Note
- 4.1. Porters Five Forces
- 5. Market Analysis, Insights and Forecast 2021-2033
- 5.1. Market Analysis, Insights and Forecast - by Application
- 5.1.1. Power Engineering
- 5.1.2. Railway
- 5.1.3. Ship
- 5.1.4. Others
- 5.2. Market Analysis, Insights and Forecast - by Type
- 5.2.1. AC Transformer
- 5.2.2. DC Transformer
- 5.3. Market Analysis, Insights and Forecast - by Region
- 5.3.1. North America
- 5.3.2. South America
- 5.3.3. Europe
- 5.3.4. Middle East & Africa
- 5.3.5. Asia Pacific
- 5.1. Market Analysis, Insights and Forecast - by Application
- 6. Global Plug In Transformer Analysis, Insights and Forecast, 2021-2033
- 6.1. Market Analysis, Insights and Forecast - by Application
- 6.1.1. Power Engineering
- 6.1.2. Railway
- 6.1.3. Ship
- 6.1.4. Others
- 6.2. Market Analysis, Insights and Forecast - by Type
- 6.2.1. AC Transformer
- 6.2.2. DC Transformer
- 6.1. Market Analysis, Insights and Forecast - by Application
- 7. North America Plug In Transformer Analysis, Insights and Forecast, 2020-2032
- 7.1. Market Analysis, Insights and Forecast - by Application
- 7.1.1. Power Engineering
- 7.1.2. Railway
- 7.1.3. Ship
- 7.1.4. Others
- 7.2. Market Analysis, Insights and Forecast - by Type
- 7.2.1. AC Transformer
- 7.2.2. DC Transformer
- 7.1. Market Analysis, Insights and Forecast - by Application
- 8. South America Plug In Transformer Analysis, Insights and Forecast, 2020-2032
- 8.1. Market Analysis, Insights and Forecast - by Application
- 8.1.1. Power Engineering
- 8.1.2. Railway
- 8.1.3. Ship
- 8.1.4. Others
- 8.2. Market Analysis, Insights and Forecast - by Type
- 8.2.1. AC Transformer
- 8.2.2. DC Transformer
- 8.1. Market Analysis, Insights and Forecast - by Application
- 9. Europe Plug In Transformer Analysis, Insights and Forecast, 2020-2032
- 9.1. Market Analysis, Insights and Forecast - by Application
- 9.1.1. Power Engineering
- 9.1.2. Railway
- 9.1.3. Ship
- 9.1.4. Others
- 9.2. Market Analysis, Insights and Forecast - by Type
- 9.2.1. AC Transformer
- 9.2.2. DC Transformer
- 9.1. Market Analysis, Insights and Forecast - by Application
- 10. Middle East & Africa Plug In Transformer Analysis, Insights and Forecast, 2020-2032
- 10.1. Market Analysis, Insights and Forecast - by Application
- 10.1.1. Power Engineering
- 10.1.2. Railway
- 10.1.3. Ship
- 10.1.4. Others
- 10.2. Market Analysis, Insights and Forecast - by Type
- 10.2.1. AC Transformer
- 10.2.2. DC Transformer
- 10.1. Market Analysis, Insights and Forecast - by Application
- 11. Asia Pacific Plug In Transformer Analysis, Insights and Forecast, 2020-2032
- 11.1. Market Analysis, Insights and Forecast - by Application
- 11.1.1. Power Engineering
- 11.1.2. Railway
- 11.1.3. Ship
- 11.1.4. Others
- 11.2. Market Analysis, Insights and Forecast - by Type
- 11.2.1. AC Transformer
- 11.2.2. DC Transformer
- 11.1. Market Analysis, Insights and Forecast - by Application
- 12. Competitive Analysis
- 12.1. Company Profiles
- 12.1.1 Pico Electronics
- 12.1.1.1. Company Overview
- 12.1.1.2. Products
- 12.1.1.3. Company Financials
- 12.1.1.4. SWOT Analysis
- 12.1.2 DynaLock Corporation
- 12.1.2.1. Company Overview
- 12.1.2.2. Products
- 12.1.2.3. Company Financials
- 12.1.2.4. SWOT Analysis
- 12.1.3 Microfarads
- 12.1.3.1. Company Overview
- 12.1.3.2. Products
- 12.1.3.3. Company Financials
- 12.1.3.4. SWOT Analysis
- 12.1.4 Tinicum Magnetics
- 12.1.4.1. Company Overview
- 12.1.4.2. Products
- 12.1.4.3. Company Financials
- 12.1.4.4. SWOT Analysis
- 12.1.5 Sag Harbor Industries
- 12.1.5.1. Company Overview
- 12.1.5.2. Products
- 12.1.5.3. Company Financials
- 12.1.5.4. SWOT Analysis
- 12.1.6 Vee Industries
- 12.1.6.1. Company Overview
- 12.1.6.2. Products
- 12.1.6.3. Company Financials
- 12.1.6.4. SWOT Analysis
- 12.1.7 Lee Dan Communications
- 12.1.7.1. Company Overview
- 12.1.7.2. Products
- 12.1.7.3. Company Financials
- 12.1.7.4. SWOT Analysis
- 12.1.8 Atco Technologies Inc.
- 12.1.8.1. Company Overview
- 12.1.8.2. Products
- 12.1.8.3. Company Financials
- 12.1.8.4. SWOT Analysis
- 12.1.9 2MCCTV
- 12.1.9.1. Company Overview
- 12.1.9.2. Products
- 12.1.9.3. Company Financials
- 12.1.9.4. SWOT Analysis
- 12.1.10 WAGO
- 12.1.10.1. Company Overview
- 12.1.10.2. Products
- 12.1.10.3. Company Financials
- 12.1.10.4. SWOT Analysis
- 12.1.11 Manutech
- 12.1.11.1. Company Overview
- 12.1.11.2. Products
- 12.1.11.3. Company Financials
- 12.1.11.4. SWOT Analysis
- 12.1.12 Andeli Group Company
- 12.1.12.1. Company Overview
- 12.1.12.2. Products
- 12.1.12.3. Company Financials
- 12.1.12.4. SWOT Analysis
- 12.1.13 Contrel Elettronica
- 12.1.13.1. Company Overview
- 12.1.13.2. Products
- 12.1.13.3. Company Financials
- 12.1.13.4. SWOT Analysis
- 12.1.14 Dongguan Wahhing Electrical Appliance
- 12.1.14.1. Company Overview
- 12.1.14.2. Products
- 12.1.14.3. Company Financials
- 12.1.14.4. SWOT Analysis
- 12.1.15 HSGM
- 12.1.15.1. Company Overview
- 12.1.15.2. Products
- 12.1.15.3. Company Financials
- 12.1.15.4. SWOT Analysis
- 12.1.16 INDU-ELECTRIC Gerber GmbH
- 12.1.16.1. Company Overview
- 12.1.16.2. Products
- 12.1.16.3. Company Financials
- 12.1.16.4. SWOT Analysis
- 12.1.1 Pico Electronics
- 12.2. Market Entropy
- 12.2.1 Company's Key Areas Served
- 12.2.2 Recent Developments
- 12.3. Company Market Share Analysis 2025
- 12.3.1 Top 5 Companies Market Share Analysis
- 12.3.2 Top 3 Companies Market Share Analysis
- 12.4. List of Potential Customers
- 13. Research Methodology
List of Figures
- Figure 1: Global Plug In Transformer Revenue Breakdown (million, %) by Region 2025 & 2033
- Figure 2: North America Plug In Transformer Revenue (million), by Application 2025 & 2033
- Figure 3: North America Plug In Transformer Revenue Share (%), by Application 2025 & 2033
- Figure 4: North America Plug In Transformer Revenue (million), by Type 2025 & 2033
- Figure 5: North America Plug In Transformer Revenue Share (%), by Type 2025 & 2033
- Figure 6: North America Plug In Transformer Revenue (million), by Country 2025 & 2033
- Figure 7: North America Plug In Transformer Revenue Share (%), by Country 2025 & 2033
- Figure 8: South America Plug In Transformer Revenue (million), by Application 2025 & 2033
- Figure 9: South America Plug In Transformer Revenue Share (%), by Application 2025 & 2033
- Figure 10: South America Plug In Transformer Revenue (million), by Type 2025 & 2033
- Figure 11: South America Plug In Transformer Revenue Share (%), by Type 2025 & 2033
- Figure 12: South America Plug In Transformer Revenue (million), by Country 2025 & 2033
- Figure 13: South America Plug In Transformer Revenue Share (%), by Country 2025 & 2033
- Figure 14: Europe Plug In Transformer Revenue (million), by Application 2025 & 2033
- Figure 15: Europe Plug In Transformer Revenue Share (%), by Application 2025 & 2033
- Figure 16: Europe Plug In Transformer Revenue (million), by Type 2025 & 2033
- Figure 17: Europe Plug In Transformer Revenue Share (%), by Type 2025 & 2033
- Figure 18: Europe Plug In Transformer Revenue (million), by Country 2025 & 2033
- Figure 19: Europe Plug In Transformer Revenue Share (%), by Country 2025 & 2033
- Figure 20: Middle East & Africa Plug In Transformer Revenue (million), by Application 2025 & 2033
- Figure 21: Middle East & Africa Plug In Transformer Revenue Share (%), by Application 2025 & 2033
- Figure 22: Middle East & Africa Plug In Transformer Revenue (million), by Type 2025 & 2033
- Figure 23: Middle East & Africa Plug In Transformer Revenue Share (%), by Type 2025 & 2033
- Figure 24: Middle East & Africa Plug In Transformer Revenue (million), by Country 2025 & 2033
- Figure 25: Middle East & Africa Plug In Transformer Revenue Share (%), by Country 2025 & 2033
- Figure 26: Asia Pacific Plug In Transformer Revenue (million), by Application 2025 & 2033
- Figure 27: Asia Pacific Plug In Transformer Revenue Share (%), by Application 2025 & 2033
- Figure 28: Asia Pacific Plug In Transformer Revenue (million), by Type 2025 & 2033
- Figure 29: Asia Pacific Plug In Transformer Revenue Share (%), by Type 2025 & 2033
- Figure 30: Asia Pacific Plug In Transformer Revenue (million), by Country 2025 & 2033
- Figure 31: Asia Pacific Plug In Transformer Revenue Share (%), by Country 2025 & 2033
List of Tables
- Table 1: Global Plug In Transformer Revenue million Forecast, by Application 2020 & 2033
- Table 2: Global Plug In Transformer Revenue million Forecast, by Type 2020 & 2033
- Table 3: Global Plug In Transformer Revenue million Forecast, by Region 2020 & 2033
- Table 4: Global Plug In Transformer Revenue million Forecast, by Application 2020 & 2033
- Table 5: Global Plug In Transformer Revenue million Forecast, by Type 2020 & 2033
- Table 6: Global Plug In Transformer Revenue million Forecast, by Country 2020 & 2033
- Table 7: United States Plug In Transformer Revenue (million) Forecast, by Application 2020 & 2033
- Table 8: Canada Plug In Transformer Revenue (million) Forecast, by Application 2020 & 2033
- Table 9: Mexico Plug In Transformer Revenue (million) Forecast, by Application 2020 & 2033
- Table 10: Global Plug In Transformer Revenue million Forecast, by Application 2020 & 2033
- Table 11: Global Plug In Transformer Revenue million Forecast, by Type 2020 & 2033
- Table 12: Global Plug In Transformer Revenue million Forecast, by Country 2020 & 2033
- Table 13: Brazil Plug In Transformer Revenue (million) Forecast, by Application 2020 & 2033
- Table 14: Argentina Plug In Transformer Revenue (million) Forecast, by Application 2020 & 2033
- Table 15: Rest of South America Plug In Transformer Revenue (million) Forecast, by Application 2020 & 2033
- Table 16: Global Plug In Transformer Revenue million Forecast, by Application 2020 & 2033
- Table 17: Global Plug In Transformer Revenue million Forecast, by Type 2020 & 2033
- Table 18: Global Plug In Transformer Revenue million Forecast, by Country 2020 & 2033
- Table 19: United Kingdom Plug In Transformer Revenue (million) Forecast, by Application 2020 & 2033
- Table 20: Germany Plug In Transformer Revenue (million) Forecast, by Application 2020 & 2033
- Table 21: France Plug In Transformer Revenue (million) Forecast, by Application 2020 & 2033
- Table 22: Italy Plug In Transformer Revenue (million) Forecast, by Application 2020 & 2033
- Table 23: Spain Plug In Transformer Revenue (million) Forecast, by Application 2020 & 2033
- Table 24: Russia Plug In Transformer Revenue (million) Forecast, by Application 2020 & 2033
- Table 25: Benelux Plug In Transformer Revenue (million) Forecast, by Application 2020 & 2033
- Table 26: Nordics Plug In Transformer Revenue (million) Forecast, by Application 2020 & 2033
- Table 27: Rest of Europe Plug In Transformer Revenue (million) Forecast, by Application 2020 & 2033
- Table 28: Global Plug In Transformer Revenue million Forecast, by Application 2020 & 2033
- Table 29: Global Plug In Transformer Revenue million Forecast, by Type 2020 & 2033
- Table 30: Global Plug In Transformer Revenue million Forecast, by Country 2020 & 2033
- Table 31: Turkey Plug In Transformer Revenue (million) Forecast, by Application 2020 & 2033
- Table 32: Israel Plug In Transformer Revenue (million) Forecast, by Application 2020 & 2033
- Table 33: GCC Plug In Transformer Revenue (million) Forecast, by Application 2020 & 2033
- Table 34: North Africa Plug In Transformer Revenue (million) Forecast, by Application 2020 & 2033
- Table 35: South Africa Plug In Transformer Revenue (million) Forecast, by Application 2020 & 2033
- Table 36: Rest of Middle East & Africa Plug In Transformer Revenue (million) Forecast, by Application 2020 & 2033
- Table 37: Global Plug In Transformer Revenue million Forecast, by Application 2020 & 2033
- Table 38: Global Plug In Transformer Revenue million Forecast, by Type 2020 & 2033
- Table 39: Global Plug In Transformer Revenue million Forecast, by Country 2020 & 2033
- Table 40: China Plug In Transformer Revenue (million) Forecast, by Application 2020 & 2033
- Table 41: India Plug In Transformer Revenue (million) Forecast, by Application 2020 & 2033
- Table 42: Japan Plug In Transformer Revenue (million) Forecast, by Application 2020 & 2033
- Table 43: South Korea Plug In Transformer Revenue (million) Forecast, by Application 2020 & 2033
- Table 44: ASEAN Plug In Transformer Revenue (million) Forecast, by Application 2020 & 2033
- Table 45: Oceania Plug In Transformer Revenue (million) Forecast, by Application 2020 & 2033
- Table 46: Rest of Asia Pacific Plug In Transformer Revenue (million) Forecast, by Application 2020 & 2033
Frequently Asked Questions
1. What is the projected Compound Annual Growth Rate (CAGR) of the Plug In Transformer?
The projected CAGR is approximately XXX%.
2. Which companies are prominent players in the Plug In Transformer?
Key companies in the market include Pico Electronics, DynaLock Corporation, Microfarads, Tinicum Magnetics, Sag Harbor Industries, Vee Industries, Lee Dan Communications, Atco Technologies, Inc., 2MCCTV, WAGO, Manutech, Andeli Group Company, Contrel Elettronica, Dongguan Wahhing Electrical Appliance, HSGM, INDU-ELECTRIC Gerber GmbH.
3. What are the main segments of the Plug In Transformer?
The market segments include Application, Type.
4. Can you provide details about the market size?
The market size is estimated to be USD XXX million as of 2022.
5. What are some drivers contributing to market growth?
N/A
6. What are the notable trends driving market growth?
N/A
7. Are there any restraints impacting market growth?
N/A
8. Can you provide examples of recent developments in the market?
N/A
9. What pricing options are available for accessing the report?
Pricing options include single-user, multi-user, and enterprise licenses priced at USD 2900.00, USD 4350.00, and USD 5800.00 respectively.
10. Is the market size provided in terms of value or volume?
The market size is provided in terms of value, measured in million.
11. Are there any specific market keywords associated with the report?
Yes, the market keyword associated with the report is "Plug In Transformer," which aids in identifying and referencing the specific market segment covered.
12. How do I determine which pricing option suits my needs best?
The pricing options vary based on user requirements and access needs. Individual users may opt for single-user licenses, while businesses requiring broader access may choose multi-user or enterprise licenses for cost-effective access to the report.
13. Are there any additional resources or data provided in the Plug In Transformer report?
While the report offers comprehensive insights, it's advisable to review the specific contents or supplementary materials provided to ascertain if additional resources or data are available.
14. How can I stay updated on further developments or reports in the Plug In Transformer?
To stay informed about further developments, trends, and reports in the Plug In Transformer, consider subscribing to industry newsletters, following relevant companies and organizations, or regularly checking reputable industry news sources and publications.
Methodology
Step 1 - Identification of Relevant Samples Size from Population Database


Step 2 - Approaches for Defining Global Market Size (Value, Volume* & Price*)

Note*: In applicable scenarios
Step 3 - Data Sources
Primary Research
- Web Analytics
- Survey Reports
- Research Institute
- Latest Research Reports
- Opinion Leaders
Secondary Research
- Annual Reports
- White Paper
- Latest Press Release
- Industry Association
- Paid Database
- Investor Presentations

Step 4 - Data Triangulation
Involves using different sources of information in order to increase the validity of a study
These sources are likely to be stakeholders in a program - participants, other researchers, program staff, other community members, and so on.
Then we put all data in single framework & apply various statistical tools to find out the dynamic on the market.
During the analysis stage, feedback from the stakeholder groups would be compared to determine areas of agreement as well as areas of divergence