

Key Insights
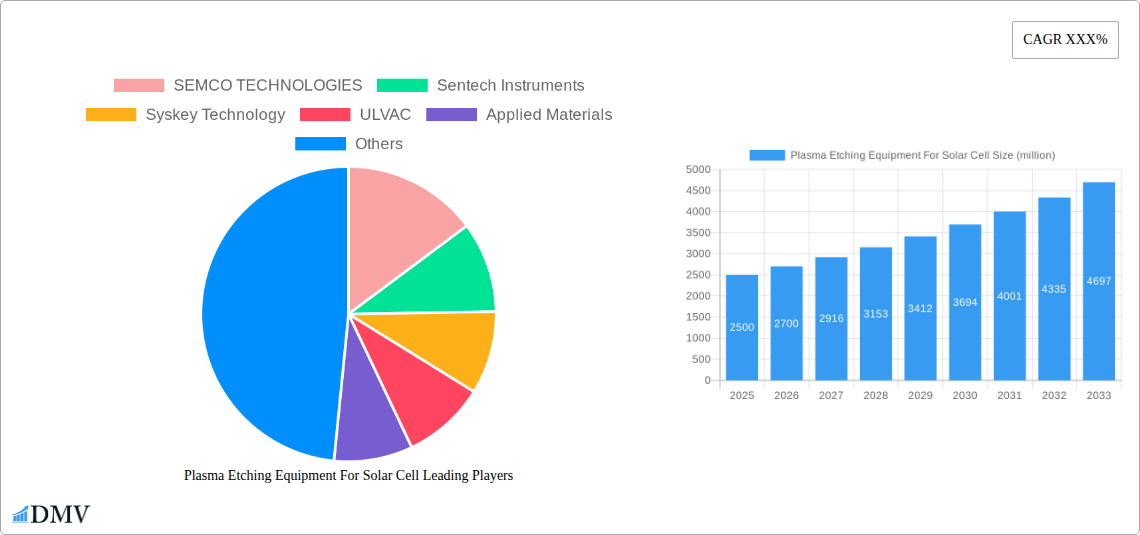
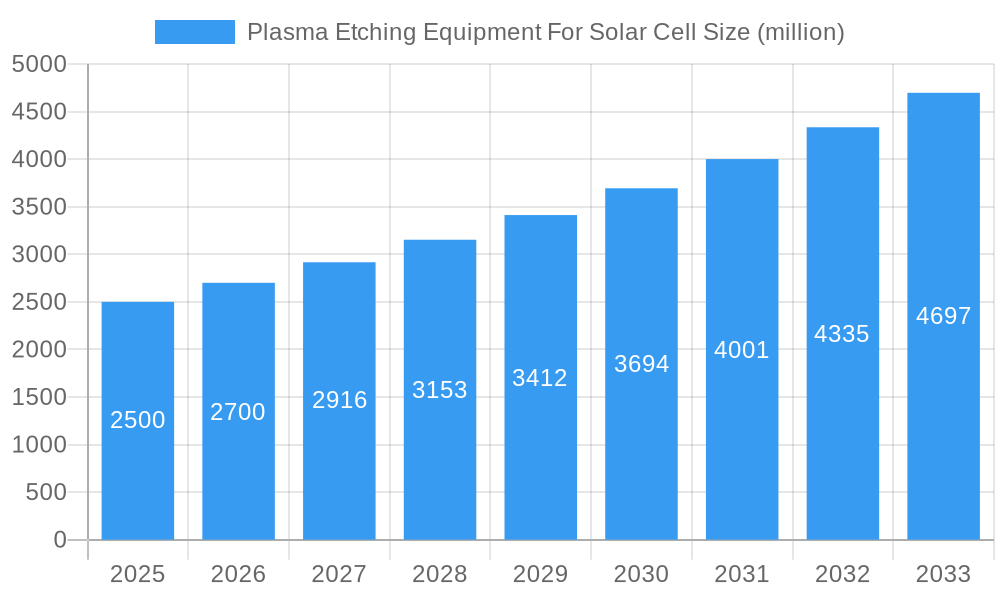
The global market for plasma etching equipment specifically designed for solar cell manufacturing is experiencing robust growth, driven by the escalating demand for renewable energy sources and continuous advancements in solar cell technology. The market, estimated at $2.5 billion in 2025, is projected to exhibit a Compound Annual Growth Rate (CAGR) of 8% from 2025 to 2033, reaching approximately $4.5 billion by 2033. This expansion is fueled by several key factors. Firstly, the increasing adoption of high-efficiency solar cells, such as PERC and TOPCon cells, necessitates more precise and advanced etching techniques, boosting the demand for sophisticated plasma etching equipment. Secondly, the ongoing trend toward larger-scale solar power plant installations requires higher throughput equipment, driving innovation and investment in this sector. Finally, government incentives and subsidies aimed at promoting renewable energy adoption further contribute to the market's growth trajectory. Key players like SEMCO Technologies, Sentech Instruments, Syskey Technology, ULVAC, Applied Materials, Hitachi High-Technologies, and Plasma Etch are actively engaged in research and development, aiming to improve etching precision, throughput, and cost-effectiveness.
Plasma Etching Equipment For Solar Cell Market Size (In Billion)
However, the market also faces some challenges. High capital investment costs associated with purchasing and maintaining advanced plasma etching equipment can be a barrier for smaller companies. Furthermore, the complexity of the technology requires skilled technicians for operation and maintenance, potentially creating a talent shortage in certain regions. Despite these restraints, the long-term outlook for the plasma etching equipment market in solar cell manufacturing remains exceptionally positive, propelled by the undeniable global transition towards sustainable energy solutions and the continuous improvement of solar cell efficiency. The competitive landscape is characterized by both established players and emerging companies, fostering innovation and driving down costs over time. This competitive dynamic further fuels market expansion and ensures the long-term viability of the sector.
Plasma Etching Equipment For Solar Cell Company Market Share
Plasma Etching Equipment for Solar Cell Market: A Comprehensive Report (2019-2033)
This insightful report provides a comprehensive analysis of the global Plasma Etching Equipment for Solar Cell market, projecting a market value exceeding $XX million by 2033. The study covers the period from 2019 to 2033, with 2025 serving as both the base and estimated year. This detailed examination reveals crucial market dynamics, technological advancements, and future growth prospects, empowering stakeholders to make informed strategic decisions.
Plasma Etching Equipment For Solar Cell Market Composition & Trends
This section delves into the intricate structure and evolving trends of the plasma etching equipment market for solar cell manufacturing. We analyze market concentration, revealing the dominance of key players like Applied Materials and Hitachi High-Technologies, who collectively hold an estimated xx% market share in 2025. The report also examines the influence of innovation catalysts, such as the increasing demand for high-efficiency solar cells, and the impact of regulatory landscapes, including government incentives for renewable energy.
- Market Concentration: High concentration with a few dominant players controlling a significant market share.
- Innovation Catalysts: Advancements in plasma etching techniques driving efficiency and cost reductions.
- Regulatory Landscape: Government policies promoting renewable energy adoption influence market growth.
- Substitute Products: Limited viable substitutes, reinforcing the market's reliance on plasma etching technology.
- End-User Profiles: Primarily solar cell manufacturers, with a growing contribution from research institutions.
- M&A Activities: The report details significant M&A activities within the past five years, with total deal values exceeding $XX million. Consolidation is expected to continue, driven by the need for technological advancements and economies of scale. Examples include [mention specific mergers and acquisitions with deal values if available, otherwise use "xx million" as a placeholder].
Plasma Etching Equipment For Solar Cell Industry Evolution
This section provides a detailed analysis of the industry's evolution from 2019 to 2033. The market witnessed a Compound Annual Growth Rate (CAGR) of xx% during the historical period (2019-2024), driven by the increasing global demand for solar energy. Technological advancements, such as the development of more precise and efficient etching techniques, have played a crucial role in shaping market growth. Shifting consumer demands towards higher-efficiency, lower-cost solar cells are further accelerating market expansion. We project a CAGR of xx% during the forecast period (2025-2033), with the market exceeding $XX million by 2033. The adoption rate of advanced plasma etching equipment is also analyzed, indicating a significant increase in adoption amongst major solar cell manufacturers.
Leading Regions, Countries, or Segments in Plasma Etching Equipment For Solar Cell
The report identifies [Region Name] as the dominant region in the global plasma etching equipment market for solar cells, accounting for xx% of the global market share in 2025. This dominance is attributed to several key factors:
- High Solar Energy Adoption: Significant government support and investment in renewable energy projects.
- Established Manufacturing Base: A strong presence of major solar cell manufacturers in the region.
- Favorable Regulatory Environment: Supportive policies encouraging technological advancement and investment in the solar industry.
This section further analyzes the factors contributing to the dominance of [Country Name] within [Region Name], and other significant regions, providing a deep dive into market dynamics and future potential in each geographical area.
Plasma Etching Equipment For Solar Cell Product Innovations
Recent innovations in plasma etching equipment for solar cells include the development of advanced etching processes that enhance efficiency and reduce manufacturing costs. These innovations focus on improving precision, reducing damage to the solar cell surface, and expanding the range of materials compatible with the etching process. This translates to higher-efficiency solar cells with improved performance metrics and longer lifespans. Unique selling propositions often center on improved throughput, reduced defects, and enhanced process control, leading to considerable cost advantages for solar cell manufacturers.
Propelling Factors for Plasma Etching Equipment For Solar Cell Growth
The growth of the plasma etching equipment market for solar cells is primarily driven by the increasing global demand for renewable energy, spurred by climate change concerns and government policies promoting solar energy adoption. Technological advancements in plasma etching techniques, leading to higher-efficiency and lower-cost solar cells, are key factors. Furthermore, the declining cost of solar energy itself is expanding market adoption and fueling demand for advanced manufacturing equipment.
Obstacles in the Plasma Etching Equipment For Solar Cell Market
Challenges to market growth include potential supply chain disruptions impacting the availability of critical components for plasma etching equipment. Intense competition among established and emerging players also creates pressure on pricing and profit margins. Regulatory hurdles and variations in environmental regulations across different countries can also present obstacles for manufacturers seeking global market expansion. These factors could collectively impact the market by reducing growth rates by an estimated xx% annually.
Future Opportunities in Plasma Etching Equipment For Solar Cell
Future opportunities lie in the development of next-generation plasma etching technologies capable of processing even more complex solar cell designs. Expanding into new markets, especially developing economies with rapidly growing renewable energy sectors, presents significant potential. The integration of advanced automation and process control systems into plasma etching equipment will further enhance efficiency and drive market growth.
Major Players in the Plasma Etching Equipment For Solar Cell Ecosystem
- SEMCO TECHNOLOGIES
- Sentech Instruments
- Syskey Technology
- ULVAC
- Applied Materials
- Hitachi High-Technologies
- Plasma Etch
Key Developments in Plasma Etching Equipment For Solar Cell Industry
- 2022-Q4: Applied Materials launches a new generation of plasma etching systems for improved efficiency.
- 2023-Q1: Hitachi High-Technologies announces a strategic partnership with a major solar cell manufacturer.
- 2023-Q3: SEMCO TECHNOLOGIES announces a significant investment in R&D for advanced plasma etching technology. [Add more if data is available, otherwise use "xx" as placeholder for year/month and description]
Strategic Plasma Etching Equipment For Solar Cell Market Forecast
The future of the plasma etching equipment market for solar cells looks promising, driven by the sustained growth of the solar energy industry. Technological innovations will continue to enhance efficiency and reduce costs, further fueling market expansion. The focus on sustainability and the increasing demand for renewable energy sources ensure a positive outlook for the coming years, with potential market values exceeding $XX million by 2033. The report provides detailed forecasts on market size, segment growth, and regional dynamics, offering valuable insights for strategic planning and investment decisions.
Plasma Etching Equipment For Solar Cell Segmentation
-
1. Application
- 1.1. Traffic
- 1.2. Solar Building
- 1.3. Photovoltaic Power Station
- 1.4. Others
-
2. Type
- 2.1. Sputter Etching
- 2.2. Chemical Etching
- 2.3. Physicochemical Etching
Plasma Etching Equipment For Solar Cell Segmentation By Geography
-
1. North America
- 1.1. United States
- 1.2. Canada
- 1.3. Mexico
-
2. South America
- 2.1. Brazil
- 2.2. Argentina
- 2.3. Rest of South America
-
3. Europe
- 3.1. United Kingdom
- 3.2. Germany
- 3.3. France
- 3.4. Italy
- 3.5. Spain
- 3.6. Russia
- 3.7. Benelux
- 3.8. Nordics
- 3.9. Rest of Europe
-
4. Middle East & Africa
- 4.1. Turkey
- 4.2. Israel
- 4.3. GCC
- 4.4. North Africa
- 4.5. South Africa
- 4.6. Rest of Middle East & Africa
-
5. Asia Pacific
- 5.1. China
- 5.2. India
- 5.3. Japan
- 5.4. South Korea
- 5.5. ASEAN
- 5.6. Oceania
- 5.7. Rest of Asia Pacific
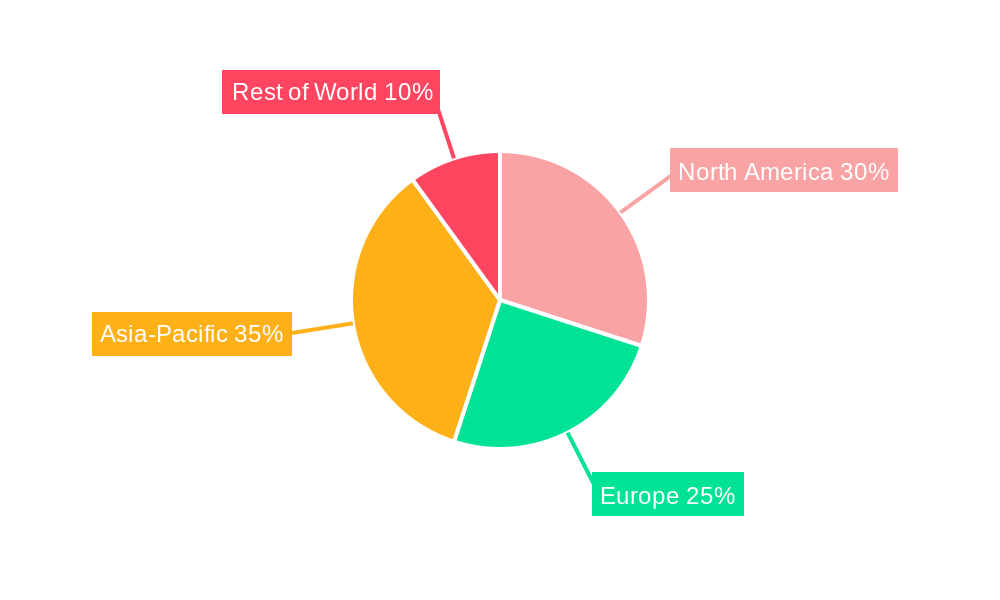
Plasma Etching Equipment For Solar Cell Regional Market Share
Geographic Coverage of Plasma Etching Equipment For Solar Cell
Plasma Etching Equipment For Solar Cell REPORT HIGHLIGHTS
| Aspects | Details |
|---|---|
| Study Period | 2020-2034 |
| Base Year | 2025 |
| Estimated Year | 2026 |
| Forecast Period | 2026-2034 |
| Historical Period | 2020-2025 |
| Growth Rate | CAGR of XXX% from 2020-2034 |
| Segmentation |
|
Table of Contents
- 1. Introduction
- 1.1. Research Scope
- 1.2. Market Segmentation
- 1.3. Research Objective
- 1.4. Definitions and Assumptions
- 2. Executive Summary
- 2.1. Market Snapshot
- 3. Market Dynamics
- 3.1. Market Drivers
- 3.2. Market Restrains
- 3.3. Market Trends
- 3.4. Market Opportunities
- 4. Market Factor Analysis
- 4.1. Porters Five Forces
- 4.1.1. Bargaining Power of Suppliers
- 4.1.2. Bargaining Power of Buyers
- 4.1.3. Threat of New Entrants
- 4.1.4. Threat of Substitutes
- 4.1.5. Competitive Rivalry
- 4.2. PESTEL analysis
- 4.3. BCG Analysis
- 4.3.1. Stars (High Growth, High Market Share)
- 4.3.2. Cash Cows (Low Growth, High Market Share)
- 4.3.3. Question Mark (High Growth, Low Market Share)
- 4.3.4. Dogs (Low Growth, Low Market Share)
- 4.4. Ansoff Matrix Analysis
- 4.5. Supply Chain Analysis
- 4.6. Regulatory Landscape
- 4.7. Current Market Potential and Opportunity Assessment (TAM–SAM–SOM Framework)
- 4.8. DMV Analyst Note
- 4.1. Porters Five Forces
- 5. Market Analysis, Insights and Forecast 2021-2033
- 5.1. Market Analysis, Insights and Forecast - by Application
- 5.1.1. Traffic
- 5.1.2. Solar Building
- 5.1.3. Photovoltaic Power Station
- 5.1.4. Others
- 5.2. Market Analysis, Insights and Forecast - by Type
- 5.2.1. Sputter Etching
- 5.2.2. Chemical Etching
- 5.2.3. Physicochemical Etching
- 5.3. Market Analysis, Insights and Forecast - by Region
- 5.3.1. North America
- 5.3.2. South America
- 5.3.3. Europe
- 5.3.4. Middle East & Africa
- 5.3.5. Asia Pacific
- 5.1. Market Analysis, Insights and Forecast - by Application
- 6. Global Plasma Etching Equipment For Solar Cell Analysis, Insights and Forecast, 2021-2033
- 6.1. Market Analysis, Insights and Forecast - by Application
- 6.1.1. Traffic
- 6.1.2. Solar Building
- 6.1.3. Photovoltaic Power Station
- 6.1.4. Others
- 6.2. Market Analysis, Insights and Forecast - by Type
- 6.2.1. Sputter Etching
- 6.2.2. Chemical Etching
- 6.2.3. Physicochemical Etching
- 6.1. Market Analysis, Insights and Forecast - by Application
- 7. North America Plasma Etching Equipment For Solar Cell Analysis, Insights and Forecast, 2020-2032
- 7.1. Market Analysis, Insights and Forecast - by Application
- 7.1.1. Traffic
- 7.1.2. Solar Building
- 7.1.3. Photovoltaic Power Station
- 7.1.4. Others
- 7.2. Market Analysis, Insights and Forecast - by Type
- 7.2.1. Sputter Etching
- 7.2.2. Chemical Etching
- 7.2.3. Physicochemical Etching
- 7.1. Market Analysis, Insights and Forecast - by Application
- 8. South America Plasma Etching Equipment For Solar Cell Analysis, Insights and Forecast, 2020-2032
- 8.1. Market Analysis, Insights and Forecast - by Application
- 8.1.1. Traffic
- 8.1.2. Solar Building
- 8.1.3. Photovoltaic Power Station
- 8.1.4. Others
- 8.2. Market Analysis, Insights and Forecast - by Type
- 8.2.1. Sputter Etching
- 8.2.2. Chemical Etching
- 8.2.3. Physicochemical Etching
- 8.1. Market Analysis, Insights and Forecast - by Application
- 9. Europe Plasma Etching Equipment For Solar Cell Analysis, Insights and Forecast, 2020-2032
- 9.1. Market Analysis, Insights and Forecast - by Application
- 9.1.1. Traffic
- 9.1.2. Solar Building
- 9.1.3. Photovoltaic Power Station
- 9.1.4. Others
- 9.2. Market Analysis, Insights and Forecast - by Type
- 9.2.1. Sputter Etching
- 9.2.2. Chemical Etching
- 9.2.3. Physicochemical Etching
- 9.1. Market Analysis, Insights and Forecast - by Application
- 10. Middle East & Africa Plasma Etching Equipment For Solar Cell Analysis, Insights and Forecast, 2020-2032
- 10.1. Market Analysis, Insights and Forecast - by Application
- 10.1.1. Traffic
- 10.1.2. Solar Building
- 10.1.3. Photovoltaic Power Station
- 10.1.4. Others
- 10.2. Market Analysis, Insights and Forecast - by Type
- 10.2.1. Sputter Etching
- 10.2.2. Chemical Etching
- 10.2.3. Physicochemical Etching
- 10.1. Market Analysis, Insights and Forecast - by Application
- 11. Asia Pacific Plasma Etching Equipment For Solar Cell Analysis, Insights and Forecast, 2020-2032
- 11.1. Market Analysis, Insights and Forecast - by Application
- 11.1.1. Traffic
- 11.1.2. Solar Building
- 11.1.3. Photovoltaic Power Station
- 11.1.4. Others
- 11.2. Market Analysis, Insights and Forecast - by Type
- 11.2.1. Sputter Etching
- 11.2.2. Chemical Etching
- 11.2.3. Physicochemical Etching
- 11.1. Market Analysis, Insights and Forecast - by Application
- 12. Competitive Analysis
- 12.1. Company Profiles
- 12.1.1 SEMCO TECHNOLOGIES
- 12.1.1.1. Company Overview
- 12.1.1.2. Products
- 12.1.1.3. Company Financials
- 12.1.1.4. SWOT Analysis
- 12.1.2 Sentech Instruments
- 12.1.2.1. Company Overview
- 12.1.2.2. Products
- 12.1.2.3. Company Financials
- 12.1.2.4. SWOT Analysis
- 12.1.3 Syskey Technology
- 12.1.3.1. Company Overview
- 12.1.3.2. Products
- 12.1.3.3. Company Financials
- 12.1.3.4. SWOT Analysis
- 12.1.4 ULVAC
- 12.1.4.1. Company Overview
- 12.1.4.2. Products
- 12.1.4.3. Company Financials
- 12.1.4.4. SWOT Analysis
- 12.1.5 Applied Materials
- 12.1.5.1. Company Overview
- 12.1.5.2. Products
- 12.1.5.3. Company Financials
- 12.1.5.4. SWOT Analysis
- 12.1.6 Hitachi High-Technologies
- 12.1.6.1. Company Overview
- 12.1.6.2. Products
- 12.1.6.3. Company Financials
- 12.1.6.4. SWOT Analysis
- 12.1.7 Plasma Etch
- 12.1.7.1. Company Overview
- 12.1.7.2. Products
- 12.1.7.3. Company Financials
- 12.1.7.4. SWOT Analysis
- 12.1.1 SEMCO TECHNOLOGIES
- 12.2. Market Entropy
- 12.2.1 Company's Key Areas Served
- 12.2.2 Recent Developments
- 12.3. Company Market Share Analysis 2025
- 12.3.1 Top 5 Companies Market Share Analysis
- 12.3.2 Top 3 Companies Market Share Analysis
- 12.4. List of Potential Customers
- 13. Research Methodology
List of Figures
- Figure 1: Global Plasma Etching Equipment For Solar Cell Revenue Breakdown (million, %) by Region 2025 & 2033
- Figure 2: Global Plasma Etching Equipment For Solar Cell Volume Breakdown (K, %) by Region 2025 & 2033
- Figure 3: North America Plasma Etching Equipment For Solar Cell Revenue (million), by Application 2025 & 2033
- Figure 4: North America Plasma Etching Equipment For Solar Cell Volume (K), by Application 2025 & 2033
- Figure 5: North America Plasma Etching Equipment For Solar Cell Revenue Share (%), by Application 2025 & 2033
- Figure 6: North America Plasma Etching Equipment For Solar Cell Volume Share (%), by Application 2025 & 2033
- Figure 7: North America Plasma Etching Equipment For Solar Cell Revenue (million), by Type 2025 & 2033
- Figure 8: North America Plasma Etching Equipment For Solar Cell Volume (K), by Type 2025 & 2033
- Figure 9: North America Plasma Etching Equipment For Solar Cell Revenue Share (%), by Type 2025 & 2033
- Figure 10: North America Plasma Etching Equipment For Solar Cell Volume Share (%), by Type 2025 & 2033
- Figure 11: North America Plasma Etching Equipment For Solar Cell Revenue (million), by Country 2025 & 2033
- Figure 12: North America Plasma Etching Equipment For Solar Cell Volume (K), by Country 2025 & 2033
- Figure 13: North America Plasma Etching Equipment For Solar Cell Revenue Share (%), by Country 2025 & 2033
- Figure 14: North America Plasma Etching Equipment For Solar Cell Volume Share (%), by Country 2025 & 2033
- Figure 15: South America Plasma Etching Equipment For Solar Cell Revenue (million), by Application 2025 & 2033
- Figure 16: South America Plasma Etching Equipment For Solar Cell Volume (K), by Application 2025 & 2033
- Figure 17: South America Plasma Etching Equipment For Solar Cell Revenue Share (%), by Application 2025 & 2033
- Figure 18: South America Plasma Etching Equipment For Solar Cell Volume Share (%), by Application 2025 & 2033
- Figure 19: South America Plasma Etching Equipment For Solar Cell Revenue (million), by Type 2025 & 2033
- Figure 20: South America Plasma Etching Equipment For Solar Cell Volume (K), by Type 2025 & 2033
- Figure 21: South America Plasma Etching Equipment For Solar Cell Revenue Share (%), by Type 2025 & 2033
- Figure 22: South America Plasma Etching Equipment For Solar Cell Volume Share (%), by Type 2025 & 2033
- Figure 23: South America Plasma Etching Equipment For Solar Cell Revenue (million), by Country 2025 & 2033
- Figure 24: South America Plasma Etching Equipment For Solar Cell Volume (K), by Country 2025 & 2033
- Figure 25: South America Plasma Etching Equipment For Solar Cell Revenue Share (%), by Country 2025 & 2033
- Figure 26: South America Plasma Etching Equipment For Solar Cell Volume Share (%), by Country 2025 & 2033
- Figure 27: Europe Plasma Etching Equipment For Solar Cell Revenue (million), by Application 2025 & 2033
- Figure 28: Europe Plasma Etching Equipment For Solar Cell Volume (K), by Application 2025 & 2033
- Figure 29: Europe Plasma Etching Equipment For Solar Cell Revenue Share (%), by Application 2025 & 2033
- Figure 30: Europe Plasma Etching Equipment For Solar Cell Volume Share (%), by Application 2025 & 2033
- Figure 31: Europe Plasma Etching Equipment For Solar Cell Revenue (million), by Type 2025 & 2033
- Figure 32: Europe Plasma Etching Equipment For Solar Cell Volume (K), by Type 2025 & 2033
- Figure 33: Europe Plasma Etching Equipment For Solar Cell Revenue Share (%), by Type 2025 & 2033
- Figure 34: Europe Plasma Etching Equipment For Solar Cell Volume Share (%), by Type 2025 & 2033
- Figure 35: Europe Plasma Etching Equipment For Solar Cell Revenue (million), by Country 2025 & 2033
- Figure 36: Europe Plasma Etching Equipment For Solar Cell Volume (K), by Country 2025 & 2033
- Figure 37: Europe Plasma Etching Equipment For Solar Cell Revenue Share (%), by Country 2025 & 2033
- Figure 38: Europe Plasma Etching Equipment For Solar Cell Volume Share (%), by Country 2025 & 2033
- Figure 39: Middle East & Africa Plasma Etching Equipment For Solar Cell Revenue (million), by Application 2025 & 2033
- Figure 40: Middle East & Africa Plasma Etching Equipment For Solar Cell Volume (K), by Application 2025 & 2033
- Figure 41: Middle East & Africa Plasma Etching Equipment For Solar Cell Revenue Share (%), by Application 2025 & 2033
- Figure 42: Middle East & Africa Plasma Etching Equipment For Solar Cell Volume Share (%), by Application 2025 & 2033
- Figure 43: Middle East & Africa Plasma Etching Equipment For Solar Cell Revenue (million), by Type 2025 & 2033
- Figure 44: Middle East & Africa Plasma Etching Equipment For Solar Cell Volume (K), by Type 2025 & 2033
- Figure 45: Middle East & Africa Plasma Etching Equipment For Solar Cell Revenue Share (%), by Type 2025 & 2033
- Figure 46: Middle East & Africa Plasma Etching Equipment For Solar Cell Volume Share (%), by Type 2025 & 2033
- Figure 47: Middle East & Africa Plasma Etching Equipment For Solar Cell Revenue (million), by Country 2025 & 2033
- Figure 48: Middle East & Africa Plasma Etching Equipment For Solar Cell Volume (K), by Country 2025 & 2033
- Figure 49: Middle East & Africa Plasma Etching Equipment For Solar Cell Revenue Share (%), by Country 2025 & 2033
- Figure 50: Middle East & Africa Plasma Etching Equipment For Solar Cell Volume Share (%), by Country 2025 & 2033
- Figure 51: Asia Pacific Plasma Etching Equipment For Solar Cell Revenue (million), by Application 2025 & 2033
- Figure 52: Asia Pacific Plasma Etching Equipment For Solar Cell Volume (K), by Application 2025 & 2033
- Figure 53: Asia Pacific Plasma Etching Equipment For Solar Cell Revenue Share (%), by Application 2025 & 2033
- Figure 54: Asia Pacific Plasma Etching Equipment For Solar Cell Volume Share (%), by Application 2025 & 2033
- Figure 55: Asia Pacific Plasma Etching Equipment For Solar Cell Revenue (million), by Type 2025 & 2033
- Figure 56: Asia Pacific Plasma Etching Equipment For Solar Cell Volume (K), by Type 2025 & 2033
- Figure 57: Asia Pacific Plasma Etching Equipment For Solar Cell Revenue Share (%), by Type 2025 & 2033
- Figure 58: Asia Pacific Plasma Etching Equipment For Solar Cell Volume Share (%), by Type 2025 & 2033
- Figure 59: Asia Pacific Plasma Etching Equipment For Solar Cell Revenue (million), by Country 2025 & 2033
- Figure 60: Asia Pacific Plasma Etching Equipment For Solar Cell Volume (K), by Country 2025 & 2033
- Figure 61: Asia Pacific Plasma Etching Equipment For Solar Cell Revenue Share (%), by Country 2025 & 2033
- Figure 62: Asia Pacific Plasma Etching Equipment For Solar Cell Volume Share (%), by Country 2025 & 2033
List of Tables
- Table 1: Global Plasma Etching Equipment For Solar Cell Revenue million Forecast, by Application 2020 & 2033
- Table 2: Global Plasma Etching Equipment For Solar Cell Volume K Forecast, by Application 2020 & 2033
- Table 3: Global Plasma Etching Equipment For Solar Cell Revenue million Forecast, by Type 2020 & 2033
- Table 4: Global Plasma Etching Equipment For Solar Cell Volume K Forecast, by Type 2020 & 2033
- Table 5: Global Plasma Etching Equipment For Solar Cell Revenue million Forecast, by Region 2020 & 2033
- Table 6: Global Plasma Etching Equipment For Solar Cell Volume K Forecast, by Region 2020 & 2033
- Table 7: Global Plasma Etching Equipment For Solar Cell Revenue million Forecast, by Application 2020 & 2033
- Table 8: Global Plasma Etching Equipment For Solar Cell Volume K Forecast, by Application 2020 & 2033
- Table 9: Global Plasma Etching Equipment For Solar Cell Revenue million Forecast, by Type 2020 & 2033
- Table 10: Global Plasma Etching Equipment For Solar Cell Volume K Forecast, by Type 2020 & 2033
- Table 11: Global Plasma Etching Equipment For Solar Cell Revenue million Forecast, by Country 2020 & 2033
- Table 12: Global Plasma Etching Equipment For Solar Cell Volume K Forecast, by Country 2020 & 2033
- Table 13: United States Plasma Etching Equipment For Solar Cell Revenue (million) Forecast, by Application 2020 & 2033
- Table 14: United States Plasma Etching Equipment For Solar Cell Volume (K) Forecast, by Application 2020 & 2033
- Table 15: Canada Plasma Etching Equipment For Solar Cell Revenue (million) Forecast, by Application 2020 & 2033
- Table 16: Canada Plasma Etching Equipment For Solar Cell Volume (K) Forecast, by Application 2020 & 2033
- Table 17: Mexico Plasma Etching Equipment For Solar Cell Revenue (million) Forecast, by Application 2020 & 2033
- Table 18: Mexico Plasma Etching Equipment For Solar Cell Volume (K) Forecast, by Application 2020 & 2033
- Table 19: Global Plasma Etching Equipment For Solar Cell Revenue million Forecast, by Application 2020 & 2033
- Table 20: Global Plasma Etching Equipment For Solar Cell Volume K Forecast, by Application 2020 & 2033
- Table 21: Global Plasma Etching Equipment For Solar Cell Revenue million Forecast, by Type 2020 & 2033
- Table 22: Global Plasma Etching Equipment For Solar Cell Volume K Forecast, by Type 2020 & 2033
- Table 23: Global Plasma Etching Equipment For Solar Cell Revenue million Forecast, by Country 2020 & 2033
- Table 24: Global Plasma Etching Equipment For Solar Cell Volume K Forecast, by Country 2020 & 2033
- Table 25: Brazil Plasma Etching Equipment For Solar Cell Revenue (million) Forecast, by Application 2020 & 2033
- Table 26: Brazil Plasma Etching Equipment For Solar Cell Volume (K) Forecast, by Application 2020 & 2033
- Table 27: Argentina Plasma Etching Equipment For Solar Cell Revenue (million) Forecast, by Application 2020 & 2033
- Table 28: Argentina Plasma Etching Equipment For Solar Cell Volume (K) Forecast, by Application 2020 & 2033
- Table 29: Rest of South America Plasma Etching Equipment For Solar Cell Revenue (million) Forecast, by Application 2020 & 2033
- Table 30: Rest of South America Plasma Etching Equipment For Solar Cell Volume (K) Forecast, by Application 2020 & 2033
- Table 31: Global Plasma Etching Equipment For Solar Cell Revenue million Forecast, by Application 2020 & 2033
- Table 32: Global Plasma Etching Equipment For Solar Cell Volume K Forecast, by Application 2020 & 2033
- Table 33: Global Plasma Etching Equipment For Solar Cell Revenue million Forecast, by Type 2020 & 2033
- Table 34: Global Plasma Etching Equipment For Solar Cell Volume K Forecast, by Type 2020 & 2033
- Table 35: Global Plasma Etching Equipment For Solar Cell Revenue million Forecast, by Country 2020 & 2033
- Table 36: Global Plasma Etching Equipment For Solar Cell Volume K Forecast, by Country 2020 & 2033
- Table 37: United Kingdom Plasma Etching Equipment For Solar Cell Revenue (million) Forecast, by Application 2020 & 2033
- Table 38: United Kingdom Plasma Etching Equipment For Solar Cell Volume (K) Forecast, by Application 2020 & 2033
- Table 39: Germany Plasma Etching Equipment For Solar Cell Revenue (million) Forecast, by Application 2020 & 2033
- Table 40: Germany Plasma Etching Equipment For Solar Cell Volume (K) Forecast, by Application 2020 & 2033
- Table 41: France Plasma Etching Equipment For Solar Cell Revenue (million) Forecast, by Application 2020 & 2033
- Table 42: France Plasma Etching Equipment For Solar Cell Volume (K) Forecast, by Application 2020 & 2033
- Table 43: Italy Plasma Etching Equipment For Solar Cell Revenue (million) Forecast, by Application 2020 & 2033
- Table 44: Italy Plasma Etching Equipment For Solar Cell Volume (K) Forecast, by Application 2020 & 2033
- Table 45: Spain Plasma Etching Equipment For Solar Cell Revenue (million) Forecast, by Application 2020 & 2033
- Table 46: Spain Plasma Etching Equipment For Solar Cell Volume (K) Forecast, by Application 2020 & 2033
- Table 47: Russia Plasma Etching Equipment For Solar Cell Revenue (million) Forecast, by Application 2020 & 2033
- Table 48: Russia Plasma Etching Equipment For Solar Cell Volume (K) Forecast, by Application 2020 & 2033
- Table 49: Benelux Plasma Etching Equipment For Solar Cell Revenue (million) Forecast, by Application 2020 & 2033
- Table 50: Benelux Plasma Etching Equipment For Solar Cell Volume (K) Forecast, by Application 2020 & 2033
- Table 51: Nordics Plasma Etching Equipment For Solar Cell Revenue (million) Forecast, by Application 2020 & 2033
- Table 52: Nordics Plasma Etching Equipment For Solar Cell Volume (K) Forecast, by Application 2020 & 2033
- Table 53: Rest of Europe Plasma Etching Equipment For Solar Cell Revenue (million) Forecast, by Application 2020 & 2033
- Table 54: Rest of Europe Plasma Etching Equipment For Solar Cell Volume (K) Forecast, by Application 2020 & 2033
- Table 55: Global Plasma Etching Equipment For Solar Cell Revenue million Forecast, by Application 2020 & 2033
- Table 56: Global Plasma Etching Equipment For Solar Cell Volume K Forecast, by Application 2020 & 2033
- Table 57: Global Plasma Etching Equipment For Solar Cell Revenue million Forecast, by Type 2020 & 2033
- Table 58: Global Plasma Etching Equipment For Solar Cell Volume K Forecast, by Type 2020 & 2033
- Table 59: Global Plasma Etching Equipment For Solar Cell Revenue million Forecast, by Country 2020 & 2033
- Table 60: Global Plasma Etching Equipment For Solar Cell Volume K Forecast, by Country 2020 & 2033
- Table 61: Turkey Plasma Etching Equipment For Solar Cell Revenue (million) Forecast, by Application 2020 & 2033
- Table 62: Turkey Plasma Etching Equipment For Solar Cell Volume (K) Forecast, by Application 2020 & 2033
- Table 63: Israel Plasma Etching Equipment For Solar Cell Revenue (million) Forecast, by Application 2020 & 2033
- Table 64: Israel Plasma Etching Equipment For Solar Cell Volume (K) Forecast, by Application 2020 & 2033
- Table 65: GCC Plasma Etching Equipment For Solar Cell Revenue (million) Forecast, by Application 2020 & 2033
- Table 66: GCC Plasma Etching Equipment For Solar Cell Volume (K) Forecast, by Application 2020 & 2033
- Table 67: North Africa Plasma Etching Equipment For Solar Cell Revenue (million) Forecast, by Application 2020 & 2033
- Table 68: North Africa Plasma Etching Equipment For Solar Cell Volume (K) Forecast, by Application 2020 & 2033
- Table 69: South Africa Plasma Etching Equipment For Solar Cell Revenue (million) Forecast, by Application 2020 & 2033
- Table 70: South Africa Plasma Etching Equipment For Solar Cell Volume (K) Forecast, by Application 2020 & 2033
- Table 71: Rest of Middle East & Africa Plasma Etching Equipment For Solar Cell Revenue (million) Forecast, by Application 2020 & 2033
- Table 72: Rest of Middle East & Africa Plasma Etching Equipment For Solar Cell Volume (K) Forecast, by Application 2020 & 2033
- Table 73: Global Plasma Etching Equipment For Solar Cell Revenue million Forecast, by Application 2020 & 2033
- Table 74: Global Plasma Etching Equipment For Solar Cell Volume K Forecast, by Application 2020 & 2033
- Table 75: Global Plasma Etching Equipment For Solar Cell Revenue million Forecast, by Type 2020 & 2033
- Table 76: Global Plasma Etching Equipment For Solar Cell Volume K Forecast, by Type 2020 & 2033
- Table 77: Global Plasma Etching Equipment For Solar Cell Revenue million Forecast, by Country 2020 & 2033
- Table 78: Global Plasma Etching Equipment For Solar Cell Volume K Forecast, by Country 2020 & 2033
- Table 79: China Plasma Etching Equipment For Solar Cell Revenue (million) Forecast, by Application 2020 & 2033
- Table 80: China Plasma Etching Equipment For Solar Cell Volume (K) Forecast, by Application 2020 & 2033
- Table 81: India Plasma Etching Equipment For Solar Cell Revenue (million) Forecast, by Application 2020 & 2033
- Table 82: India Plasma Etching Equipment For Solar Cell Volume (K) Forecast, by Application 2020 & 2033
- Table 83: Japan Plasma Etching Equipment For Solar Cell Revenue (million) Forecast, by Application 2020 & 2033
- Table 84: Japan Plasma Etching Equipment For Solar Cell Volume (K) Forecast, by Application 2020 & 2033
- Table 85: South Korea Plasma Etching Equipment For Solar Cell Revenue (million) Forecast, by Application 2020 & 2033
- Table 86: South Korea Plasma Etching Equipment For Solar Cell Volume (K) Forecast, by Application 2020 & 2033
- Table 87: ASEAN Plasma Etching Equipment For Solar Cell Revenue (million) Forecast, by Application 2020 & 2033
- Table 88: ASEAN Plasma Etching Equipment For Solar Cell Volume (K) Forecast, by Application 2020 & 2033
- Table 89: Oceania Plasma Etching Equipment For Solar Cell Revenue (million) Forecast, by Application 2020 & 2033
- Table 90: Oceania Plasma Etching Equipment For Solar Cell Volume (K) Forecast, by Application 2020 & 2033
- Table 91: Rest of Asia Pacific Plasma Etching Equipment For Solar Cell Revenue (million) Forecast, by Application 2020 & 2033
- Table 92: Rest of Asia Pacific Plasma Etching Equipment For Solar Cell Volume (K) Forecast, by Application 2020 & 2033
Frequently Asked Questions
1. What is the projected Compound Annual Growth Rate (CAGR) of the Plasma Etching Equipment For Solar Cell?
The projected CAGR is approximately XXX%.
2. Which companies are prominent players in the Plasma Etching Equipment For Solar Cell?
Key companies in the market include SEMCO TECHNOLOGIES, Sentech Instruments, Syskey Technology, ULVAC, Applied Materials, Hitachi High-Technologies, Plasma Etch.
3. What are the main segments of the Plasma Etching Equipment For Solar Cell?
The market segments include Application, Type.
4. Can you provide details about the market size?
The market size is estimated to be USD XXX million as of 2022.
5. What are some drivers contributing to market growth?
N/A
6. What are the notable trends driving market growth?
N/A
7. Are there any restraints impacting market growth?
N/A
8. Can you provide examples of recent developments in the market?
N/A
9. What pricing options are available for accessing the report?
Pricing options include single-user, multi-user, and enterprise licenses priced at USD 3950.00, USD 5925.00, and USD 7900.00 respectively.
10. Is the market size provided in terms of value or volume?
The market size is provided in terms of value, measured in million and volume, measured in K.
11. Are there any specific market keywords associated with the report?
Yes, the market keyword associated with the report is "Plasma Etching Equipment For Solar Cell," which aids in identifying and referencing the specific market segment covered.
12. How do I determine which pricing option suits my needs best?
The pricing options vary based on user requirements and access needs. Individual users may opt for single-user licenses, while businesses requiring broader access may choose multi-user or enterprise licenses for cost-effective access to the report.
13. Are there any additional resources or data provided in the Plasma Etching Equipment For Solar Cell report?
While the report offers comprehensive insights, it's advisable to review the specific contents or supplementary materials provided to ascertain if additional resources or data are available.
14. How can I stay updated on further developments or reports in the Plasma Etching Equipment For Solar Cell?
To stay informed about further developments, trends, and reports in the Plasma Etching Equipment For Solar Cell, consider subscribing to industry newsletters, following relevant companies and organizations, or regularly checking reputable industry news sources and publications.
Methodology
Step 1 - Identification of Relevant Samples Size from Population Database


Step 2 - Approaches for Defining Global Market Size (Value, Volume* & Price*)

Note*: In applicable scenarios
Step 3 - Data Sources
Primary Research
- Web Analytics
- Survey Reports
- Research Institute
- Latest Research Reports
- Opinion Leaders
Secondary Research
- Annual Reports
- White Paper
- Latest Press Release
- Industry Association
- Paid Database
- Investor Presentations

Step 4 - Data Triangulation
Involves using different sources of information in order to increase the validity of a study
These sources are likely to be stakeholders in a program - participants, other researchers, program staff, other community members, and so on.
Then we put all data in single framework & apply various statistical tools to find out the dynamic on the market.
During the analysis stage, feedback from the stakeholder groups would be compared to determine areas of agreement as well as areas of divergence