

Key Insights
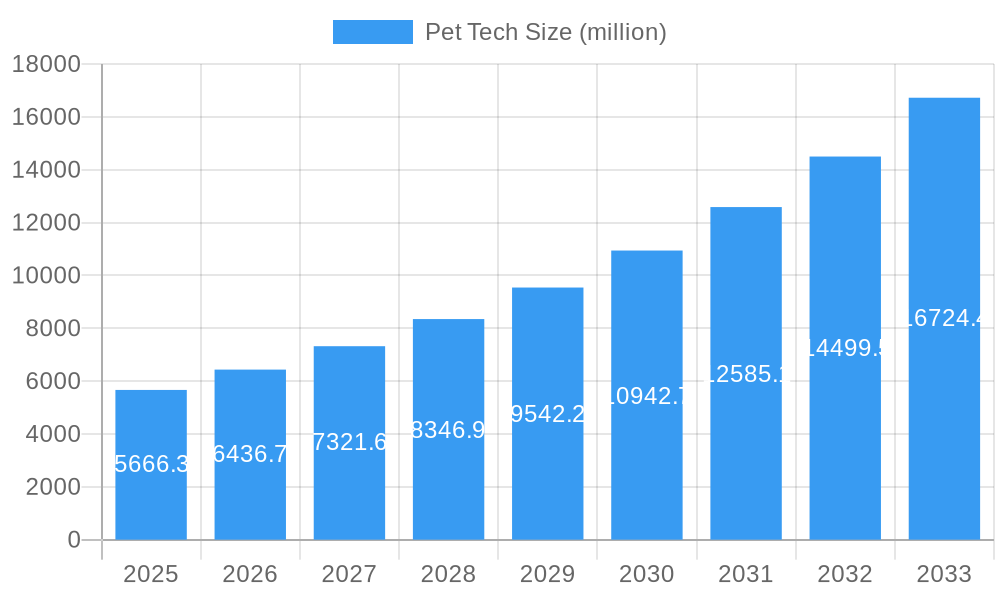
The global pet tech market, valued at $5,666.3 million in 2025, is experiencing robust growth, projected to expand at a Compound Annual Growth Rate (CAGR) of 13.6% from 2025 to 2033. This surge is driven by several key factors. Increasing pet ownership globally, coupled with rising pet humanization—treating pets as family members—fuels demand for innovative products enhancing pet health, safety, and overall well-being. Technological advancements, particularly in areas like AI, IoT (Internet of Things), and wearable technology, are creating sophisticated pet care solutions. Smart collars with GPS tracking, activity monitors, and health sensors are gaining popularity, alongside automated feeders, interactive toys, and even robotic companions. The market is further propelled by growing consumer awareness of pet health issues and a willingness to invest in preventative care and advanced diagnostics. Furthermore, the rise of e-commerce and subscription-based services facilitates greater accessibility to a wide range of pet tech products.
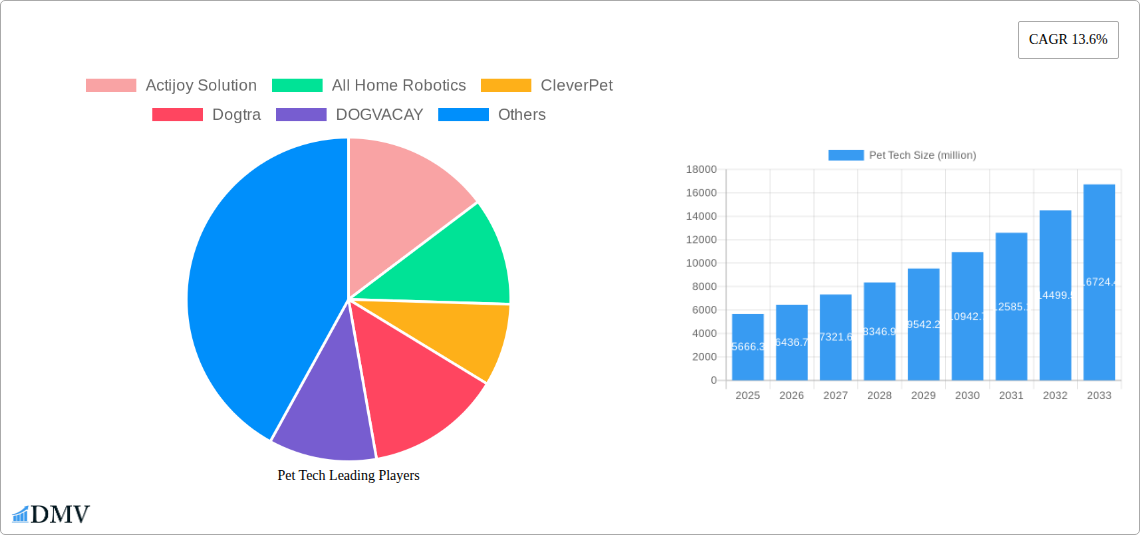
Pet Tech Market Size (In Billion)
The market segmentation is likely diverse, encompassing categories like wearables (fitness trackers, GPS trackers), smart feeders and waterers, automated grooming tools, pet health monitoring devices (smart scales, blood pressure monitors), training aids, entertainment devices (interactive toys), and even robotic companions. Key players like Garmin, GoPro, and others are actively shaping market dynamics through continuous innovation and product diversification. While challenges remain, including the cost of advanced technology and concerns regarding data privacy and security, the overall market trajectory remains overwhelmingly positive, fueled by a steadily increasing demand for better pet care and a tech-savvy pet owner base. The forecast period of 2025-2033 presents a significant opportunity for growth and market penetration for existing and new entrants alike.
Pet Tech Company Market Share
Pet Tech Market: A Comprehensive Report (2019-2033)
This insightful report provides a comprehensive analysis of the burgeoning Pet Tech market, projecting a multi-million dollar valuation by 2033. We delve into market dynamics, technological advancements, and key players, offering invaluable insights for stakeholders seeking to navigate this rapidly expanding sector. The study covers the period 2019-2033, with 2025 serving as the base and estimated year. Our forecast spans 2025-2033, building upon the historical data from 2019-2024.
Pet Tech Market Composition & Trends
This section dissects the current Pet Tech market landscape, analyzing market concentration, innovation drivers, regulatory frameworks, substitute products, end-user demographics, and M&A activity. We examine the market share distribution among key players, revealing a moderately concentrated market with several major players commanding significant shares. For instance, Garmin Ltd. and Mars Incorporated likely hold a combined xx% market share in 2025, while smaller players like Actijoy Solution and Fitbark contribute with xx% and xx%, respectively. The total market size in 2025 is estimated at $xx million.
Market Concentration & Dynamics:
- High competition among established players and emerging startups
- Strategic partnerships and collaborations driving innovation
- Market share fragmentation with a few dominant players
- M&A activity valued at approximately $xx million in 2024, indicating consolidation trends.
Innovation Catalysts & Regulatory Landscape:
- Advancements in AI, IoT, and sensor technologies are fueling innovation.
- Stringent regulations regarding data privacy and pet safety are shaping market dynamics.
- The growing awareness of pet health and wellness is creating demand for innovative solutions.
Pet Tech Industry Evolution
This section examines the evolution of the Pet Tech industry, charting market growth trajectories, highlighting technological advancements, and analyzing shifts in consumer preferences. The market is experiencing robust growth, with a Compound Annual Growth Rate (CAGR) of xx% projected from 2025 to 2033. This expansion is fueled by factors like increasing pet ownership, rising disposable incomes, and the growing acceptance of technology in pet care. Adoption rates for smart pet collars, for example, are expected to reach xx% by 2033.
Technological advancements in areas like AI-powered pet monitoring and personalized nutrition are key drivers. Consumer demand is shifting towards personalized, data-driven solutions offering greater convenience and enhanced pet well-being. This includes demand for AI-powered health monitoring, remote pet care features, and smart feeders that provide tailored nutrition plans, all contributing to increased market value.
Leading Regions, Countries, or Segments in Pet Tech
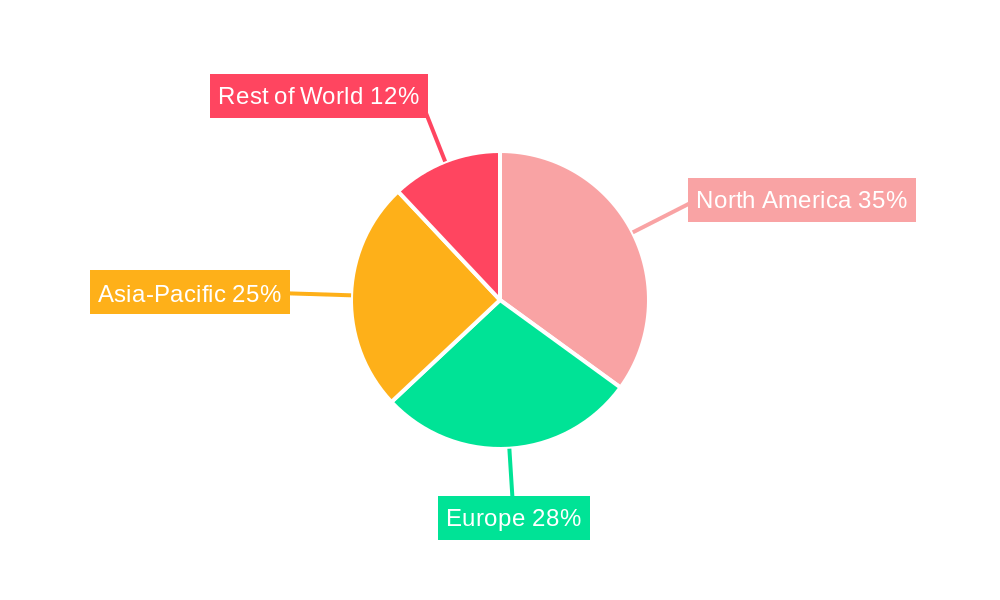
North America and Europe currently dominate the Pet Tech market, driven by high pet ownership rates, advanced technological infrastructure, and increased consumer spending on pet-related products and services. However, Asia-Pacific is anticipated to witness significant growth during the forecast period.
Key Drivers of Market Dominance:
- North America: High pet ownership, advanced technological infrastructure, strong regulatory support for pet tech products, significant investments in R&D.
- Europe: High consumer spending on pet products, strong awareness of animal welfare, favorable regulatory environment supporting innovation.
- Asia-Pacific: Rising disposable incomes, increased pet ownership, growing adoption of smart technology, potential for significant market expansion.
The strong performance of these regions is further fueled by factors like increased government investments and strong regulatory support, driving advancements in the sector.
Pet Tech Product Innovations
The Pet Tech sector showcases continuous innovation, with product applications ranging from GPS trackers and activity monitors to smart feeders and automated litter boxes. Unique selling propositions often center on improved convenience, enhanced pet health monitoring, or data-driven insights into pet behavior. For example, the integration of AI algorithms allows for more personalized health and behavior monitoring, contributing to better pet care and early detection of potential problems. Furthermore, the development of sophisticated sensors and wearables is leading to improved accuracy and data reliability in health tracking applications.
Propelling Factors for Pet Tech Growth
Several factors propel the growth of the Pet Tech market. Technological advancements, such as improved sensors, AI algorithms, and connectivity, are enabling the development of innovative products. The rising disposable incomes globally are increasing consumer spending on pet products, thus driving market expansion. Furthermore, supportive government regulations and investments fuel further innovations within the sector. The growing awareness of pet wellness and the associated demand for better pet care products directly stimulates market growth.
Obstacles in the Pet Tech Market
Despite its strong growth trajectory, the Pet Tech market faces certain obstacles. Regulatory hurdles, particularly concerning data privacy and product safety, can hinder market expansion. Supply chain disruptions caused by global events can impact production and distribution, leading to price fluctuations. Intense competition among established players and new entrants creates pressure on profit margins. These challenges need to be effectively managed for sustained market growth.
Future Opportunities in Pet Tech
The future of Pet Tech holds immense potential. Emerging markets in developing economies present significant opportunities for expansion. Advancements in technologies like AI and machine learning will create innovative solutions for enhanced pet health and well-being. Changing consumer preferences towards more personalized and data-driven pet care solutions will further expand the market. Integration of Pet Tech solutions with veterinary services offers potential for revolutionizing pet healthcare.
Major Players in the Pet Tech Ecosystem
- Actijoy Solution
- All Home Robotics
- CleverPet
- Dogtra
- DOGVACAY
- Felcana
- Fitbark
- Garmin Ltd.
- GoPro
- IceRobotics
- iFetch, LLC.
- Invoxia
- Konectera
- Loc8tor
- Lupine Pet
- Mars Incorporated
- Motorola
- Nedap N.V.
- Obe, Inc.
Key Developments in Pet Tech Industry
- 2023: Garmin launched a new line of smart pet collars with advanced health monitoring capabilities. This significantly impacted market dynamics by driving competition.
- 2022: Mars Incorporated acquired a leading pet tech startup, strengthening its market position and expanding its product portfolio. This M&A activity significantly impacted market consolidation.
- 2021: A significant number of new players entered the market, leading to increased competition and innovation.
- 2020: The COVID-19 pandemic accelerated the adoption of remote pet care technologies, boosting market demand.
Strategic Pet Tech Market Forecast
The Pet Tech market is poised for substantial growth, driven by technological innovation, increasing pet ownership, and rising consumer spending. Continued advancements in AI and IoT will enable the development of more sophisticated and personalized pet care solutions, further fueling market expansion. The increasing demand for remote pet care services and connected devices will contribute to significant revenue growth. The forecast suggests a positive outlook, with the market anticipated to reach $xx million by 2033, driven by emerging trends and innovative product launches.
Pet Tech Segmentation
-
1. Application
- 1.1. Household
- 1.2. Commercial
-
2. Types
- 2.1. Pet Wearables
- 2.2. Smart Pet Crates & Beds
- 2.3. Smart Pet Doors
- 2.4. Smart Pet Feeders & Bowls
- 2.5. Smart Pet Fence
- 2.6. Smart Pet Toys
Pet Tech Segmentation By Geography
-
1. North America
- 1.1. United States
- 1.2. Canada
- 1.3. Mexico
-
2. South America
- 2.1. Brazil
- 2.2. Argentina
- 2.3. Rest of South America
-
3. Europe
- 3.1. United Kingdom
- 3.2. Germany
- 3.3. France
- 3.4. Italy
- 3.5. Spain
- 3.6. Russia
- 3.7. Benelux
- 3.8. Nordics
- 3.9. Rest of Europe
-
4. Middle East & Africa
- 4.1. Turkey
- 4.2. Israel
- 4.3. GCC
- 4.4. North Africa
- 4.5. South Africa
- 4.6. Rest of Middle East & Africa
-
5. Asia Pacific
- 5.1. China
- 5.2. India
- 5.3. Japan
- 5.4. South Korea
- 5.5. ASEAN
- 5.6. Oceania
- 5.7. Rest of Asia Pacific
Pet Tech Regional Market Share
Geographic Coverage of Pet Tech
Pet Tech REPORT HIGHLIGHTS
| Aspects | Details |
|---|---|
| Study Period | 2020-2034 |
| Base Year | 2025 |
| Estimated Year | 2026 |
| Forecast Period | 2026-2034 |
| Historical Period | 2020-2025 |
| Growth Rate | CAGR of 13.6% from 2020-2034 |
| Segmentation |
|
Table of Contents
- 1. Introduction
- 1.1. Research Scope
- 1.2. Market Segmentation
- 1.3. Research Objective
- 1.4. Definitions and Assumptions
- 2. Executive Summary
- 2.1. Market Snapshot
- 3. Market Dynamics
- 3.1. Market Drivers
- 3.2. Market Restrains
- 3.3. Market Trends
- 3.4. Market Opportunities
- 4. Market Factor Analysis
- 4.1. Porters Five Forces
- 4.1.1. Bargaining Power of Suppliers
- 4.1.2. Bargaining Power of Buyers
- 4.1.3. Threat of New Entrants
- 4.1.4. Threat of Substitutes
- 4.1.5. Competitive Rivalry
- 4.2. PESTEL analysis
- 4.3. BCG Analysis
- 4.3.1. Stars (High Growth, High Market Share)
- 4.3.2. Cash Cows (Low Growth, High Market Share)
- 4.3.3. Question Mark (High Growth, Low Market Share)
- 4.3.4. Dogs (Low Growth, Low Market Share)
- 4.4. Ansoff Matrix Analysis
- 4.5. Supply Chain Analysis
- 4.6. Regulatory Landscape
- 4.7. Current Market Potential and Opportunity Assessment (TAM–SAM–SOM Framework)
- 4.8. DMV Analyst Note
- 4.1. Porters Five Forces
- 5. Market Analysis, Insights and Forecast 2021-2033
- 5.1. Market Analysis, Insights and Forecast - by Application
- 5.1.1. Household
- 5.1.2. Commercial
- 5.2. Market Analysis, Insights and Forecast - by Types
- 5.2.1. Pet Wearables
- 5.2.2. Smart Pet Crates & Beds
- 5.2.3. Smart Pet Doors
- 5.2.4. Smart Pet Feeders & Bowls
- 5.2.5. Smart Pet Fence
- 5.2.6. Smart Pet Toys
- 5.3. Market Analysis, Insights and Forecast - by Region
- 5.3.1. North America
- 5.3.2. South America
- 5.3.3. Europe
- 5.3.4. Middle East & Africa
- 5.3.5. Asia Pacific
- 5.1. Market Analysis, Insights and Forecast - by Application
- 6. Global Pet Tech Analysis, Insights and Forecast, 2021-2033
- 6.1. Market Analysis, Insights and Forecast - by Application
- 6.1.1. Household
- 6.1.2. Commercial
- 6.2. Market Analysis, Insights and Forecast - by Types
- 6.2.1. Pet Wearables
- 6.2.2. Smart Pet Crates & Beds
- 6.2.3. Smart Pet Doors
- 6.2.4. Smart Pet Feeders & Bowls
- 6.2.5. Smart Pet Fence
- 6.2.6. Smart Pet Toys
- 6.1. Market Analysis, Insights and Forecast - by Application
- 7. North America Pet Tech Analysis, Insights and Forecast, 2020-2032
- 7.1. Market Analysis, Insights and Forecast - by Application
- 7.1.1. Household
- 7.1.2. Commercial
- 7.2. Market Analysis, Insights and Forecast - by Types
- 7.2.1. Pet Wearables
- 7.2.2. Smart Pet Crates & Beds
- 7.2.3. Smart Pet Doors
- 7.2.4. Smart Pet Feeders & Bowls
- 7.2.5. Smart Pet Fence
- 7.2.6. Smart Pet Toys
- 7.1. Market Analysis, Insights and Forecast - by Application
- 8. South America Pet Tech Analysis, Insights and Forecast, 2020-2032
- 8.1. Market Analysis, Insights and Forecast - by Application
- 8.1.1. Household
- 8.1.2. Commercial
- 8.2. Market Analysis, Insights and Forecast - by Types
- 8.2.1. Pet Wearables
- 8.2.2. Smart Pet Crates & Beds
- 8.2.3. Smart Pet Doors
- 8.2.4. Smart Pet Feeders & Bowls
- 8.2.5. Smart Pet Fence
- 8.2.6. Smart Pet Toys
- 8.1. Market Analysis, Insights and Forecast - by Application
- 9. Europe Pet Tech Analysis, Insights and Forecast, 2020-2032
- 9.1. Market Analysis, Insights and Forecast - by Application
- 9.1.1. Household
- 9.1.2. Commercial
- 9.2. Market Analysis, Insights and Forecast - by Types
- 9.2.1. Pet Wearables
- 9.2.2. Smart Pet Crates & Beds
- 9.2.3. Smart Pet Doors
- 9.2.4. Smart Pet Feeders & Bowls
- 9.2.5. Smart Pet Fence
- 9.2.6. Smart Pet Toys
- 9.1. Market Analysis, Insights and Forecast - by Application
- 10. Middle East & Africa Pet Tech Analysis, Insights and Forecast, 2020-2032
- 10.1. Market Analysis, Insights and Forecast - by Application
- 10.1.1. Household
- 10.1.2. Commercial
- 10.2. Market Analysis, Insights and Forecast - by Types
- 10.2.1. Pet Wearables
- 10.2.2. Smart Pet Crates & Beds
- 10.2.3. Smart Pet Doors
- 10.2.4. Smart Pet Feeders & Bowls
- 10.2.5. Smart Pet Fence
- 10.2.6. Smart Pet Toys
- 10.1. Market Analysis, Insights and Forecast - by Application
- 11. Asia Pacific Pet Tech Analysis, Insights and Forecast, 2020-2032
- 11.1. Market Analysis, Insights and Forecast - by Application
- 11.1.1. Household
- 11.1.2. Commercial
- 11.2. Market Analysis, Insights and Forecast - by Types
- 11.2.1. Pet Wearables
- 11.2.2. Smart Pet Crates & Beds
- 11.2.3. Smart Pet Doors
- 11.2.4. Smart Pet Feeders & Bowls
- 11.2.5. Smart Pet Fence
- 11.2.6. Smart Pet Toys
- 11.1. Market Analysis, Insights and Forecast - by Application
- 12. Competitive Analysis
- 12.1. Company Profiles
- 12.1.1 Actijoy Solution
- 12.1.1.1. Company Overview
- 12.1.1.2. Products
- 12.1.1.3. Company Financials
- 12.1.1.4. SWOT Analysis
- 12.1.2 All Home Robotics
- 12.1.2.1. Company Overview
- 12.1.2.2. Products
- 12.1.2.3. Company Financials
- 12.1.2.4. SWOT Analysis
- 12.1.3 CleverPet
- 12.1.3.1. Company Overview
- 12.1.3.2. Products
- 12.1.3.3. Company Financials
- 12.1.3.4. SWOT Analysis
- 12.1.4 Dogtra
- 12.1.4.1. Company Overview
- 12.1.4.2. Products
- 12.1.4.3. Company Financials
- 12.1.4.4. SWOT Analysis
- 12.1.5 DOGVACAY
- 12.1.5.1. Company Overview
- 12.1.5.2. Products
- 12.1.5.3. Company Financials
- 12.1.5.4. SWOT Analysis
- 12.1.6 Felcana
- 12.1.6.1. Company Overview
- 12.1.6.2. Products
- 12.1.6.3. Company Financials
- 12.1.6.4. SWOT Analysis
- 12.1.7 Fitbark
- 12.1.7.1. Company Overview
- 12.1.7.2. Products
- 12.1.7.3. Company Financials
- 12.1.7.4. SWOT Analysis
- 12.1.8 Garmin Ltd.
- 12.1.8.1. Company Overview
- 12.1.8.2. Products
- 12.1.8.3. Company Financials
- 12.1.8.4. SWOT Analysis
- 12.1.9 GoPro
- 12.1.9.1. Company Overview
- 12.1.9.2. Products
- 12.1.9.3. Company Financials
- 12.1.9.4. SWOT Analysis
- 12.1.10 IceRobotics
- 12.1.10.1. Company Overview
- 12.1.10.2. Products
- 12.1.10.3. Company Financials
- 12.1.10.4. SWOT Analysis
- 12.1.11 iFetch
- 12.1.11.1. Company Overview
- 12.1.11.2. Products
- 12.1.11.3. Company Financials
- 12.1.11.4. SWOT Analysis
- 12.1.12 LLC.
- 12.1.12.1. Company Overview
- 12.1.12.2. Products
- 12.1.12.3. Company Financials
- 12.1.12.4. SWOT Analysis
- 12.1.13 Invoxia
- 12.1.13.1. Company Overview
- 12.1.13.2. Products
- 12.1.13.3. Company Financials
- 12.1.13.4. SWOT Analysis
- 12.1.14 Konectera
- 12.1.14.1. Company Overview
- 12.1.14.2. Products
- 12.1.14.3. Company Financials
- 12.1.14.4. SWOT Analysis
- 12.1.15 Loc8tor
- 12.1.15.1. Company Overview
- 12.1.15.2. Products
- 12.1.15.3. Company Financials
- 12.1.15.4. SWOT Analysis
- 12.1.16 Lupine Pet
- 12.1.16.1. Company Overview
- 12.1.16.2. Products
- 12.1.16.3. Company Financials
- 12.1.16.4. SWOT Analysis
- 12.1.17 Mars Incorporated
- 12.1.17.1. Company Overview
- 12.1.17.2. Products
- 12.1.17.3. Company Financials
- 12.1.17.4. SWOT Analysis
- 12.1.18 Motorola
- 12.1.18.1. Company Overview
- 12.1.18.2. Products
- 12.1.18.3. Company Financials
- 12.1.18.4. SWOT Analysis
- 12.1.19 Nedap N.V.
- 12.1.19.1. Company Overview
- 12.1.19.2. Products
- 12.1.19.3. Company Financials
- 12.1.19.4. SWOT Analysis
- 12.1.20 Obe
- 12.1.20.1. Company Overview
- 12.1.20.2. Products
- 12.1.20.3. Company Financials
- 12.1.20.4. SWOT Analysis
- 12.1.21 Inc.
- 12.1.21.1. Company Overview
- 12.1.21.2. Products
- 12.1.21.3. Company Financials
- 12.1.21.4. SWOT Analysis
- 12.1.1 Actijoy Solution
- 12.2. Market Entropy
- 12.2.1 Company's Key Areas Served
- 12.2.2 Recent Developments
- 12.3. Company Market Share Analysis 2025
- 12.3.1 Top 5 Companies Market Share Analysis
- 12.3.2 Top 3 Companies Market Share Analysis
- 12.4. List of Potential Customers
- 13. Research Methodology
List of Figures
- Figure 1: Global Pet Tech Revenue Breakdown (million, %) by Region 2025 & 2033
- Figure 2: North America Pet Tech Revenue (million), by Application 2025 & 2033
- Figure 3: North America Pet Tech Revenue Share (%), by Application 2025 & 2033
- Figure 4: North America Pet Tech Revenue (million), by Types 2025 & 2033
- Figure 5: North America Pet Tech Revenue Share (%), by Types 2025 & 2033
- Figure 6: North America Pet Tech Revenue (million), by Country 2025 & 2033
- Figure 7: North America Pet Tech Revenue Share (%), by Country 2025 & 2033
- Figure 8: South America Pet Tech Revenue (million), by Application 2025 & 2033
- Figure 9: South America Pet Tech Revenue Share (%), by Application 2025 & 2033
- Figure 10: South America Pet Tech Revenue (million), by Types 2025 & 2033
- Figure 11: South America Pet Tech Revenue Share (%), by Types 2025 & 2033
- Figure 12: South America Pet Tech Revenue (million), by Country 2025 & 2033
- Figure 13: South America Pet Tech Revenue Share (%), by Country 2025 & 2033
- Figure 14: Europe Pet Tech Revenue (million), by Application 2025 & 2033
- Figure 15: Europe Pet Tech Revenue Share (%), by Application 2025 & 2033
- Figure 16: Europe Pet Tech Revenue (million), by Types 2025 & 2033
- Figure 17: Europe Pet Tech Revenue Share (%), by Types 2025 & 2033
- Figure 18: Europe Pet Tech Revenue (million), by Country 2025 & 2033
- Figure 19: Europe Pet Tech Revenue Share (%), by Country 2025 & 2033
- Figure 20: Middle East & Africa Pet Tech Revenue (million), by Application 2025 & 2033
- Figure 21: Middle East & Africa Pet Tech Revenue Share (%), by Application 2025 & 2033
- Figure 22: Middle East & Africa Pet Tech Revenue (million), by Types 2025 & 2033
- Figure 23: Middle East & Africa Pet Tech Revenue Share (%), by Types 2025 & 2033
- Figure 24: Middle East & Africa Pet Tech Revenue (million), by Country 2025 & 2033
- Figure 25: Middle East & Africa Pet Tech Revenue Share (%), by Country 2025 & 2033
- Figure 26: Asia Pacific Pet Tech Revenue (million), by Application 2025 & 2033
- Figure 27: Asia Pacific Pet Tech Revenue Share (%), by Application 2025 & 2033
- Figure 28: Asia Pacific Pet Tech Revenue (million), by Types 2025 & 2033
- Figure 29: Asia Pacific Pet Tech Revenue Share (%), by Types 2025 & 2033
- Figure 30: Asia Pacific Pet Tech Revenue (million), by Country 2025 & 2033
- Figure 31: Asia Pacific Pet Tech Revenue Share (%), by Country 2025 & 2033
List of Tables
- Table 1: Global Pet Tech Revenue million Forecast, by Application 2020 & 2033
- Table 2: Global Pet Tech Revenue million Forecast, by Types 2020 & 2033
- Table 3: Global Pet Tech Revenue million Forecast, by Region 2020 & 2033
- Table 4: Global Pet Tech Revenue million Forecast, by Application 2020 & 2033
- Table 5: Global Pet Tech Revenue million Forecast, by Types 2020 & 2033
- Table 6: Global Pet Tech Revenue million Forecast, by Country 2020 & 2033
- Table 7: United States Pet Tech Revenue (million) Forecast, by Application 2020 & 2033
- Table 8: Canada Pet Tech Revenue (million) Forecast, by Application 2020 & 2033
- Table 9: Mexico Pet Tech Revenue (million) Forecast, by Application 2020 & 2033
- Table 10: Global Pet Tech Revenue million Forecast, by Application 2020 & 2033
- Table 11: Global Pet Tech Revenue million Forecast, by Types 2020 & 2033
- Table 12: Global Pet Tech Revenue million Forecast, by Country 2020 & 2033
- Table 13: Brazil Pet Tech Revenue (million) Forecast, by Application 2020 & 2033
- Table 14: Argentina Pet Tech Revenue (million) Forecast, by Application 2020 & 2033
- Table 15: Rest of South America Pet Tech Revenue (million) Forecast, by Application 2020 & 2033
- Table 16: Global Pet Tech Revenue million Forecast, by Application 2020 & 2033
- Table 17: Global Pet Tech Revenue million Forecast, by Types 2020 & 2033
- Table 18: Global Pet Tech Revenue million Forecast, by Country 2020 & 2033
- Table 19: United Kingdom Pet Tech Revenue (million) Forecast, by Application 2020 & 2033
- Table 20: Germany Pet Tech Revenue (million) Forecast, by Application 2020 & 2033
- Table 21: France Pet Tech Revenue (million) Forecast, by Application 2020 & 2033
- Table 22: Italy Pet Tech Revenue (million) Forecast, by Application 2020 & 2033
- Table 23: Spain Pet Tech Revenue (million) Forecast, by Application 2020 & 2033
- Table 24: Russia Pet Tech Revenue (million) Forecast, by Application 2020 & 2033
- Table 25: Benelux Pet Tech Revenue (million) Forecast, by Application 2020 & 2033
- Table 26: Nordics Pet Tech Revenue (million) Forecast, by Application 2020 & 2033
- Table 27: Rest of Europe Pet Tech Revenue (million) Forecast, by Application 2020 & 2033
- Table 28: Global Pet Tech Revenue million Forecast, by Application 2020 & 2033
- Table 29: Global Pet Tech Revenue million Forecast, by Types 2020 & 2033
- Table 30: Global Pet Tech Revenue million Forecast, by Country 2020 & 2033
- Table 31: Turkey Pet Tech Revenue (million) Forecast, by Application 2020 & 2033
- Table 32: Israel Pet Tech Revenue (million) Forecast, by Application 2020 & 2033
- Table 33: GCC Pet Tech Revenue (million) Forecast, by Application 2020 & 2033
- Table 34: North Africa Pet Tech Revenue (million) Forecast, by Application 2020 & 2033
- Table 35: South Africa Pet Tech Revenue (million) Forecast, by Application 2020 & 2033
- Table 36: Rest of Middle East & Africa Pet Tech Revenue (million) Forecast, by Application 2020 & 2033
- Table 37: Global Pet Tech Revenue million Forecast, by Application 2020 & 2033
- Table 38: Global Pet Tech Revenue million Forecast, by Types 2020 & 2033
- Table 39: Global Pet Tech Revenue million Forecast, by Country 2020 & 2033
- Table 40: China Pet Tech Revenue (million) Forecast, by Application 2020 & 2033
- Table 41: India Pet Tech Revenue (million) Forecast, by Application 2020 & 2033
- Table 42: Japan Pet Tech Revenue (million) Forecast, by Application 2020 & 2033
- Table 43: South Korea Pet Tech Revenue (million) Forecast, by Application 2020 & 2033
- Table 44: ASEAN Pet Tech Revenue (million) Forecast, by Application 2020 & 2033
- Table 45: Oceania Pet Tech Revenue (million) Forecast, by Application 2020 & 2033
- Table 46: Rest of Asia Pacific Pet Tech Revenue (million) Forecast, by Application 2020 & 2033
Frequently Asked Questions
1. What is the projected Compound Annual Growth Rate (CAGR) of the Pet Tech?
The projected CAGR is approximately 13.6%.
2. Which companies are prominent players in the Pet Tech?
Key companies in the market include Actijoy Solution, All Home Robotics, CleverPet, Dogtra, DOGVACAY, Felcana, Fitbark, Garmin Ltd., GoPro, IceRobotics, iFetch, LLC., Invoxia, Konectera, Loc8tor, Lupine Pet, Mars Incorporated, Motorola, Nedap N.V., Obe, Inc..
3. What are the main segments of the Pet Tech?
The market segments include Application, Types.
4. Can you provide details about the market size?
The market size is estimated to be USD 5666.3 million as of 2022.
5. What are some drivers contributing to market growth?
N/A
6. What are the notable trends driving market growth?
N/A
7. Are there any restraints impacting market growth?
N/A
8. Can you provide examples of recent developments in the market?
N/A
9. What pricing options are available for accessing the report?
Pricing options include single-user, multi-user, and enterprise licenses priced at USD 3350.00, USD 5025.00, and USD 6700.00 respectively.
10. Is the market size provided in terms of value or volume?
The market size is provided in terms of value, measured in million.
11. Are there any specific market keywords associated with the report?
Yes, the market keyword associated with the report is "Pet Tech," which aids in identifying and referencing the specific market segment covered.
12. How do I determine which pricing option suits my needs best?
The pricing options vary based on user requirements and access needs. Individual users may opt for single-user licenses, while businesses requiring broader access may choose multi-user or enterprise licenses for cost-effective access to the report.
13. Are there any additional resources or data provided in the Pet Tech report?
While the report offers comprehensive insights, it's advisable to review the specific contents or supplementary materials provided to ascertain if additional resources or data are available.
14. How can I stay updated on further developments or reports in the Pet Tech?
To stay informed about further developments, trends, and reports in the Pet Tech, consider subscribing to industry newsletters, following relevant companies and organizations, or regularly checking reputable industry news sources and publications.
Methodology
Step 1 - Identification of Relevant Samples Size from Population Database


Step 2 - Approaches for Defining Global Market Size (Value, Volume* & Price*)

Note*: In applicable scenarios
Step 3 - Data Sources
Primary Research
- Web Analytics
- Survey Reports
- Research Institute
- Latest Research Reports
- Opinion Leaders
Secondary Research
- Annual Reports
- White Paper
- Latest Press Release
- Industry Association
- Paid Database
- Investor Presentations

Step 4 - Data Triangulation
Involves using different sources of information in order to increase the validity of a study
These sources are likely to be stakeholders in a program - participants, other researchers, program staff, other community members, and so on.
Then we put all data in single framework & apply various statistical tools to find out the dynamic on the market.
During the analysis stage, feedback from the stakeholder groups would be compared to determine areas of agreement as well as areas of divergence