

Key Insights
The global Optical Variable Attenuator market is poised for significant expansion, projected to reach an estimated $587 million by 2033, exhibiting a robust Compound Annual Growth Rate (CAGR) of 5% from its 2025 valuation. This growth is fundamentally driven by the escalating demand for high-speed data transmission and the continuous evolution of fiber optic communication systems. As networks become more sophisticated and data-intensive applications proliferate, the need for precise control over optical signal power becomes paramount. This requirement fuels the adoption of optical variable attenuators in diverse applications, including advanced telecommunications infrastructure, data centers, and intricate testing and measurement equipment. The market's trajectory is further bolstered by ongoing technological advancements, leading to the development of more compact, efficient, and cost-effective attenuator solutions that cater to a wider array of end-user needs.
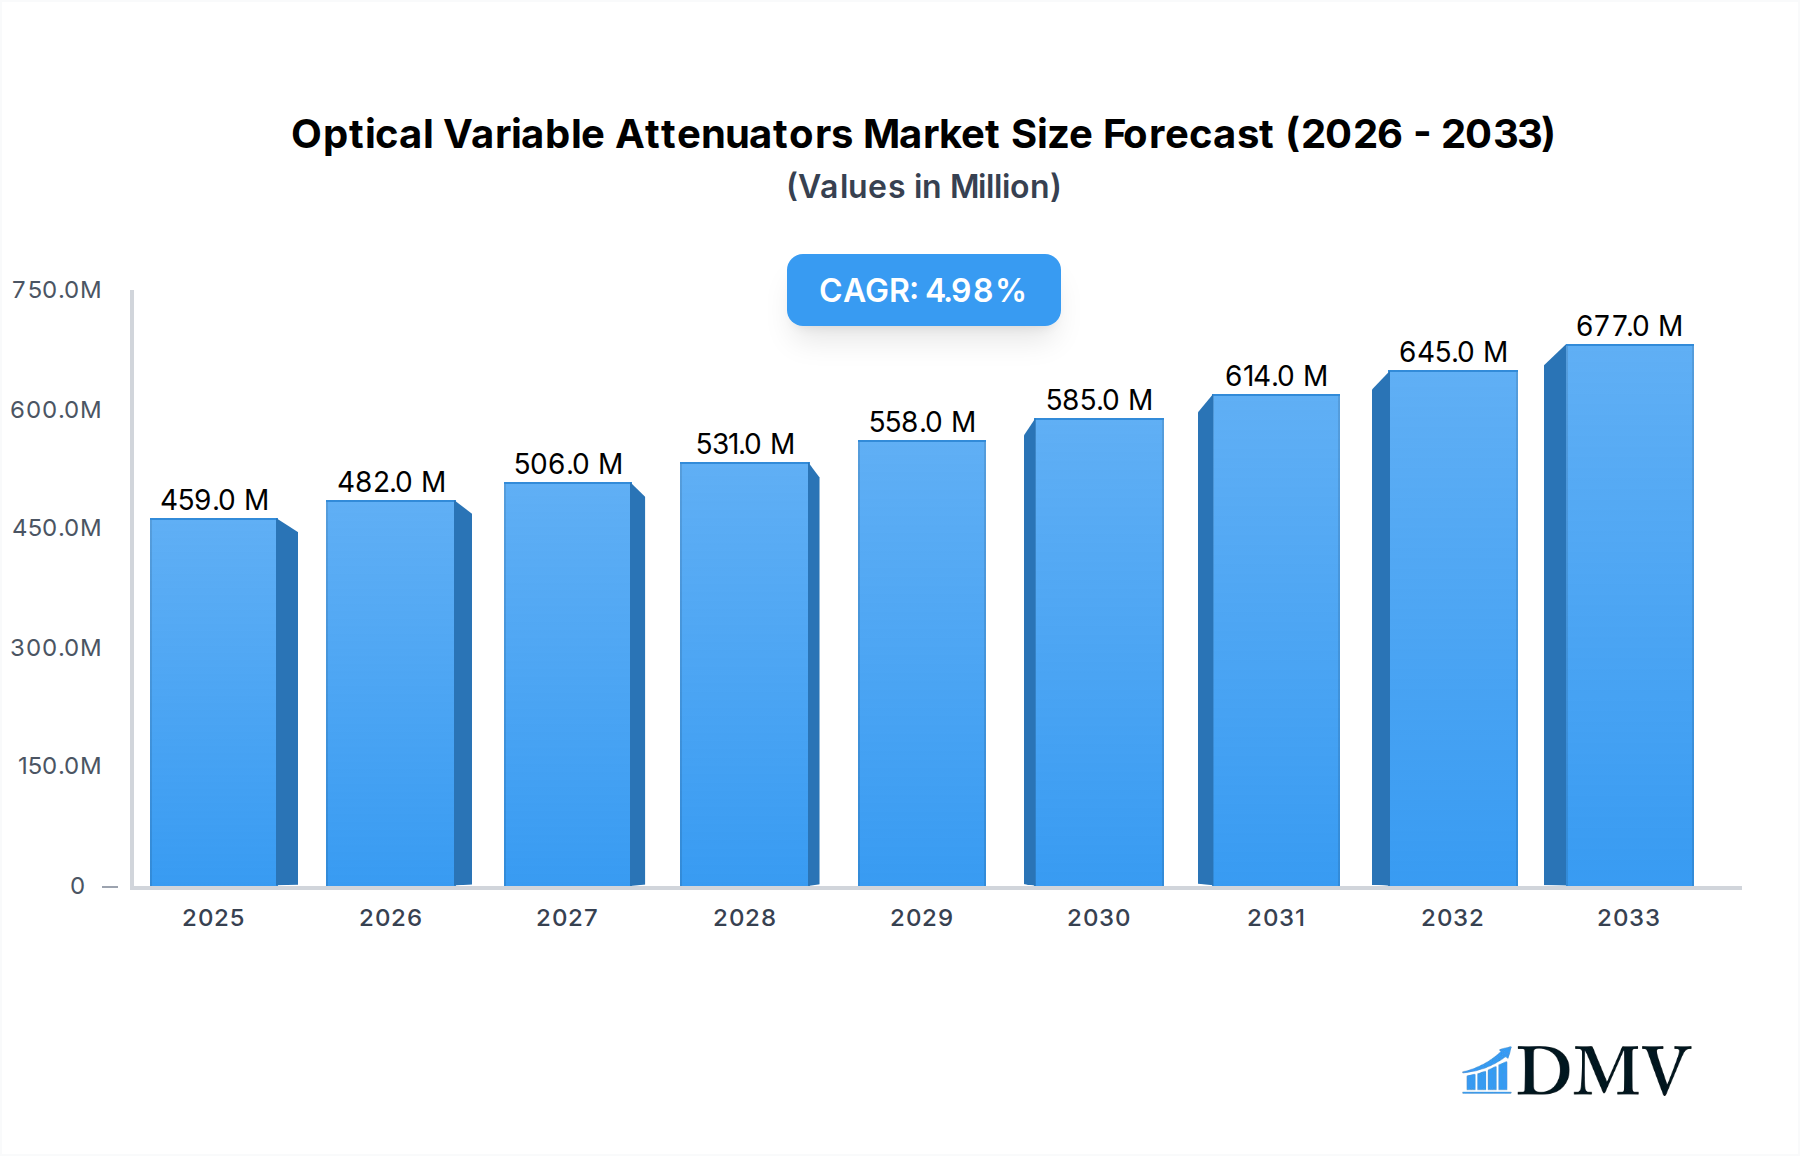
Optical Variable Attenuators Market Size (In Million)
Several key trends are shaping the optical variable attenuator landscape. The increasing adoption of 5G networks, with their insatiable appetite for bandwidth and low latency, is a significant catalyst. Furthermore, the burgeoning growth in cloud computing and the Internet of Things (IoT) necessitates more robust and scalable optical networks, directly benefiting the attenuator market. Innovations in areas like tunable optical filters and integrated photonic circuits are also creating new opportunities for advanced attenuator designs. However, the market faces certain restraints, including the high initial investment costs associated with sophisticated optical equipment and the presence of alternative signal management techniques that could potentially substitute for variable attenuators in specific scenarios. Despite these challenges, the overarching trend towards enhanced network performance and capacity ensures a positive outlook for the optical variable attenuator market.

Optical Variable Attenuators Company Market Share
Optical Variable Attenuators Market Report Description
This comprehensive report delves into the dynamic global Optical Variable Attenuators (OVA) market, offering an in-depth analysis of its current landscape and future trajectory. Spanning a study period of 2019 to 2033, with a base and estimated year of 2025 and a forecast period from 2025 to 2033, this research provides critical insights for stakeholders navigating the evolving fiber optical communication system and test equipment sectors. We examine market composition, industry evolution, regional dominance, product innovations, growth drivers, challenges, and future opportunities, underpinned by meticulous data analysis and expert commentary. This report is an indispensable resource for understanding the market's intricate workings and strategic planning.
Optical Variable Attenuators Market Composition & Trends
The optical variable attenuator market exhibits a moderate concentration, with key players like Viavi Solutions, Lumentum Operations, and Corning commanding significant market share, estimated at over 400 million USD. Innovation remains a primary catalyst, driven by the relentless demand for higher bandwidth and more efficient optical networks. Emerging technologies in variable optical attenuator design, such as MEMS-based and electro-optic attenuators, are continuously pushing performance boundaries. The regulatory landscape, while generally supportive of telecommunications infrastructure development, can influence market entry and product certification processes. Substitute products, such as fixed optical attenuators, exist but lack the flexibility required for dynamic network adjustments. End-user profiles are diverse, primarily comprising telecommunications service providers, network equipment manufacturers, research institutions, and laboratories involved in optical testing. Mergers and acquisitions (M&A) activity, valued at an estimated 250 million USD in the historical period, has been instrumental in market consolidation and technological integration, with notable deals shaping the competitive environment.
- Market Share Distribution: Key players like Viavi Solutions, Lumentum Operations, and Corning hold a substantial share, driving market innovation and setting industry standards for optical attenuator performance.
- Innovation Catalysts: Advancements in semiconductor technology, materials science, and miniaturization are fueling the development of more compact, power-efficient, and precise optical variable attenuators.
- Regulatory Landscape: Compliance with telecommunications standards and safety regulations is crucial for market access and product adoption globally.
- Substitute Products: While fixed attenuators serve basic needs, the flexibility of OVAs is indispensable for advanced optical network management and testing.
- End-User Profiles: The market is segmented across telecommunications, data centers, defense, and scientific research, each with unique demands for attenuation control.
- M&A Activities: Strategic acquisitions have enabled companies to expand their product portfolios, acquire new technologies, and strengthen their market positions within the optical components sector.
Optical Variable Attenuators Industry Evolution
The optical variable attenuator industry has witnessed a remarkable evolution, characterized by continuous technological advancements and expanding applications. From its inception, the market has been driven by the burgeoning demand for reliable and precise signal control in optical communication networks. The historical period (2019-2024) saw a consistent growth trajectory, fueled by the global rollout of 5G infrastructure and the increasing adoption of high-speed internet services. The average annual growth rate during this period was approximately 7.5%, with total market revenue reaching an estimated 3.1 billion USD by the end of 2024. Technological advancements have been pivotal, with the transition from mechanical attenuators to more sophisticated MEMS (Micro-Electro-Mechanical Systems) and electro-optic attenuators enabling finer control, faster response times, and improved durability. These advancements have directly addressed the evolving consumer demands for higher data throughput and more stable network performance. The adoption of variable optical attenuator solutions in sophisticated test and measurement equipment has also played a significant role, allowing for more accurate calibration and performance validation of optical components and systems. The market's growth is also intrinsically linked to the expansion of data centers and cloud computing services, which require robust optical infrastructure capable of handling massive data flows. Furthermore, the increasing complexity of optical signal routing and management in dense wavelength-division multiplexing (DWDM) systems necessitates the use of highly accurate and responsive variable attenuators. The market for optical attenuator components has seen substantial growth due to their integration into larger optical systems, while the demand for handheld and benchtop optical variable attenuators remains strong for field servicing and laboratory applications, respectively.
Leading Regions, Countries, or Segments in Optical Variable Attenuators
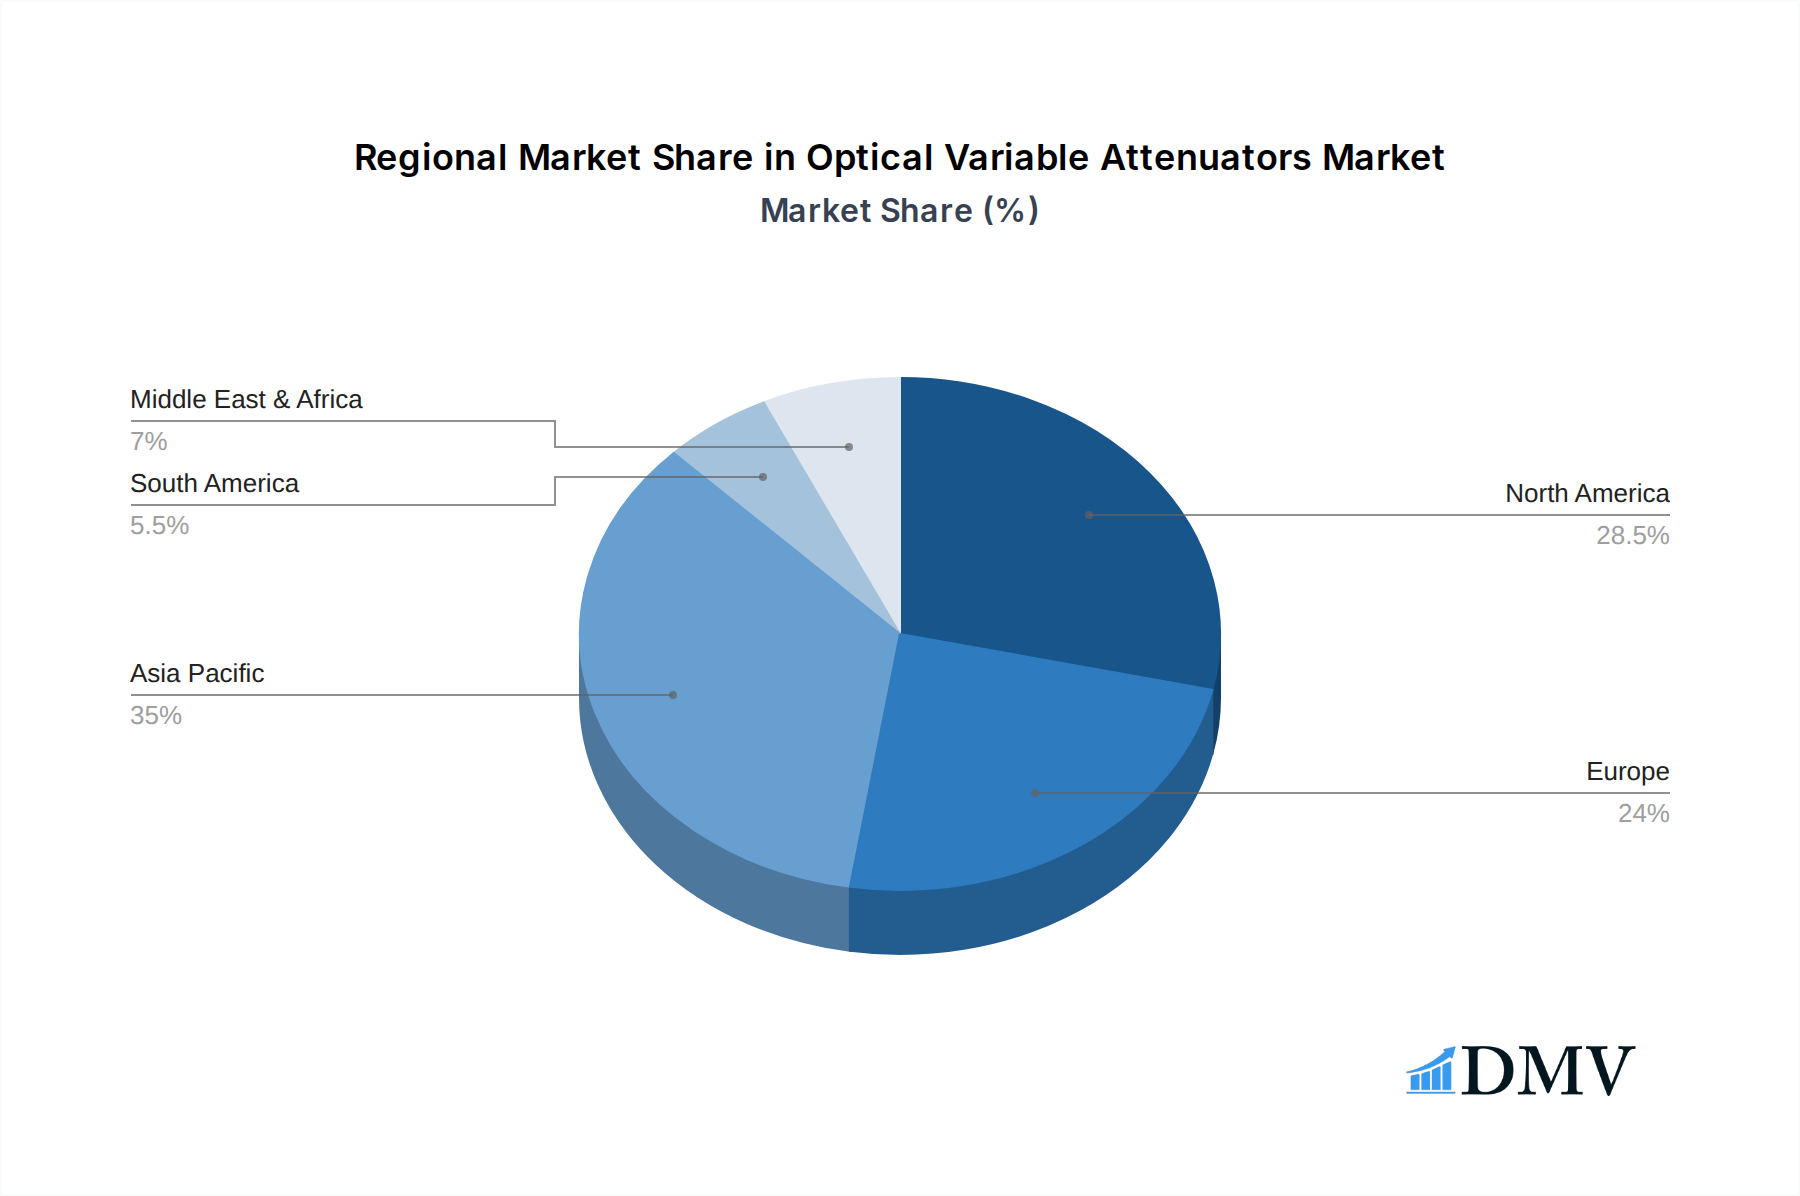
The Asia Pacific region is emerging as the dominant force in the optical variable attenuators market, driven by significant investments in telecommunications infrastructure and a burgeoning manufacturing base for optical components. Countries like China, South Korea, and Japan are at the forefront, with extensive deployments of 5G networks and a growing demand for high-speed data services. The robust growth in fiber optical communication systems within this region directly translates into a substantial requirement for reliable optical variable attenuator solutions. Furthermore, the presence of leading manufacturers such as O-Net and DiCon Fiberoptics in Asia Pacific contributes to market leadership through innovation and competitive pricing.
In the Fiber Optical Communication System application segment, demand is exceptionally high due to:
- Massive 5G Rollouts: The widespread deployment of 5G technology necessitates extensive fiber optic backhaul and fronthaul networks, requiring precise signal attenuation for optimal performance.
- Data Center Expansion: The exponential growth of data centers worldwide fuels the need for robust optical networking solutions, including variable attenuators for signal management and loss compensation.
- Broadband Penetration Initiatives: Government initiatives aimed at increasing broadband penetration in developing economies are driving the demand for fiber optic infrastructure, consequently boosting the OVA market.
The Test Equipment application segment also plays a crucial role, with an estimated market share of 35%. This segment is driven by:
- Network Performance Testing: The need for accurate testing and certification of optical networks requires variable attenuators to simulate various signal loss scenarios and ensure system resilience.
- Research and Development: Academic and industrial R&D activities in photonics and optical communications rely heavily on precise attenuation control for experimental setups and component characterization.
- Field Service and Maintenance: Handheld optical variable attenuators are indispensable tools for field technicians performing installation, troubleshooting, and maintenance of fiber optic networks.
In terms of product Types, the Component segment holds the largest market share, estimated at 55%, due to its integration into a wide array of optical devices and systems. However, Benchtop and Handheld attenuators are critical for specific applications:
- Component: High integration density and cost-effectiveness drive the demand for OVA components in OEM devices and network infrastructure.
- Handheld: Portability and ease of use make handheld OVAs essential for field technicians and on-site network diagnostics.
- Benchtop: Precision, advanced features, and versatility make benchtop OVAs indispensable for laboratory settings and research environments.
Optical Variable Attenuators Product Innovations
Recent product innovations in optical variable attenuators are revolutionizing signal control in optical networks. Companies like Viavi Solutions and Keysight are introducing highly advanced benchtop optical attenuators with unprecedented precision and stability, essential for complex test equipment applications. DiCon Fiberoptics and O-Net are at the forefront of developing compact, high-performance OVA components for integration into next-generation fiber optical communication systems. These innovations often feature lower insertion loss, wider dynamic range, and faster response times, enabling more efficient network management and improved data transmission quality. Performance metrics such as attenuation accuracy within ±0.1 dB and repeatability of ±0.05 dB are becoming standard, catering to the stringent demands of modern telecommunications.
Propelling Factors for Optical Variable Attenuators Growth
The growth of the optical variable attenuators market is propelled by several interconnected factors. The relentless expansion of fiber optical communication systems, driven by the insatiable demand for higher bandwidth and faster data speeds, is a primary growth engine. This is exemplified by the global rollout of 5G networks, which requires sophisticated optical infrastructure capable of handling increased data traffic. Furthermore, the booming data center industry and the proliferation of cloud computing services necessitate robust optical networking solutions for efficient data transmission and signal management, directly increasing the demand for variable optical attenuators. Technological advancements, such as the development of more compact, power-efficient, and highly precise OVA technologies (e.g., MEMS-based), are also crucial enablers, making these devices more accessible and versatile. Government initiatives promoting digital transformation and broadband connectivity in developing economies further contribute to market expansion.
- 5G Network Deployment: The global build-out of 5G infrastructure significantly boosts demand for fiber optics and associated components like OVAs.
- Data Center Growth: The expanding capacity and number of data centers worldwide require sophisticated optical signal management.
- Technological Advancements: Innovations in OVA design, such as MEMS and electro-optic technologies, enhance performance and broaden applicability.
- Increased Data Consumption: The ever-growing volume of data traffic necessitates more efficient and reliable optical networks.
- Government Initiatives: Supportive policies and investments in digital infrastructure accelerate market growth.
Obstacles in the Optical Variable Attenuators Market
Despite its robust growth, the optical variable attenuators market faces several obstacles. Intense competition among manufacturers, particularly from emerging players in Asia, can lead to price erosion and pressure on profit margins. Supply chain disruptions, exacerbated by geopolitical factors and global events, can impact the availability of raw materials and components, leading to production delays and increased costs. The high cost of research and development for advanced OVA technologies can also be a barrier for smaller companies. Furthermore, the complexity of some OVA systems and the need for specialized technical expertise for their installation and maintenance can pose challenges for widespread adoption in certain markets. The ongoing development of alternative technologies, though currently less pervasive, represents a potential long-term threat.
- Price Competition: Fierce rivalry among manufacturers can lead to price wars and reduced profitability.
- Supply Chain Volatility: Disruptions in the global supply chain can impact production schedules and material availability.
- High R&D Costs: Developing cutting-edge OVA technologies requires substantial investment in research and development.
- Technical Expertise Requirements: The installation and operation of advanced OVAs may demand specialized technical skills.
Future Opportunities in Optical Variable Attenuators
The future of the optical variable attenuators market is brimming with opportunities. The continued expansion of 5G and the imminent arrival of 6G technologies will drive unprecedented demand for high-performance optical components, including advanced OVAs. The growing adoption of fiber-to-the-home (FTTH) deployments globally will further fuel the need for reliable attenuation solutions. Emerging applications in areas such as autonomous driving, smart cities, and the Internet of Things (IoT) will also create new market avenues, as these technologies rely heavily on robust optical communication infrastructure. Furthermore, advancements in photonics and miniaturization will enable the development of even smaller, more integrated, and cost-effective OVA solutions, opening up new possibilities for their application. The increasing focus on network security and the need for precise signal monitoring also presents an opportunity for OVAs with enhanced diagnostic capabilities.
- 6G Network Development: Anticipated advancements in wireless technology will necessitate further enhancements in optical infrastructure.
- FTTH Expansion: Increased global fiber-to-the-home deployments will drive demand for passive optical network components.
- Emerging Technologies: Applications in autonomous vehicles, smart cities, and IoT will create new markets for OVAs.
- Miniaturization and Integration: Continued advancements in photonics will lead to smaller and more integrated OVA solutions.
- Network Security and Monitoring: The need for enhanced signal control and monitoring in secure networks presents new application areas.
Major Players in the Optical Variable Attenuators Ecosystem
The global optical variable attenuators market features a robust ecosystem of leading manufacturers and technology providers. These companies are instrumental in driving innovation, ensuring product quality, and meeting the diverse demands of various industry segments. Their commitment to research and development, coupled with strategic market positioning, shapes the competitive landscape and influences technological advancements in the field of optical attenuation.
- Viavi Solutions
- Lumentum Operations
- Mellanox Technologies
- DiCon Fiberoptics
- O-Net
- Corning
- Keysight
- Accelink
- EXFO
- OZ Optics
- NeoPhotonics
- Yokogawa Electric
- Thorlabs
- Lightcomm Technology
- Diamond
- Santec
- Agiltron
- AC Photonics
- Sun Telecom
- AFL
- OptiWorks
- Sercalo Microtechnology
Key Developments in Optical Variable Attenuators Industry
- 2023 Q4: Viavi Solutions launches a new series of high-precision optical variable attenuators designed for advanced telecommunications testing, offering enhanced accuracy and faster response times.
- 2024 Q1: Lumentum Operations announces a strategic partnership with a leading network equipment manufacturer to integrate their advanced OVA components into next-generation optical transceivers, aiming to improve signal integrity and power efficiency.
- 2024 Q2: DiCon Fiberoptics introduces a novel MEMS-based optical variable attenuator with a significantly reduced footprint, targeting space-constrained applications in compact optical modules.
- 2024 Q3: O-Net showcases its latest advancements in fiber optic components, including a new line of ultra-low insertion loss optical variable attenuators, catering to the growing demand for higher data rates in fiber optical communication systems.
- 2024 Q4: Keysight Technologies expands its portfolio of optical test solutions with the introduction of a new benchtop optical variable attenuator featuring an expanded dynamic range and improved wavelength stability, crucial for complex signal analysis.
- 2025 Q1: Corning invests heavily in expanding its manufacturing capacity for optical components, including optical variable attenuators, to meet the anticipated surge in demand from 5G and FTTH rollouts.
- 2025 Q2: Accelink Technologies announces the development of a new generation of environmentally robust optical variable attenuators designed for harsh operating conditions, expanding their applicability in industrial and defense sectors.
Strategic Optical Variable Attenuators Market Forecast
The strategic forecast for the optical variable attenuators market indicates sustained and robust growth over the forecast period (2025-2033). This expansion will be primarily driven by the accelerating global deployment of 5G and the increasing adoption of fiber-to-the-home (FTTH) initiatives, creating a significant and consistent demand for reliable optical attenuator components. Furthermore, the burgeoning data center industry, coupled with advancements in cloud computing and the rise of edge computing, will necessitate more sophisticated and efficient optical networking solutions, including precision variable optical attenuators. Continuous innovation in OVA technology, focusing on miniaturization, enhanced performance metrics, and cost-effectiveness, will unlock new application areas and further solidify market penetration. Emerging markets and developing economies are expected to contribute significantly to this growth as they invest in upgrading their telecommunications infrastructure.
Optical Variable Attenuators Segmentation
-
1. Application
- 1.1. Fiber Optical Communiction System
- 1.2. Test Equipment
-
2. Types
- 2.1. Component
- 2.2. Handheld
- 2.3. Benchtop
Optical Variable Attenuators Segmentation By Geography
-
1. North America
- 1.1. United States
- 1.2. Canada
- 1.3. Mexico
-
2. South America
- 2.1. Brazil
- 2.2. Argentina
- 2.3. Rest of South America
-
3. Europe
- 3.1. United Kingdom
- 3.2. Germany
- 3.3. France
- 3.4. Italy
- 3.5. Spain
- 3.6. Russia
- 3.7. Benelux
- 3.8. Nordics
- 3.9. Rest of Europe
-
4. Middle East & Africa
- 4.1. Turkey
- 4.2. Israel
- 4.3. GCC
- 4.4. North Africa
- 4.5. South Africa
- 4.6. Rest of Middle East & Africa
-
5. Asia Pacific
- 5.1. China
- 5.2. India
- 5.3. Japan
- 5.4. South Korea
- 5.5. ASEAN
- 5.6. Oceania
- 5.7. Rest of Asia Pacific
Optical Variable Attenuators Regional Market Share
Geographic Coverage of Optical Variable Attenuators
Optical Variable Attenuators REPORT HIGHLIGHTS
| Aspects | Details |
|---|---|
| Study Period | 2020-2034 |
| Base Year | 2025 |
| Estimated Year | 2026 |
| Forecast Period | 2026-2034 |
| Historical Period | 2020-2025 |
| Growth Rate | CAGR of 5% from 2020-2034 |
| Segmentation |
|
Table of Contents
- 1. Introduction
- 1.1. Research Scope
- 1.2. Market Segmentation
- 1.3. Research Objective
- 1.4. Definitions and Assumptions
- 2. Executive Summary
- 2.1. Market Snapshot
- 3. Market Dynamics
- 3.1. Market Drivers
- 3.2. Market Restrains
- 3.3. Market Trends
- 3.4. Market Opportunities
- 4. Market Factor Analysis
- 4.1. Porters Five Forces
- 4.1.1. Bargaining Power of Suppliers
- 4.1.2. Bargaining Power of Buyers
- 4.1.3. Threat of New Entrants
- 4.1.4. Threat of Substitutes
- 4.1.5. Competitive Rivalry
- 4.2. PESTEL analysis
- 4.3. BCG Analysis
- 4.3.1. Stars (High Growth, High Market Share)
- 4.3.2. Cash Cows (Low Growth, High Market Share)
- 4.3.3. Question Mark (High Growth, Low Market Share)
- 4.3.4. Dogs (Low Growth, Low Market Share)
- 4.4. Ansoff Matrix Analysis
- 4.5. Supply Chain Analysis
- 4.6. Regulatory Landscape
- 4.7. Current Market Potential and Opportunity Assessment (TAM–SAM–SOM Framework)
- 4.8. DMV Analyst Note
- 4.1. Porters Five Forces
- 5. Market Analysis, Insights and Forecast 2021-2033
- 5.1. Market Analysis, Insights and Forecast - by Application
- 5.1.1. Fiber Optical Communiction System
- 5.1.2. Test Equipment
- 5.2. Market Analysis, Insights and Forecast - by Types
- 5.2.1. Component
- 5.2.2. Handheld
- 5.2.3. Benchtop
- 5.3. Market Analysis, Insights and Forecast - by Region
- 5.3.1. North America
- 5.3.2. South America
- 5.3.3. Europe
- 5.3.4. Middle East & Africa
- 5.3.5. Asia Pacific
- 5.1. Market Analysis, Insights and Forecast - by Application
- 6. Global Optical Variable Attenuators Analysis, Insights and Forecast, 2021-2033
- 6.1. Market Analysis, Insights and Forecast - by Application
- 6.1.1. Fiber Optical Communiction System
- 6.1.2. Test Equipment
- 6.2. Market Analysis, Insights and Forecast - by Types
- 6.2.1. Component
- 6.2.2. Handheld
- 6.2.3. Benchtop
- 6.1. Market Analysis, Insights and Forecast - by Application
- 7. North America Optical Variable Attenuators Analysis, Insights and Forecast, 2020-2032
- 7.1. Market Analysis, Insights and Forecast - by Application
- 7.1.1. Fiber Optical Communiction System
- 7.1.2. Test Equipment
- 7.2. Market Analysis, Insights and Forecast - by Types
- 7.2.1. Component
- 7.2.2. Handheld
- 7.2.3. Benchtop
- 7.1. Market Analysis, Insights and Forecast - by Application
- 8. South America Optical Variable Attenuators Analysis, Insights and Forecast, 2020-2032
- 8.1. Market Analysis, Insights and Forecast - by Application
- 8.1.1. Fiber Optical Communiction System
- 8.1.2. Test Equipment
- 8.2. Market Analysis, Insights and Forecast - by Types
- 8.2.1. Component
- 8.2.2. Handheld
- 8.2.3. Benchtop
- 8.1. Market Analysis, Insights and Forecast - by Application
- 9. Europe Optical Variable Attenuators Analysis, Insights and Forecast, 2020-2032
- 9.1. Market Analysis, Insights and Forecast - by Application
- 9.1.1. Fiber Optical Communiction System
- 9.1.2. Test Equipment
- 9.2. Market Analysis, Insights and Forecast - by Types
- 9.2.1. Component
- 9.2.2. Handheld
- 9.2.3. Benchtop
- 9.1. Market Analysis, Insights and Forecast - by Application
- 10. Middle East & Africa Optical Variable Attenuators Analysis, Insights and Forecast, 2020-2032
- 10.1. Market Analysis, Insights and Forecast - by Application
- 10.1.1. Fiber Optical Communiction System
- 10.1.2. Test Equipment
- 10.2. Market Analysis, Insights and Forecast - by Types
- 10.2.1. Component
- 10.2.2. Handheld
- 10.2.3. Benchtop
- 10.1. Market Analysis, Insights and Forecast - by Application
- 11. Asia Pacific Optical Variable Attenuators Analysis, Insights and Forecast, 2020-2032
- 11.1. Market Analysis, Insights and Forecast - by Application
- 11.1.1. Fiber Optical Communiction System
- 11.1.2. Test Equipment
- 11.2. Market Analysis, Insights and Forecast - by Types
- 11.2.1. Component
- 11.2.2. Handheld
- 11.2.3. Benchtop
- 11.1. Market Analysis, Insights and Forecast - by Application
- 12. Competitive Analysis
- 12.1. Company Profiles
- 12.1.1 Viavi Solutions
- 12.1.1.1. Company Overview
- 12.1.1.2. Products
- 12.1.1.3. Company Financials
- 12.1.1.4. SWOT Analysis
- 12.1.2 Lumentum Operations
- 12.1.2.1. Company Overview
- 12.1.2.2. Products
- 12.1.2.3. Company Financials
- 12.1.2.4. SWOT Analysis
- 12.1.3 Mellanox Technologies
- 12.1.3.1. Company Overview
- 12.1.3.2. Products
- 12.1.3.3. Company Financials
- 12.1.3.4. SWOT Analysis
- 12.1.4 DiCon Fiberoptics
- 12.1.4.1. Company Overview
- 12.1.4.2. Products
- 12.1.4.3. Company Financials
- 12.1.4.4. SWOT Analysis
- 12.1.5 O-Net
- 12.1.5.1. Company Overview
- 12.1.5.2. Products
- 12.1.5.3. Company Financials
- 12.1.5.4. SWOT Analysis
- 12.1.6 Corning
- 12.1.6.1. Company Overview
- 12.1.6.2. Products
- 12.1.6.3. Company Financials
- 12.1.6.4. SWOT Analysis
- 12.1.7 Keysight
- 12.1.7.1. Company Overview
- 12.1.7.2. Products
- 12.1.7.3. Company Financials
- 12.1.7.4. SWOT Analysis
- 12.1.8 Accelink
- 12.1.8.1. Company Overview
- 12.1.8.2. Products
- 12.1.8.3. Company Financials
- 12.1.8.4. SWOT Analysis
- 12.1.9 EXFO
- 12.1.9.1. Company Overview
- 12.1.9.2. Products
- 12.1.9.3. Company Financials
- 12.1.9.4. SWOT Analysis
- 12.1.10 OZ Optics
- 12.1.10.1. Company Overview
- 12.1.10.2. Products
- 12.1.10.3. Company Financials
- 12.1.10.4. SWOT Analysis
- 12.1.11 NeoPhotonics
- 12.1.11.1. Company Overview
- 12.1.11.2. Products
- 12.1.11.3. Company Financials
- 12.1.11.4. SWOT Analysis
- 12.1.12 Yokogawa Electric
- 12.1.12.1. Company Overview
- 12.1.12.2. Products
- 12.1.12.3. Company Financials
- 12.1.12.4. SWOT Analysis
- 12.1.13 Thorlabs
- 12.1.13.1. Company Overview
- 12.1.13.2. Products
- 12.1.13.3. Company Financials
- 12.1.13.4. SWOT Analysis
- 12.1.14 Lightcomm Technology
- 12.1.14.1. Company Overview
- 12.1.14.2. Products
- 12.1.14.3. Company Financials
- 12.1.14.4. SWOT Analysis
- 12.1.15 Diamond
- 12.1.15.1. Company Overview
- 12.1.15.2. Products
- 12.1.15.3. Company Financials
- 12.1.15.4. SWOT Analysis
- 12.1.16 Santec
- 12.1.16.1. Company Overview
- 12.1.16.2. Products
- 12.1.16.3. Company Financials
- 12.1.16.4. SWOT Analysis
- 12.1.17 Agiltron
- 12.1.17.1. Company Overview
- 12.1.17.2. Products
- 12.1.17.3. Company Financials
- 12.1.17.4. SWOT Analysis
- 12.1.18 AC Photonics
- 12.1.18.1. Company Overview
- 12.1.18.2. Products
- 12.1.18.3. Company Financials
- 12.1.18.4. SWOT Analysis
- 12.1.19 Sun Telecom
- 12.1.19.1. Company Overview
- 12.1.19.2. Products
- 12.1.19.3. Company Financials
- 12.1.19.4. SWOT Analysis
- 12.1.20 AFL
- 12.1.20.1. Company Overview
- 12.1.20.2. Products
- 12.1.20.3. Company Financials
- 12.1.20.4. SWOT Analysis
- 12.1.21 OptiWorks
- 12.1.21.1. Company Overview
- 12.1.21.2. Products
- 12.1.21.3. Company Financials
- 12.1.21.4. SWOT Analysis
- 12.1.22 Sercalo Microtechnology
- 12.1.22.1. Company Overview
- 12.1.22.2. Products
- 12.1.22.3. Company Financials
- 12.1.22.4. SWOT Analysis
- 12.1.1 Viavi Solutions
- 12.2. Market Entropy
- 12.2.1 Company's Key Areas Served
- 12.2.2 Recent Developments
- 12.3. Company Market Share Analysis 2025
- 12.3.1 Top 5 Companies Market Share Analysis
- 12.3.2 Top 3 Companies Market Share Analysis
- 12.4. List of Potential Customers
- 13. Research Methodology
List of Figures
- Figure 1: Global Optical Variable Attenuators Revenue Breakdown (million, %) by Region 2025 & 2033
- Figure 2: Global Optical Variable Attenuators Volume Breakdown (K, %) by Region 2025 & 2033
- Figure 3: North America Optical Variable Attenuators Revenue (million), by Application 2025 & 2033
- Figure 4: North America Optical Variable Attenuators Volume (K), by Application 2025 & 2033
- Figure 5: North America Optical Variable Attenuators Revenue Share (%), by Application 2025 & 2033
- Figure 6: North America Optical Variable Attenuators Volume Share (%), by Application 2025 & 2033
- Figure 7: North America Optical Variable Attenuators Revenue (million), by Types 2025 & 2033
- Figure 8: North America Optical Variable Attenuators Volume (K), by Types 2025 & 2033
- Figure 9: North America Optical Variable Attenuators Revenue Share (%), by Types 2025 & 2033
- Figure 10: North America Optical Variable Attenuators Volume Share (%), by Types 2025 & 2033
- Figure 11: North America Optical Variable Attenuators Revenue (million), by Country 2025 & 2033
- Figure 12: North America Optical Variable Attenuators Volume (K), by Country 2025 & 2033
- Figure 13: North America Optical Variable Attenuators Revenue Share (%), by Country 2025 & 2033
- Figure 14: North America Optical Variable Attenuators Volume Share (%), by Country 2025 & 2033
- Figure 15: South America Optical Variable Attenuators Revenue (million), by Application 2025 & 2033
- Figure 16: South America Optical Variable Attenuators Volume (K), by Application 2025 & 2033
- Figure 17: South America Optical Variable Attenuators Revenue Share (%), by Application 2025 & 2033
- Figure 18: South America Optical Variable Attenuators Volume Share (%), by Application 2025 & 2033
- Figure 19: South America Optical Variable Attenuators Revenue (million), by Types 2025 & 2033
- Figure 20: South America Optical Variable Attenuators Volume (K), by Types 2025 & 2033
- Figure 21: South America Optical Variable Attenuators Revenue Share (%), by Types 2025 & 2033
- Figure 22: South America Optical Variable Attenuators Volume Share (%), by Types 2025 & 2033
- Figure 23: South America Optical Variable Attenuators Revenue (million), by Country 2025 & 2033
- Figure 24: South America Optical Variable Attenuators Volume (K), by Country 2025 & 2033
- Figure 25: South America Optical Variable Attenuators Revenue Share (%), by Country 2025 & 2033
- Figure 26: South America Optical Variable Attenuators Volume Share (%), by Country 2025 & 2033
- Figure 27: Europe Optical Variable Attenuators Revenue (million), by Application 2025 & 2033
- Figure 28: Europe Optical Variable Attenuators Volume (K), by Application 2025 & 2033
- Figure 29: Europe Optical Variable Attenuators Revenue Share (%), by Application 2025 & 2033
- Figure 30: Europe Optical Variable Attenuators Volume Share (%), by Application 2025 & 2033
- Figure 31: Europe Optical Variable Attenuators Revenue (million), by Types 2025 & 2033
- Figure 32: Europe Optical Variable Attenuators Volume (K), by Types 2025 & 2033
- Figure 33: Europe Optical Variable Attenuators Revenue Share (%), by Types 2025 & 2033
- Figure 34: Europe Optical Variable Attenuators Volume Share (%), by Types 2025 & 2033
- Figure 35: Europe Optical Variable Attenuators Revenue (million), by Country 2025 & 2033
- Figure 36: Europe Optical Variable Attenuators Volume (K), by Country 2025 & 2033
- Figure 37: Europe Optical Variable Attenuators Revenue Share (%), by Country 2025 & 2033
- Figure 38: Europe Optical Variable Attenuators Volume Share (%), by Country 2025 & 2033
- Figure 39: Middle East & Africa Optical Variable Attenuators Revenue (million), by Application 2025 & 2033
- Figure 40: Middle East & Africa Optical Variable Attenuators Volume (K), by Application 2025 & 2033
- Figure 41: Middle East & Africa Optical Variable Attenuators Revenue Share (%), by Application 2025 & 2033
- Figure 42: Middle East & Africa Optical Variable Attenuators Volume Share (%), by Application 2025 & 2033
- Figure 43: Middle East & Africa Optical Variable Attenuators Revenue (million), by Types 2025 & 2033
- Figure 44: Middle East & Africa Optical Variable Attenuators Volume (K), by Types 2025 & 2033
- Figure 45: Middle East & Africa Optical Variable Attenuators Revenue Share (%), by Types 2025 & 2033
- Figure 46: Middle East & Africa Optical Variable Attenuators Volume Share (%), by Types 2025 & 2033
- Figure 47: Middle East & Africa Optical Variable Attenuators Revenue (million), by Country 2025 & 2033
- Figure 48: Middle East & Africa Optical Variable Attenuators Volume (K), by Country 2025 & 2033
- Figure 49: Middle East & Africa Optical Variable Attenuators Revenue Share (%), by Country 2025 & 2033
- Figure 50: Middle East & Africa Optical Variable Attenuators Volume Share (%), by Country 2025 & 2033
- Figure 51: Asia Pacific Optical Variable Attenuators Revenue (million), by Application 2025 & 2033
- Figure 52: Asia Pacific Optical Variable Attenuators Volume (K), by Application 2025 & 2033
- Figure 53: Asia Pacific Optical Variable Attenuators Revenue Share (%), by Application 2025 & 2033
- Figure 54: Asia Pacific Optical Variable Attenuators Volume Share (%), by Application 2025 & 2033
- Figure 55: Asia Pacific Optical Variable Attenuators Revenue (million), by Types 2025 & 2033
- Figure 56: Asia Pacific Optical Variable Attenuators Volume (K), by Types 2025 & 2033
- Figure 57: Asia Pacific Optical Variable Attenuators Revenue Share (%), by Types 2025 & 2033
- Figure 58: Asia Pacific Optical Variable Attenuators Volume Share (%), by Types 2025 & 2033
- Figure 59: Asia Pacific Optical Variable Attenuators Revenue (million), by Country 2025 & 2033
- Figure 60: Asia Pacific Optical Variable Attenuators Volume (K), by Country 2025 & 2033
- Figure 61: Asia Pacific Optical Variable Attenuators Revenue Share (%), by Country 2025 & 2033
- Figure 62: Asia Pacific Optical Variable Attenuators Volume Share (%), by Country 2025 & 2033
List of Tables
- Table 1: Global Optical Variable Attenuators Revenue million Forecast, by Application 2020 & 2033
- Table 2: Global Optical Variable Attenuators Volume K Forecast, by Application 2020 & 2033
- Table 3: Global Optical Variable Attenuators Revenue million Forecast, by Types 2020 & 2033
- Table 4: Global Optical Variable Attenuators Volume K Forecast, by Types 2020 & 2033
- Table 5: Global Optical Variable Attenuators Revenue million Forecast, by Region 2020 & 2033
- Table 6: Global Optical Variable Attenuators Volume K Forecast, by Region 2020 & 2033
- Table 7: Global Optical Variable Attenuators Revenue million Forecast, by Application 2020 & 2033
- Table 8: Global Optical Variable Attenuators Volume K Forecast, by Application 2020 & 2033
- Table 9: Global Optical Variable Attenuators Revenue million Forecast, by Types 2020 & 2033
- Table 10: Global Optical Variable Attenuators Volume K Forecast, by Types 2020 & 2033
- Table 11: Global Optical Variable Attenuators Revenue million Forecast, by Country 2020 & 2033
- Table 12: Global Optical Variable Attenuators Volume K Forecast, by Country 2020 & 2033
- Table 13: United States Optical Variable Attenuators Revenue (million) Forecast, by Application 2020 & 2033
- Table 14: United States Optical Variable Attenuators Volume (K) Forecast, by Application 2020 & 2033
- Table 15: Canada Optical Variable Attenuators Revenue (million) Forecast, by Application 2020 & 2033
- Table 16: Canada Optical Variable Attenuators Volume (K) Forecast, by Application 2020 & 2033
- Table 17: Mexico Optical Variable Attenuators Revenue (million) Forecast, by Application 2020 & 2033
- Table 18: Mexico Optical Variable Attenuators Volume (K) Forecast, by Application 2020 & 2033
- Table 19: Global Optical Variable Attenuators Revenue million Forecast, by Application 2020 & 2033
- Table 20: Global Optical Variable Attenuators Volume K Forecast, by Application 2020 & 2033
- Table 21: Global Optical Variable Attenuators Revenue million Forecast, by Types 2020 & 2033
- Table 22: Global Optical Variable Attenuators Volume K Forecast, by Types 2020 & 2033
- Table 23: Global Optical Variable Attenuators Revenue million Forecast, by Country 2020 & 2033
- Table 24: Global Optical Variable Attenuators Volume K Forecast, by Country 2020 & 2033
- Table 25: Brazil Optical Variable Attenuators Revenue (million) Forecast, by Application 2020 & 2033
- Table 26: Brazil Optical Variable Attenuators Volume (K) Forecast, by Application 2020 & 2033
- Table 27: Argentina Optical Variable Attenuators Revenue (million) Forecast, by Application 2020 & 2033
- Table 28: Argentina Optical Variable Attenuators Volume (K) Forecast, by Application 2020 & 2033
- Table 29: Rest of South America Optical Variable Attenuators Revenue (million) Forecast, by Application 2020 & 2033
- Table 30: Rest of South America Optical Variable Attenuators Volume (K) Forecast, by Application 2020 & 2033
- Table 31: Global Optical Variable Attenuators Revenue million Forecast, by Application 2020 & 2033
- Table 32: Global Optical Variable Attenuators Volume K Forecast, by Application 2020 & 2033
- Table 33: Global Optical Variable Attenuators Revenue million Forecast, by Types 2020 & 2033
- Table 34: Global Optical Variable Attenuators Volume K Forecast, by Types 2020 & 2033
- Table 35: Global Optical Variable Attenuators Revenue million Forecast, by Country 2020 & 2033
- Table 36: Global Optical Variable Attenuators Volume K Forecast, by Country 2020 & 2033
- Table 37: United Kingdom Optical Variable Attenuators Revenue (million) Forecast, by Application 2020 & 2033
- Table 38: United Kingdom Optical Variable Attenuators Volume (K) Forecast, by Application 2020 & 2033
- Table 39: Germany Optical Variable Attenuators Revenue (million) Forecast, by Application 2020 & 2033
- Table 40: Germany Optical Variable Attenuators Volume (K) Forecast, by Application 2020 & 2033
- Table 41: France Optical Variable Attenuators Revenue (million) Forecast, by Application 2020 & 2033
- Table 42: France Optical Variable Attenuators Volume (K) Forecast, by Application 2020 & 2033
- Table 43: Italy Optical Variable Attenuators Revenue (million) Forecast, by Application 2020 & 2033
- Table 44: Italy Optical Variable Attenuators Volume (K) Forecast, by Application 2020 & 2033
- Table 45: Spain Optical Variable Attenuators Revenue (million) Forecast, by Application 2020 & 2033
- Table 46: Spain Optical Variable Attenuators Volume (K) Forecast, by Application 2020 & 2033
- Table 47: Russia Optical Variable Attenuators Revenue (million) Forecast, by Application 2020 & 2033
- Table 48: Russia Optical Variable Attenuators Volume (K) Forecast, by Application 2020 & 2033
- Table 49: Benelux Optical Variable Attenuators Revenue (million) Forecast, by Application 2020 & 2033
- Table 50: Benelux Optical Variable Attenuators Volume (K) Forecast, by Application 2020 & 2033
- Table 51: Nordics Optical Variable Attenuators Revenue (million) Forecast, by Application 2020 & 2033
- Table 52: Nordics Optical Variable Attenuators Volume (K) Forecast, by Application 2020 & 2033
- Table 53: Rest of Europe Optical Variable Attenuators Revenue (million) Forecast, by Application 2020 & 2033
- Table 54: Rest of Europe Optical Variable Attenuators Volume (K) Forecast, by Application 2020 & 2033
- Table 55: Global Optical Variable Attenuators Revenue million Forecast, by Application 2020 & 2033
- Table 56: Global Optical Variable Attenuators Volume K Forecast, by Application 2020 & 2033
- Table 57: Global Optical Variable Attenuators Revenue million Forecast, by Types 2020 & 2033
- Table 58: Global Optical Variable Attenuators Volume K Forecast, by Types 2020 & 2033
- Table 59: Global Optical Variable Attenuators Revenue million Forecast, by Country 2020 & 2033
- Table 60: Global Optical Variable Attenuators Volume K Forecast, by Country 2020 & 2033
- Table 61: Turkey Optical Variable Attenuators Revenue (million) Forecast, by Application 2020 & 2033
- Table 62: Turkey Optical Variable Attenuators Volume (K) Forecast, by Application 2020 & 2033
- Table 63: Israel Optical Variable Attenuators Revenue (million) Forecast, by Application 2020 & 2033
- Table 64: Israel Optical Variable Attenuators Volume (K) Forecast, by Application 2020 & 2033
- Table 65: GCC Optical Variable Attenuators Revenue (million) Forecast, by Application 2020 & 2033
- Table 66: GCC Optical Variable Attenuators Volume (K) Forecast, by Application 2020 & 2033
- Table 67: North Africa Optical Variable Attenuators Revenue (million) Forecast, by Application 2020 & 2033
- Table 68: North Africa Optical Variable Attenuators Volume (K) Forecast, by Application 2020 & 2033
- Table 69: South Africa Optical Variable Attenuators Revenue (million) Forecast, by Application 2020 & 2033
- Table 70: South Africa Optical Variable Attenuators Volume (K) Forecast, by Application 2020 & 2033
- Table 71: Rest of Middle East & Africa Optical Variable Attenuators Revenue (million) Forecast, by Application 2020 & 2033
- Table 72: Rest of Middle East & Africa Optical Variable Attenuators Volume (K) Forecast, by Application 2020 & 2033
- Table 73: Global Optical Variable Attenuators Revenue million Forecast, by Application 2020 & 2033
- Table 74: Global Optical Variable Attenuators Volume K Forecast, by Application 2020 & 2033
- Table 75: Global Optical Variable Attenuators Revenue million Forecast, by Types 2020 & 2033
- Table 76: Global Optical Variable Attenuators Volume K Forecast, by Types 2020 & 2033
- Table 77: Global Optical Variable Attenuators Revenue million Forecast, by Country 2020 & 2033
- Table 78: Global Optical Variable Attenuators Volume K Forecast, by Country 2020 & 2033
- Table 79: China Optical Variable Attenuators Revenue (million) Forecast, by Application 2020 & 2033
- Table 80: China Optical Variable Attenuators Volume (K) Forecast, by Application 2020 & 2033
- Table 81: India Optical Variable Attenuators Revenue (million) Forecast, by Application 2020 & 2033
- Table 82: India Optical Variable Attenuators Volume (K) Forecast, by Application 2020 & 2033
- Table 83: Japan Optical Variable Attenuators Revenue (million) Forecast, by Application 2020 & 2033
- Table 84: Japan Optical Variable Attenuators Volume (K) Forecast, by Application 2020 & 2033
- Table 85: South Korea Optical Variable Attenuators Revenue (million) Forecast, by Application 2020 & 2033
- Table 86: South Korea Optical Variable Attenuators Volume (K) Forecast, by Application 2020 & 2033
- Table 87: ASEAN Optical Variable Attenuators Revenue (million) Forecast, by Application 2020 & 2033
- Table 88: ASEAN Optical Variable Attenuators Volume (K) Forecast, by Application 2020 & 2033
- Table 89: Oceania Optical Variable Attenuators Revenue (million) Forecast, by Application 2020 & 2033
- Table 90: Oceania Optical Variable Attenuators Volume (K) Forecast, by Application 2020 & 2033
- Table 91: Rest of Asia Pacific Optical Variable Attenuators Revenue (million) Forecast, by Application 2020 & 2033
- Table 92: Rest of Asia Pacific Optical Variable Attenuators Volume (K) Forecast, by Application 2020 & 2033
Frequently Asked Questions
1. What is the projected Compound Annual Growth Rate (CAGR) of the Optical Variable Attenuators?
The projected CAGR is approximately 5%.
2. Which companies are prominent players in the Optical Variable Attenuators?
Key companies in the market include Viavi Solutions, Lumentum Operations, Mellanox Technologies, DiCon Fiberoptics, O-Net, Corning, Keysight, Accelink, EXFO, OZ Optics, NeoPhotonics, Yokogawa Electric, Thorlabs, Lightcomm Technology, Diamond, Santec, Agiltron, AC Photonics, Sun Telecom, AFL, OptiWorks, Sercalo Microtechnology.
3. What are the main segments of the Optical Variable Attenuators?
The market segments include Application, Types.
4. Can you provide details about the market size?
The market size is estimated to be USD 459 million as of 2022.
5. What are some drivers contributing to market growth?
N/A
6. What are the notable trends driving market growth?
N/A
7. Are there any restraints impacting market growth?
N/A
8. Can you provide examples of recent developments in the market?
N/A
9. What pricing options are available for accessing the report?
Pricing options include single-user, multi-user, and enterprise licenses priced at USD 3950.00, USD 5925.00, and USD 7900.00 respectively.
10. Is the market size provided in terms of value or volume?
The market size is provided in terms of value, measured in million and volume, measured in K.
11. Are there any specific market keywords associated with the report?
Yes, the market keyword associated with the report is "Optical Variable Attenuators," which aids in identifying and referencing the specific market segment covered.
12. How do I determine which pricing option suits my needs best?
The pricing options vary based on user requirements and access needs. Individual users may opt for single-user licenses, while businesses requiring broader access may choose multi-user or enterprise licenses for cost-effective access to the report.
13. Are there any additional resources or data provided in the Optical Variable Attenuators report?
While the report offers comprehensive insights, it's advisable to review the specific contents or supplementary materials provided to ascertain if additional resources or data are available.
14. How can I stay updated on further developments or reports in the Optical Variable Attenuators?
To stay informed about further developments, trends, and reports in the Optical Variable Attenuators, consider subscribing to industry newsletters, following relevant companies and organizations, or regularly checking reputable industry news sources and publications.
Methodology
Step 1 - Identification of Relevant Samples Size from Population Database


Step 2 - Approaches for Defining Global Market Size (Value, Volume* & Price*)

Note*: In applicable scenarios
Step 3 - Data Sources
Primary Research
- Web Analytics
- Survey Reports
- Research Institute
- Latest Research Reports
- Opinion Leaders
Secondary Research
- Annual Reports
- White Paper
- Latest Press Release
- Industry Association
- Paid Database
- Investor Presentations

Step 4 - Data Triangulation
Involves using different sources of information in order to increase the validity of a study
These sources are likely to be stakeholders in a program - participants, other researchers, program staff, other community members, and so on.
Then we put all data in single framework & apply various statistical tools to find out the dynamic on the market.
During the analysis stage, feedback from the stakeholder groups would be compared to determine areas of agreement as well as areas of divergence