

Key Insights
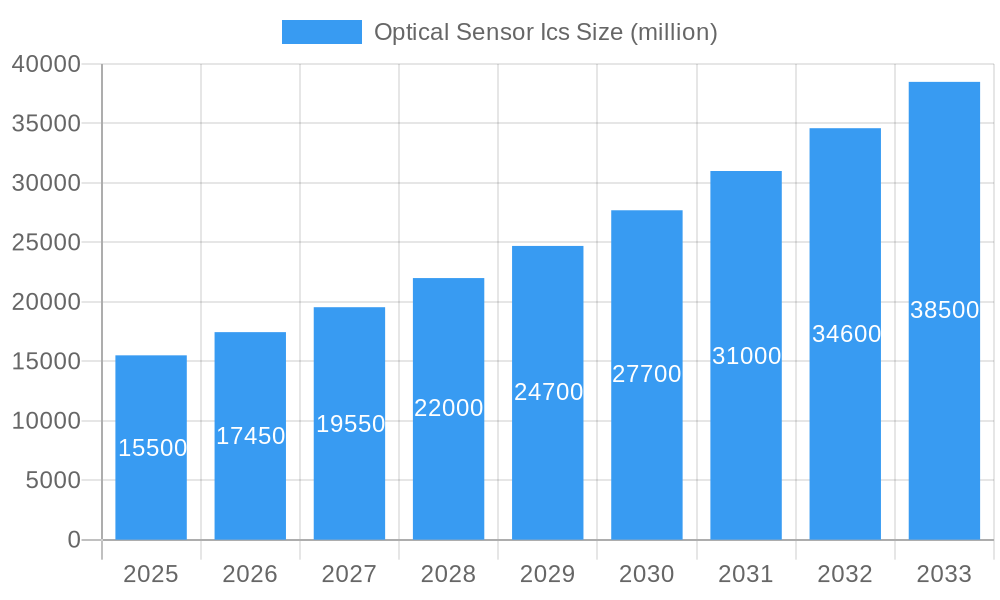
The Optical Sensor ICs market is poised for significant expansion, driven by the relentless integration of advanced sensing technologies across a multitude of sectors. Valued at an estimated USD 15,500 million in 2025, the market is projected to grow at a robust Compound Annual Growth Rate (CAGR) of 12.5% from 2025 to 2033, reaching an estimated USD 39,000 million by 2033. This substantial growth is fueled by the increasing demand for sophisticated optical sensors in consumer electronics, particularly in smartphones and wearables for features like facial recognition and advanced photography. Vehicle electronics represent another major growth engine, with optical sensors crucial for advanced driver-assistance systems (ADAS), autonomous driving capabilities, and in-cabin monitoring. The burgeoning smart security sector, encompassing surveillance, access control, and smart home devices, also presents substantial opportunities. Financial security applications, leveraging optical sensors for secure identification and transaction verification, are further contributing to market expansion.
Optical Sensor Ics Market Size (In Billion)
The market's dynamism is further shaped by key trends such as the miniaturization of optical sensor ICs, enabling their integration into increasingly compact devices. Advances in 3D sensing technologies, offering enhanced depth perception and spatial awareness, are revolutionizing applications in augmented reality, virtual reality, and robotics. Conversely, the market faces certain restraints, including the high research and development costs associated with cutting-edge sensor technology and the potential for supply chain disruptions affecting critical component availability. However, the continuous innovation in sensor performance, such as improved sensitivity, accuracy, and energy efficiency, alongside the growing adoption of these ICs in industrial control systems for automation and quality inspection, are expected to outweigh these challenges. The Asia Pacific region, led by China and its expansive manufacturing and technological ecosystem, is anticipated to dominate the market, followed by North America and Europe, each showcasing strong adoption rates across diverse applications.
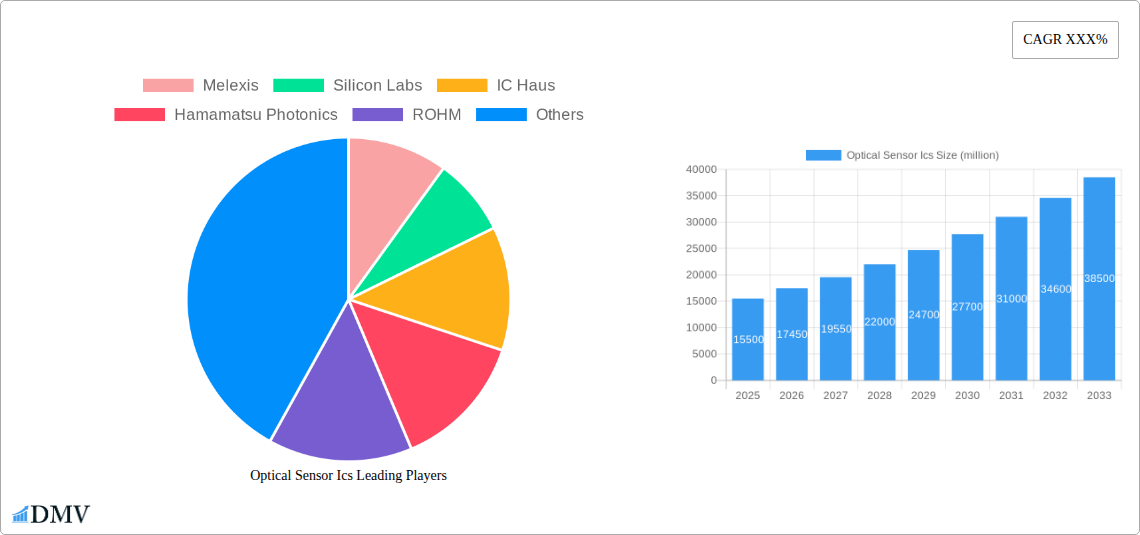
Optical Sensor Ics Company Market Share
Optical Sensor ICs Market: A Comprehensive Growth Analysis and Strategic Outlook (2019-2033)
This in-depth report provides a critical analysis of the global Optical Sensor ICs market, encompassing market composition, evolutionary trends, regional dominance, product innovations, growth drivers, obstacles, and future opportunities. Leveraging advanced analytical tools and extensive industry research, this report is indispensable for stakeholders seeking to understand market dynamics, identify strategic growth avenues, and make informed investment decisions. The study covers the historical period from 2019-2024, the base year of 2025, and forecasts market performance through 2033, offering a robust 10-year outlook. We delve into key segments such as Consumer Electronics, Vehicle Electronics, Smart Security, Financial Security, and Industrial Control, analyzing both 2D and advanced 3D optical sensor ICs.
Optical Sensor ICs Market Composition & Trends
The global Optical Sensor ICs market, projected to reach a valuation of over $50 million by 2025, exhibits a moderate to high concentration, driven by innovation from established players and emerging contenders. Key innovation catalysts include the relentless demand for miniaturization, enhanced performance, and energy efficiency across diverse applications. Regulatory landscapes, particularly concerning data privacy and device safety, are increasingly shaping product development and market entry strategies. Substitute products, such as capacitive or ultrasonic sensors, present a competitive challenge, though optical sensors maintain a distinct advantage in areas requiring high precision and contactless sensing. End-user profiles are rapidly evolving, with a significant shift towards smart and connected devices in consumer electronics and advanced driver-assistance systems (ADAS) in vehicle electronics. Mergers and acquisitions (M&A) activities, with a combined deal value exceeding $10 million in the historical period, are strategically consolidating market share and fostering technological synergy.
- Market Share Distribution: Top 5 players hold approximately 60% of the market share.
- M&A Deal Value: An aggregate of $15 million recorded in the historical period (2019-2024).
- Innovation Focus: Miniaturization, improved spectral response, and integration with AI capabilities.
- Regulatory Impact: Growing influence of CE, FCC, and REACH certifications on market access.
Optical Sensor ICs Industry Evolution
The Optical Sensor ICs industry has witnessed remarkable evolution, driven by a consistent market growth trajectory and groundbreaking technological advancements. From 2019 to 2024, the market experienced a compound annual growth rate (CAGR) of approximately 8%, fueled by the burgeoning demand for sophisticated sensing capabilities in an increasingly digitized world. The base year, 2025, is projected to see a growth rate of 9.5%, setting a strong precedent for the forecast period. This growth is intrinsically linked to the adoption of advanced sensor types, particularly 3D optical sensors, which are revolutionizing applications ranging from facial recognition and augmented reality in consumer electronics to advanced LiDAR systems in autonomous vehicles. Consumer demands are shifting towards seamless, intuitive user experiences, necessitating highly responsive and accurate optical sensors for features like gesture control, biometric authentication, and environmental monitoring. The integration of optical sensor ICs into smart home devices, wearables, and next-generation industrial automation systems continues to expand their addressable market. Furthermore, the increasing focus on safety and security applications, including advanced surveillance and contactless payment systems, is a significant contributor to the industry's sustained expansion.
- Historical CAGR (2019-2024): 8%
- Projected CAGR (2025-2033): 10%
- Adoption Metric (3D Optical Sensors): Expected to grow from 30% to 65% of the total optical sensor IC market by 2033.
- Key Technological Advancements: Time-of-Flight (ToF) sensors, spectral sensing, and improved integration with microcontrollers.
Leading Regions, Countries, or Segments in Optical Sensor ICs
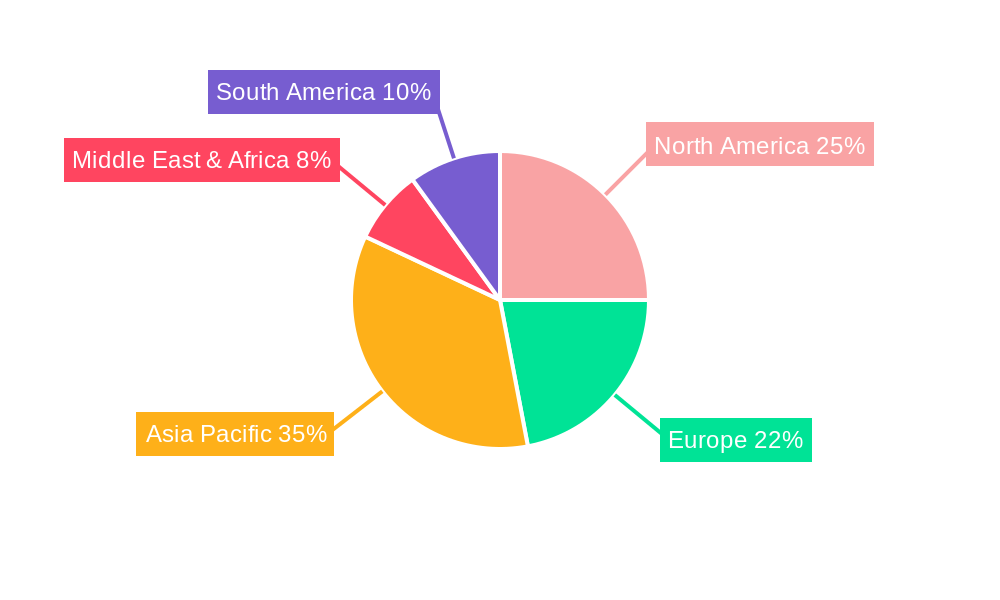
Within the dynamic Optical Sensor ICs market, Asia Pacific stands out as the dominant region, driven by its robust manufacturing capabilities, burgeoning consumer electronics industry, and significant investments in automotive and industrial automation sectors. Countries like China, South Korea, and Japan are at the forefront of both production and consumption, leveraging these optical sensor technologies for a wide array of applications. In terms of Application segments, Consumer Electronics currently leads, accounting for an estimated 35% of the market share in 2025, owing to the widespread adoption of smartphones, wearables, and smart home devices that rely heavily on optical sensing for functionality. Vehicle Electronics is a rapidly growing segment, projected to contribute 25% by 2025, with the increasing integration of ADAS, in-cabin monitoring, and advanced infotainment systems.
The Type segment is witnessing a pronounced shift towards 3D optical sensors, which are projected to capture 30% of the market by 2025 and are expected to grow at a CAGR of 12% through 2033, surpassing 2D counterparts in high-value applications. This dominance is fueled by their superior capabilities in depth perception, object recognition, and spatial mapping, essential for augmented reality, virtual reality, and advanced robotics.
- Dominant Region: Asia Pacific (estimated 40% market share in 2025).
- Key Drivers: Strong manufacturing base, high consumer demand for electronics, government support for semiconductor innovation.
- Leading Countries: China, South Korea, Japan.
- Leading Application Segment: Consumer Electronics (estimated 35% market share in 2025).
- Key Drivers: Proliferation of smartphones, wearables, smart home devices, and AR/VR technologies.
- Emerging Segments: Vehicle Electronics (projected to grow at 11% CAGR).
- Dominant Sensor Type: 3D Optical Sensors (projected 30% market share in 2025, with substantial growth).
- Key Drivers: Demand for advanced features like facial recognition, gesture control, and LiDAR.
- Technological Advancements: Time-of-Flight (ToF) and structured light technologies.
Optical Sensor ICs Product Innovations
Recent product innovations in optical sensor ICs are redefining user interaction and system capabilities. Companies are developing highly integrated and compact optical modules that combine photodiodes, amplifiers, and digital interfaces, enabling smaller form factors for consumer electronics like smartphones and wearables. Advanced 3D ToF sensors are achieving greater accuracy and longer ranges, crucial for autonomous navigation in vehicles and sophisticated gesture recognition in industrial settings. Spectral sensing ICs are also emerging, allowing for precise material identification and quality control in food processing and pharmaceuticals. These innovations focus on improved sensitivity, lower power consumption, and enhanced robustness against ambient light conditions, offering unique selling propositions such as ultra-low power consumption for battery-operated devices and superior performance in challenging environments.
Propelling Factors for Optical Sensor ICs Growth
The growth of the optical sensor ICs market is propelled by several key factors. The ever-increasing demand for advanced features in consumer electronics, such as facial recognition for security and augmented reality experiences, is a primary driver. In the automotive sector, the push towards autonomous driving and enhanced safety features, necessitating sophisticated LiDAR and in-cabin monitoring systems, is significantly boosting demand. Furthermore, the proliferation of smart security systems, both for residential and commercial applications, relies heavily on accurate and reliable optical sensors for intrusion detection and surveillance. Technological advancements, including the miniaturization of components, improved performance metrics, and cost reductions, are making optical sensors more accessible and versatile. Finally, government initiatives and investments in IoT and smart city infrastructure are creating new avenues for growth.
Obstacles in the Optical Sensor ICs Market
Despite the robust growth, the optical sensor ICs market faces certain obstacles. Regulatory hurdles related to data privacy and security can slow down the adoption of new sensing technologies, especially in sensitive applications. Supply chain disruptions, exacerbated by geopolitical factors and semiconductor shortages, can impact production volumes and lead times, potentially increasing costs. Intense competitive pressures among established players and new entrants can lead to price erosion in certain market segments. Moreover, the development and widespread adoption of alternative sensing technologies, such as advanced radar or ultrasonic sensors, present a continuous challenge that necessitates ongoing innovation.
Future Opportunities in Optical Sensor ICs
Emerging opportunities in the optical sensor ICs market are abundant. The rapid expansion of the Internet of Things (IoT) ecosystem presents significant potential for smart sensing in various applications, from environmental monitoring to industrial predictive maintenance. The growing adoption of augmented and virtual reality technologies in gaming, education, and professional training will drive demand for highly accurate 3D optical sensors. The healthcare sector is also a promising area, with opportunities in medical diagnostics, patient monitoring, and surgical robotics. Furthermore, the development of new materials and advanced packaging techniques will enable optical sensors with even greater capabilities, opening doors to novel applications in fields like advanced manufacturing and space exploration.
Major Players in the Optical Sensor ICs Ecosystem
- Melexis
- Silicon Labs
- IC Haus
- Hamamatsu Photonics
- ROHM
- Elmos Semiconductor
- Shanghai Orient-Chip Technology
- SG Micro
- Egis Technology
Key Developments in Optical Sensor ICs Industry
- 2023 Q3: Melexis launches new automotive-grade Time-of-Flight (ToF) sensor for advanced driver-assistance systems (ADAS).
- 2023 Q2: Silicon Labs announces a new family of low-power optical sensors for IoT devices.
- 2023 Q1: Hamamatsu Photonics introduces a high-sensitivity spectral sensor for industrial automation.
- 2022 Q4: ROHM develops a compact 3D imaging sensor for mobile device applications.
- 2022 Q3: Elmos Semiconductor announces significant progress in automotive LiDAR sensor development.
- 2022 Q2: Shanghai Orient-Chip Technology expands its product portfolio with new optical sensor ICs for smart security.
- 2022 Q1: SG Micro releases an innovative ambient light sensor with enhanced accuracy.
- 2021 Q4: Egis Technology announces a breakthrough in fingerprint sensor technology for financial security applications.
- 2021 Q3: IC Haus develops advanced optical sensors for challenging industrial environments.
Strategic Optical Sensor ICs Market Forecast
The strategic forecast for the Optical Sensor ICs market indicates continued robust growth, driven by escalating demand for intelligent sensing solutions across key sectors. The ongoing advancements in 3D sensing technology, particularly for consumer electronics and vehicle electronics, will remain a significant catalyst. The expansion of IoT and smart city initiatives will unlock new market segments, while the healthcare and industrial automation sectors are poised for substantial adoption. Strategic investments in R&D for higher performance, lower power consumption, and enhanced integration capabilities will be crucial for market leadership. The market is expected to witness sustained innovation, with companies focusing on developing more compact, accurate, and cost-effective optical sensor ICs to meet the evolving needs of a technologically driven world.
Optical Sensor Ics Segmentation
-
1. Application
- 1.1. Consumer Electronics
- 1.2. Vehicle Electronics
- 1.3. Smart Security
- 1.4. Financial Security
- 1.5. Industrial Control
- 1.6. Other
-
2. Type
- 2.1. 3D
- 2.2. 2D
Optical Sensor Ics Segmentation By Geography
-
1. North America
- 1.1. United States
- 1.2. Canada
- 1.3. Mexico
-
2. South America
- 2.1. Brazil
- 2.2. Argentina
- 2.3. Rest of South America
-
3. Europe
- 3.1. United Kingdom
- 3.2. Germany
- 3.3. France
- 3.4. Italy
- 3.5. Spain
- 3.6. Russia
- 3.7. Benelux
- 3.8. Nordics
- 3.9. Rest of Europe
-
4. Middle East & Africa
- 4.1. Turkey
- 4.2. Israel
- 4.3. GCC
- 4.4. North Africa
- 4.5. South Africa
- 4.6. Rest of Middle East & Africa
-
5. Asia Pacific
- 5.1. China
- 5.2. India
- 5.3. Japan
- 5.4. South Korea
- 5.5. ASEAN
- 5.6. Oceania
- 5.7. Rest of Asia Pacific
Optical Sensor Ics Regional Market Share
Geographic Coverage of Optical Sensor Ics
Optical Sensor Ics REPORT HIGHLIGHTS
| Aspects | Details |
|---|---|
| Study Period | 2020-2034 |
| Base Year | 2025 |
| Estimated Year | 2026 |
| Forecast Period | 2026-2034 |
| Historical Period | 2020-2025 |
| Growth Rate | CAGR of XXX% from 2020-2034 |
| Segmentation |
|
Table of Contents
- 1. Introduction
- 1.1. Research Scope
- 1.2. Market Segmentation
- 1.3. Research Objective
- 1.4. Definitions and Assumptions
- 2. Executive Summary
- 2.1. Market Snapshot
- 3. Market Dynamics
- 3.1. Market Drivers
- 3.2. Market Restrains
- 3.3. Market Trends
- 3.4. Market Opportunities
- 4. Market Factor Analysis
- 4.1. Porters Five Forces
- 4.1.1. Bargaining Power of Suppliers
- 4.1.2. Bargaining Power of Buyers
- 4.1.3. Threat of New Entrants
- 4.1.4. Threat of Substitutes
- 4.1.5. Competitive Rivalry
- 4.2. PESTEL analysis
- 4.3. BCG Analysis
- 4.3.1. Stars (High Growth, High Market Share)
- 4.3.2. Cash Cows (Low Growth, High Market Share)
- 4.3.3. Question Mark (High Growth, Low Market Share)
- 4.3.4. Dogs (Low Growth, Low Market Share)
- 4.4. Ansoff Matrix Analysis
- 4.5. Supply Chain Analysis
- 4.6. Regulatory Landscape
- 4.7. Current Market Potential and Opportunity Assessment (TAM–SAM–SOM Framework)
- 4.8. DMV Analyst Note
- 4.1. Porters Five Forces
- 5. Market Analysis, Insights and Forecast 2021-2033
- 5.1. Market Analysis, Insights and Forecast - by Application
- 5.1.1. Consumer Electronics
- 5.1.2. Vehicle Electronics
- 5.1.3. Smart Security
- 5.1.4. Financial Security
- 5.1.5. Industrial Control
- 5.1.6. Other
- 5.2. Market Analysis, Insights and Forecast - by Type
- 5.2.1. 3D
- 5.2.2. 2D
- 5.3. Market Analysis, Insights and Forecast - by Region
- 5.3.1. North America
- 5.3.2. South America
- 5.3.3. Europe
- 5.3.4. Middle East & Africa
- 5.3.5. Asia Pacific
- 5.1. Market Analysis, Insights and Forecast - by Application
- 6. Global Optical Sensor Ics Analysis, Insights and Forecast, 2021-2033
- 6.1. Market Analysis, Insights and Forecast - by Application
- 6.1.1. Consumer Electronics
- 6.1.2. Vehicle Electronics
- 6.1.3. Smart Security
- 6.1.4. Financial Security
- 6.1.5. Industrial Control
- 6.1.6. Other
- 6.2. Market Analysis, Insights and Forecast - by Type
- 6.2.1. 3D
- 6.2.2. 2D
- 6.1. Market Analysis, Insights and Forecast - by Application
- 7. North America Optical Sensor Ics Analysis, Insights and Forecast, 2020-2032
- 7.1. Market Analysis, Insights and Forecast - by Application
- 7.1.1. Consumer Electronics
- 7.1.2. Vehicle Electronics
- 7.1.3. Smart Security
- 7.1.4. Financial Security
- 7.1.5. Industrial Control
- 7.1.6. Other
- 7.2. Market Analysis, Insights and Forecast - by Type
- 7.2.1. 3D
- 7.2.2. 2D
- 7.1. Market Analysis, Insights and Forecast - by Application
- 8. South America Optical Sensor Ics Analysis, Insights and Forecast, 2020-2032
- 8.1. Market Analysis, Insights and Forecast - by Application
- 8.1.1. Consumer Electronics
- 8.1.2. Vehicle Electronics
- 8.1.3. Smart Security
- 8.1.4. Financial Security
- 8.1.5. Industrial Control
- 8.1.6. Other
- 8.2. Market Analysis, Insights and Forecast - by Type
- 8.2.1. 3D
- 8.2.2. 2D
- 8.1. Market Analysis, Insights and Forecast - by Application
- 9. Europe Optical Sensor Ics Analysis, Insights and Forecast, 2020-2032
- 9.1. Market Analysis, Insights and Forecast - by Application
- 9.1.1. Consumer Electronics
- 9.1.2. Vehicle Electronics
- 9.1.3. Smart Security
- 9.1.4. Financial Security
- 9.1.5. Industrial Control
- 9.1.6. Other
- 9.2. Market Analysis, Insights and Forecast - by Type
- 9.2.1. 3D
- 9.2.2. 2D
- 9.1. Market Analysis, Insights and Forecast - by Application
- 10. Middle East & Africa Optical Sensor Ics Analysis, Insights and Forecast, 2020-2032
- 10.1. Market Analysis, Insights and Forecast - by Application
- 10.1.1. Consumer Electronics
- 10.1.2. Vehicle Electronics
- 10.1.3. Smart Security
- 10.1.4. Financial Security
- 10.1.5. Industrial Control
- 10.1.6. Other
- 10.2. Market Analysis, Insights and Forecast - by Type
- 10.2.1. 3D
- 10.2.2. 2D
- 10.1. Market Analysis, Insights and Forecast - by Application
- 11. Asia Pacific Optical Sensor Ics Analysis, Insights and Forecast, 2020-2032
- 11.1. Market Analysis, Insights and Forecast - by Application
- 11.1.1. Consumer Electronics
- 11.1.2. Vehicle Electronics
- 11.1.3. Smart Security
- 11.1.4. Financial Security
- 11.1.5. Industrial Control
- 11.1.6. Other
- 11.2. Market Analysis, Insights and Forecast - by Type
- 11.2.1. 3D
- 11.2.2. 2D
- 11.1. Market Analysis, Insights and Forecast - by Application
- 12. Competitive Analysis
- 12.1. Company Profiles
- 12.1.1 Melexis
- 12.1.1.1. Company Overview
- 12.1.1.2. Products
- 12.1.1.3. Company Financials
- 12.1.1.4. SWOT Analysis
- 12.1.2 Silicon Labs
- 12.1.2.1. Company Overview
- 12.1.2.2. Products
- 12.1.2.3. Company Financials
- 12.1.2.4. SWOT Analysis
- 12.1.3 IC Haus
- 12.1.3.1. Company Overview
- 12.1.3.2. Products
- 12.1.3.3. Company Financials
- 12.1.3.4. SWOT Analysis
- 12.1.4 Hamamatsu Photonics
- 12.1.4.1. Company Overview
- 12.1.4.2. Products
- 12.1.4.3. Company Financials
- 12.1.4.4. SWOT Analysis
- 12.1.5 ROHM
- 12.1.5.1. Company Overview
- 12.1.5.2. Products
- 12.1.5.3. Company Financials
- 12.1.5.4. SWOT Analysis
- 12.1.6 Elmos Semiconductor
- 12.1.6.1. Company Overview
- 12.1.6.2. Products
- 12.1.6.3. Company Financials
- 12.1.6.4. SWOT Analysis
- 12.1.7 Shanghai Orient-Chip Technology
- 12.1.7.1. Company Overview
- 12.1.7.2. Products
- 12.1.7.3. Company Financials
- 12.1.7.4. SWOT Analysis
- 12.1.8 SG Micro
- 12.1.8.1. Company Overview
- 12.1.8.2. Products
- 12.1.8.3. Company Financials
- 12.1.8.4. SWOT Analysis
- 12.1.9 Egis Technology
- 12.1.9.1. Company Overview
- 12.1.9.2. Products
- 12.1.9.3. Company Financials
- 12.1.9.4. SWOT Analysis
- 12.1.1 Melexis
- 12.2. Market Entropy
- 12.2.1 Company's Key Areas Served
- 12.2.2 Recent Developments
- 12.3. Company Market Share Analysis 2025
- 12.3.1 Top 5 Companies Market Share Analysis
- 12.3.2 Top 3 Companies Market Share Analysis
- 12.4. List of Potential Customers
- 13. Research Methodology
List of Figures
- Figure 1: Global Optical Sensor Ics Revenue Breakdown (million, %) by Region 2025 & 2033
- Figure 2: Global Optical Sensor Ics Volume Breakdown (K, %) by Region 2025 & 2033
- Figure 3: North America Optical Sensor Ics Revenue (million), by Application 2025 & 2033
- Figure 4: North America Optical Sensor Ics Volume (K), by Application 2025 & 2033
- Figure 5: North America Optical Sensor Ics Revenue Share (%), by Application 2025 & 2033
- Figure 6: North America Optical Sensor Ics Volume Share (%), by Application 2025 & 2033
- Figure 7: North America Optical Sensor Ics Revenue (million), by Type 2025 & 2033
- Figure 8: North America Optical Sensor Ics Volume (K), by Type 2025 & 2033
- Figure 9: North America Optical Sensor Ics Revenue Share (%), by Type 2025 & 2033
- Figure 10: North America Optical Sensor Ics Volume Share (%), by Type 2025 & 2033
- Figure 11: North America Optical Sensor Ics Revenue (million), by Country 2025 & 2033
- Figure 12: North America Optical Sensor Ics Volume (K), by Country 2025 & 2033
- Figure 13: North America Optical Sensor Ics Revenue Share (%), by Country 2025 & 2033
- Figure 14: North America Optical Sensor Ics Volume Share (%), by Country 2025 & 2033
- Figure 15: South America Optical Sensor Ics Revenue (million), by Application 2025 & 2033
- Figure 16: South America Optical Sensor Ics Volume (K), by Application 2025 & 2033
- Figure 17: South America Optical Sensor Ics Revenue Share (%), by Application 2025 & 2033
- Figure 18: South America Optical Sensor Ics Volume Share (%), by Application 2025 & 2033
- Figure 19: South America Optical Sensor Ics Revenue (million), by Type 2025 & 2033
- Figure 20: South America Optical Sensor Ics Volume (K), by Type 2025 & 2033
- Figure 21: South America Optical Sensor Ics Revenue Share (%), by Type 2025 & 2033
- Figure 22: South America Optical Sensor Ics Volume Share (%), by Type 2025 & 2033
- Figure 23: South America Optical Sensor Ics Revenue (million), by Country 2025 & 2033
- Figure 24: South America Optical Sensor Ics Volume (K), by Country 2025 & 2033
- Figure 25: South America Optical Sensor Ics Revenue Share (%), by Country 2025 & 2033
- Figure 26: South America Optical Sensor Ics Volume Share (%), by Country 2025 & 2033
- Figure 27: Europe Optical Sensor Ics Revenue (million), by Application 2025 & 2033
- Figure 28: Europe Optical Sensor Ics Volume (K), by Application 2025 & 2033
- Figure 29: Europe Optical Sensor Ics Revenue Share (%), by Application 2025 & 2033
- Figure 30: Europe Optical Sensor Ics Volume Share (%), by Application 2025 & 2033
- Figure 31: Europe Optical Sensor Ics Revenue (million), by Type 2025 & 2033
- Figure 32: Europe Optical Sensor Ics Volume (K), by Type 2025 & 2033
- Figure 33: Europe Optical Sensor Ics Revenue Share (%), by Type 2025 & 2033
- Figure 34: Europe Optical Sensor Ics Volume Share (%), by Type 2025 & 2033
- Figure 35: Europe Optical Sensor Ics Revenue (million), by Country 2025 & 2033
- Figure 36: Europe Optical Sensor Ics Volume (K), by Country 2025 & 2033
- Figure 37: Europe Optical Sensor Ics Revenue Share (%), by Country 2025 & 2033
- Figure 38: Europe Optical Sensor Ics Volume Share (%), by Country 2025 & 2033
- Figure 39: Middle East & Africa Optical Sensor Ics Revenue (million), by Application 2025 & 2033
- Figure 40: Middle East & Africa Optical Sensor Ics Volume (K), by Application 2025 & 2033
- Figure 41: Middle East & Africa Optical Sensor Ics Revenue Share (%), by Application 2025 & 2033
- Figure 42: Middle East & Africa Optical Sensor Ics Volume Share (%), by Application 2025 & 2033
- Figure 43: Middle East & Africa Optical Sensor Ics Revenue (million), by Type 2025 & 2033
- Figure 44: Middle East & Africa Optical Sensor Ics Volume (K), by Type 2025 & 2033
- Figure 45: Middle East & Africa Optical Sensor Ics Revenue Share (%), by Type 2025 & 2033
- Figure 46: Middle East & Africa Optical Sensor Ics Volume Share (%), by Type 2025 & 2033
- Figure 47: Middle East & Africa Optical Sensor Ics Revenue (million), by Country 2025 & 2033
- Figure 48: Middle East & Africa Optical Sensor Ics Volume (K), by Country 2025 & 2033
- Figure 49: Middle East & Africa Optical Sensor Ics Revenue Share (%), by Country 2025 & 2033
- Figure 50: Middle East & Africa Optical Sensor Ics Volume Share (%), by Country 2025 & 2033
- Figure 51: Asia Pacific Optical Sensor Ics Revenue (million), by Application 2025 & 2033
- Figure 52: Asia Pacific Optical Sensor Ics Volume (K), by Application 2025 & 2033
- Figure 53: Asia Pacific Optical Sensor Ics Revenue Share (%), by Application 2025 & 2033
- Figure 54: Asia Pacific Optical Sensor Ics Volume Share (%), by Application 2025 & 2033
- Figure 55: Asia Pacific Optical Sensor Ics Revenue (million), by Type 2025 & 2033
- Figure 56: Asia Pacific Optical Sensor Ics Volume (K), by Type 2025 & 2033
- Figure 57: Asia Pacific Optical Sensor Ics Revenue Share (%), by Type 2025 & 2033
- Figure 58: Asia Pacific Optical Sensor Ics Volume Share (%), by Type 2025 & 2033
- Figure 59: Asia Pacific Optical Sensor Ics Revenue (million), by Country 2025 & 2033
- Figure 60: Asia Pacific Optical Sensor Ics Volume (K), by Country 2025 & 2033
- Figure 61: Asia Pacific Optical Sensor Ics Revenue Share (%), by Country 2025 & 2033
- Figure 62: Asia Pacific Optical Sensor Ics Volume Share (%), by Country 2025 & 2033
List of Tables
- Table 1: Global Optical Sensor Ics Revenue million Forecast, by Application 2020 & 2033
- Table 2: Global Optical Sensor Ics Volume K Forecast, by Application 2020 & 2033
- Table 3: Global Optical Sensor Ics Revenue million Forecast, by Type 2020 & 2033
- Table 4: Global Optical Sensor Ics Volume K Forecast, by Type 2020 & 2033
- Table 5: Global Optical Sensor Ics Revenue million Forecast, by Region 2020 & 2033
- Table 6: Global Optical Sensor Ics Volume K Forecast, by Region 2020 & 2033
- Table 7: Global Optical Sensor Ics Revenue million Forecast, by Application 2020 & 2033
- Table 8: Global Optical Sensor Ics Volume K Forecast, by Application 2020 & 2033
- Table 9: Global Optical Sensor Ics Revenue million Forecast, by Type 2020 & 2033
- Table 10: Global Optical Sensor Ics Volume K Forecast, by Type 2020 & 2033
- Table 11: Global Optical Sensor Ics Revenue million Forecast, by Country 2020 & 2033
- Table 12: Global Optical Sensor Ics Volume K Forecast, by Country 2020 & 2033
- Table 13: United States Optical Sensor Ics Revenue (million) Forecast, by Application 2020 & 2033
- Table 14: United States Optical Sensor Ics Volume (K) Forecast, by Application 2020 & 2033
- Table 15: Canada Optical Sensor Ics Revenue (million) Forecast, by Application 2020 & 2033
- Table 16: Canada Optical Sensor Ics Volume (K) Forecast, by Application 2020 & 2033
- Table 17: Mexico Optical Sensor Ics Revenue (million) Forecast, by Application 2020 & 2033
- Table 18: Mexico Optical Sensor Ics Volume (K) Forecast, by Application 2020 & 2033
- Table 19: Global Optical Sensor Ics Revenue million Forecast, by Application 2020 & 2033
- Table 20: Global Optical Sensor Ics Volume K Forecast, by Application 2020 & 2033
- Table 21: Global Optical Sensor Ics Revenue million Forecast, by Type 2020 & 2033
- Table 22: Global Optical Sensor Ics Volume K Forecast, by Type 2020 & 2033
- Table 23: Global Optical Sensor Ics Revenue million Forecast, by Country 2020 & 2033
- Table 24: Global Optical Sensor Ics Volume K Forecast, by Country 2020 & 2033
- Table 25: Brazil Optical Sensor Ics Revenue (million) Forecast, by Application 2020 & 2033
- Table 26: Brazil Optical Sensor Ics Volume (K) Forecast, by Application 2020 & 2033
- Table 27: Argentina Optical Sensor Ics Revenue (million) Forecast, by Application 2020 & 2033
- Table 28: Argentina Optical Sensor Ics Volume (K) Forecast, by Application 2020 & 2033
- Table 29: Rest of South America Optical Sensor Ics Revenue (million) Forecast, by Application 2020 & 2033
- Table 30: Rest of South America Optical Sensor Ics Volume (K) Forecast, by Application 2020 & 2033
- Table 31: Global Optical Sensor Ics Revenue million Forecast, by Application 2020 & 2033
- Table 32: Global Optical Sensor Ics Volume K Forecast, by Application 2020 & 2033
- Table 33: Global Optical Sensor Ics Revenue million Forecast, by Type 2020 & 2033
- Table 34: Global Optical Sensor Ics Volume K Forecast, by Type 2020 & 2033
- Table 35: Global Optical Sensor Ics Revenue million Forecast, by Country 2020 & 2033
- Table 36: Global Optical Sensor Ics Volume K Forecast, by Country 2020 & 2033
- Table 37: United Kingdom Optical Sensor Ics Revenue (million) Forecast, by Application 2020 & 2033
- Table 38: United Kingdom Optical Sensor Ics Volume (K) Forecast, by Application 2020 & 2033
- Table 39: Germany Optical Sensor Ics Revenue (million) Forecast, by Application 2020 & 2033
- Table 40: Germany Optical Sensor Ics Volume (K) Forecast, by Application 2020 & 2033
- Table 41: France Optical Sensor Ics Revenue (million) Forecast, by Application 2020 & 2033
- Table 42: France Optical Sensor Ics Volume (K) Forecast, by Application 2020 & 2033
- Table 43: Italy Optical Sensor Ics Revenue (million) Forecast, by Application 2020 & 2033
- Table 44: Italy Optical Sensor Ics Volume (K) Forecast, by Application 2020 & 2033
- Table 45: Spain Optical Sensor Ics Revenue (million) Forecast, by Application 2020 & 2033
- Table 46: Spain Optical Sensor Ics Volume (K) Forecast, by Application 2020 & 2033
- Table 47: Russia Optical Sensor Ics Revenue (million) Forecast, by Application 2020 & 2033
- Table 48: Russia Optical Sensor Ics Volume (K) Forecast, by Application 2020 & 2033
- Table 49: Benelux Optical Sensor Ics Revenue (million) Forecast, by Application 2020 & 2033
- Table 50: Benelux Optical Sensor Ics Volume (K) Forecast, by Application 2020 & 2033
- Table 51: Nordics Optical Sensor Ics Revenue (million) Forecast, by Application 2020 & 2033
- Table 52: Nordics Optical Sensor Ics Volume (K) Forecast, by Application 2020 & 2033
- Table 53: Rest of Europe Optical Sensor Ics Revenue (million) Forecast, by Application 2020 & 2033
- Table 54: Rest of Europe Optical Sensor Ics Volume (K) Forecast, by Application 2020 & 2033
- Table 55: Global Optical Sensor Ics Revenue million Forecast, by Application 2020 & 2033
- Table 56: Global Optical Sensor Ics Volume K Forecast, by Application 2020 & 2033
- Table 57: Global Optical Sensor Ics Revenue million Forecast, by Type 2020 & 2033
- Table 58: Global Optical Sensor Ics Volume K Forecast, by Type 2020 & 2033
- Table 59: Global Optical Sensor Ics Revenue million Forecast, by Country 2020 & 2033
- Table 60: Global Optical Sensor Ics Volume K Forecast, by Country 2020 & 2033
- Table 61: Turkey Optical Sensor Ics Revenue (million) Forecast, by Application 2020 & 2033
- Table 62: Turkey Optical Sensor Ics Volume (K) Forecast, by Application 2020 & 2033
- Table 63: Israel Optical Sensor Ics Revenue (million) Forecast, by Application 2020 & 2033
- Table 64: Israel Optical Sensor Ics Volume (K) Forecast, by Application 2020 & 2033
- Table 65: GCC Optical Sensor Ics Revenue (million) Forecast, by Application 2020 & 2033
- Table 66: GCC Optical Sensor Ics Volume (K) Forecast, by Application 2020 & 2033
- Table 67: North Africa Optical Sensor Ics Revenue (million) Forecast, by Application 2020 & 2033
- Table 68: North Africa Optical Sensor Ics Volume (K) Forecast, by Application 2020 & 2033
- Table 69: South Africa Optical Sensor Ics Revenue (million) Forecast, by Application 2020 & 2033
- Table 70: South Africa Optical Sensor Ics Volume (K) Forecast, by Application 2020 & 2033
- Table 71: Rest of Middle East & Africa Optical Sensor Ics Revenue (million) Forecast, by Application 2020 & 2033
- Table 72: Rest of Middle East & Africa Optical Sensor Ics Volume (K) Forecast, by Application 2020 & 2033
- Table 73: Global Optical Sensor Ics Revenue million Forecast, by Application 2020 & 2033
- Table 74: Global Optical Sensor Ics Volume K Forecast, by Application 2020 & 2033
- Table 75: Global Optical Sensor Ics Revenue million Forecast, by Type 2020 & 2033
- Table 76: Global Optical Sensor Ics Volume K Forecast, by Type 2020 & 2033
- Table 77: Global Optical Sensor Ics Revenue million Forecast, by Country 2020 & 2033
- Table 78: Global Optical Sensor Ics Volume K Forecast, by Country 2020 & 2033
- Table 79: China Optical Sensor Ics Revenue (million) Forecast, by Application 2020 & 2033
- Table 80: China Optical Sensor Ics Volume (K) Forecast, by Application 2020 & 2033
- Table 81: India Optical Sensor Ics Revenue (million) Forecast, by Application 2020 & 2033
- Table 82: India Optical Sensor Ics Volume (K) Forecast, by Application 2020 & 2033
- Table 83: Japan Optical Sensor Ics Revenue (million) Forecast, by Application 2020 & 2033
- Table 84: Japan Optical Sensor Ics Volume (K) Forecast, by Application 2020 & 2033
- Table 85: South Korea Optical Sensor Ics Revenue (million) Forecast, by Application 2020 & 2033
- Table 86: South Korea Optical Sensor Ics Volume (K) Forecast, by Application 2020 & 2033
- Table 87: ASEAN Optical Sensor Ics Revenue (million) Forecast, by Application 2020 & 2033
- Table 88: ASEAN Optical Sensor Ics Volume (K) Forecast, by Application 2020 & 2033
- Table 89: Oceania Optical Sensor Ics Revenue (million) Forecast, by Application 2020 & 2033
- Table 90: Oceania Optical Sensor Ics Volume (K) Forecast, by Application 2020 & 2033
- Table 91: Rest of Asia Pacific Optical Sensor Ics Revenue (million) Forecast, by Application 2020 & 2033
- Table 92: Rest of Asia Pacific Optical Sensor Ics Volume (K) Forecast, by Application 2020 & 2033
Frequently Asked Questions
1. What is the projected Compound Annual Growth Rate (CAGR) of the Optical Sensor Ics?
The projected CAGR is approximately XXX%.
2. Which companies are prominent players in the Optical Sensor Ics?
Key companies in the market include Melexis, Silicon Labs, IC Haus, Hamamatsu Photonics, ROHM, Elmos Semiconductor, Shanghai Orient-Chip Technology, SG Micro, Egis Technology.
3. What are the main segments of the Optical Sensor Ics?
The market segments include Application, Type.
4. Can you provide details about the market size?
The market size is estimated to be USD XXX million as of 2022.
5. What are some drivers contributing to market growth?
N/A
6. What are the notable trends driving market growth?
N/A
7. Are there any restraints impacting market growth?
N/A
8. Can you provide examples of recent developments in the market?
N/A
9. What pricing options are available for accessing the report?
Pricing options include single-user, multi-user, and enterprise licenses priced at USD 3950.00, USD 5925.00, and USD 7900.00 respectively.
10. Is the market size provided in terms of value or volume?
The market size is provided in terms of value, measured in million and volume, measured in K.
11. Are there any specific market keywords associated with the report?
Yes, the market keyword associated with the report is "Optical Sensor Ics," which aids in identifying and referencing the specific market segment covered.
12. How do I determine which pricing option suits my needs best?
The pricing options vary based on user requirements and access needs. Individual users may opt for single-user licenses, while businesses requiring broader access may choose multi-user or enterprise licenses for cost-effective access to the report.
13. Are there any additional resources or data provided in the Optical Sensor Ics report?
While the report offers comprehensive insights, it's advisable to review the specific contents or supplementary materials provided to ascertain if additional resources or data are available.
14. How can I stay updated on further developments or reports in the Optical Sensor Ics?
To stay informed about further developments, trends, and reports in the Optical Sensor Ics, consider subscribing to industry newsletters, following relevant companies and organizations, or regularly checking reputable industry news sources and publications.
Methodology
Step 1 - Identification of Relevant Samples Size from Population Database


Step 2 - Approaches for Defining Global Market Size (Value, Volume* & Price*)

Note*: In applicable scenarios
Step 3 - Data Sources
Primary Research
- Web Analytics
- Survey Reports
- Research Institute
- Latest Research Reports
- Opinion Leaders
Secondary Research
- Annual Reports
- White Paper
- Latest Press Release
- Industry Association
- Paid Database
- Investor Presentations

Step 4 - Data Triangulation
Involves using different sources of information in order to increase the validity of a study
These sources are likely to be stakeholders in a program - participants, other researchers, program staff, other community members, and so on.
Then we put all data in single framework & apply various statistical tools to find out the dynamic on the market.
During the analysis stage, feedback from the stakeholder groups would be compared to determine areas of agreement as well as areas of divergence