

Key Insights
The Natural Disaster Detection IoT System market is poised for significant expansion, with a current market size of $408 million in 2025. This robust growth is propelled by a remarkable Compound Annual Growth Rate (CAGR) of 36%, indicating a rapidly evolving and critical sector. The increasing frequency and intensity of natural disasters globally, coupled with the escalating need for timely and accurate early warning systems, are the primary drivers of this market surge. The deployment of Internet of Things (IoT) technology allows for real-time data collection from a vast network of sensors, offering unprecedented capabilities in monitoring environmental parameters. This enables proactive measures to mitigate damage, protect lives, and safeguard infrastructure, thereby underscoring the indispensable role of these systems in modern disaster management strategies. Furthermore, advancements in sensor technology, AI-driven analytics for predictive modeling, and improved communication networks are contributing to the enhanced effectiveness and adoption of these solutions.
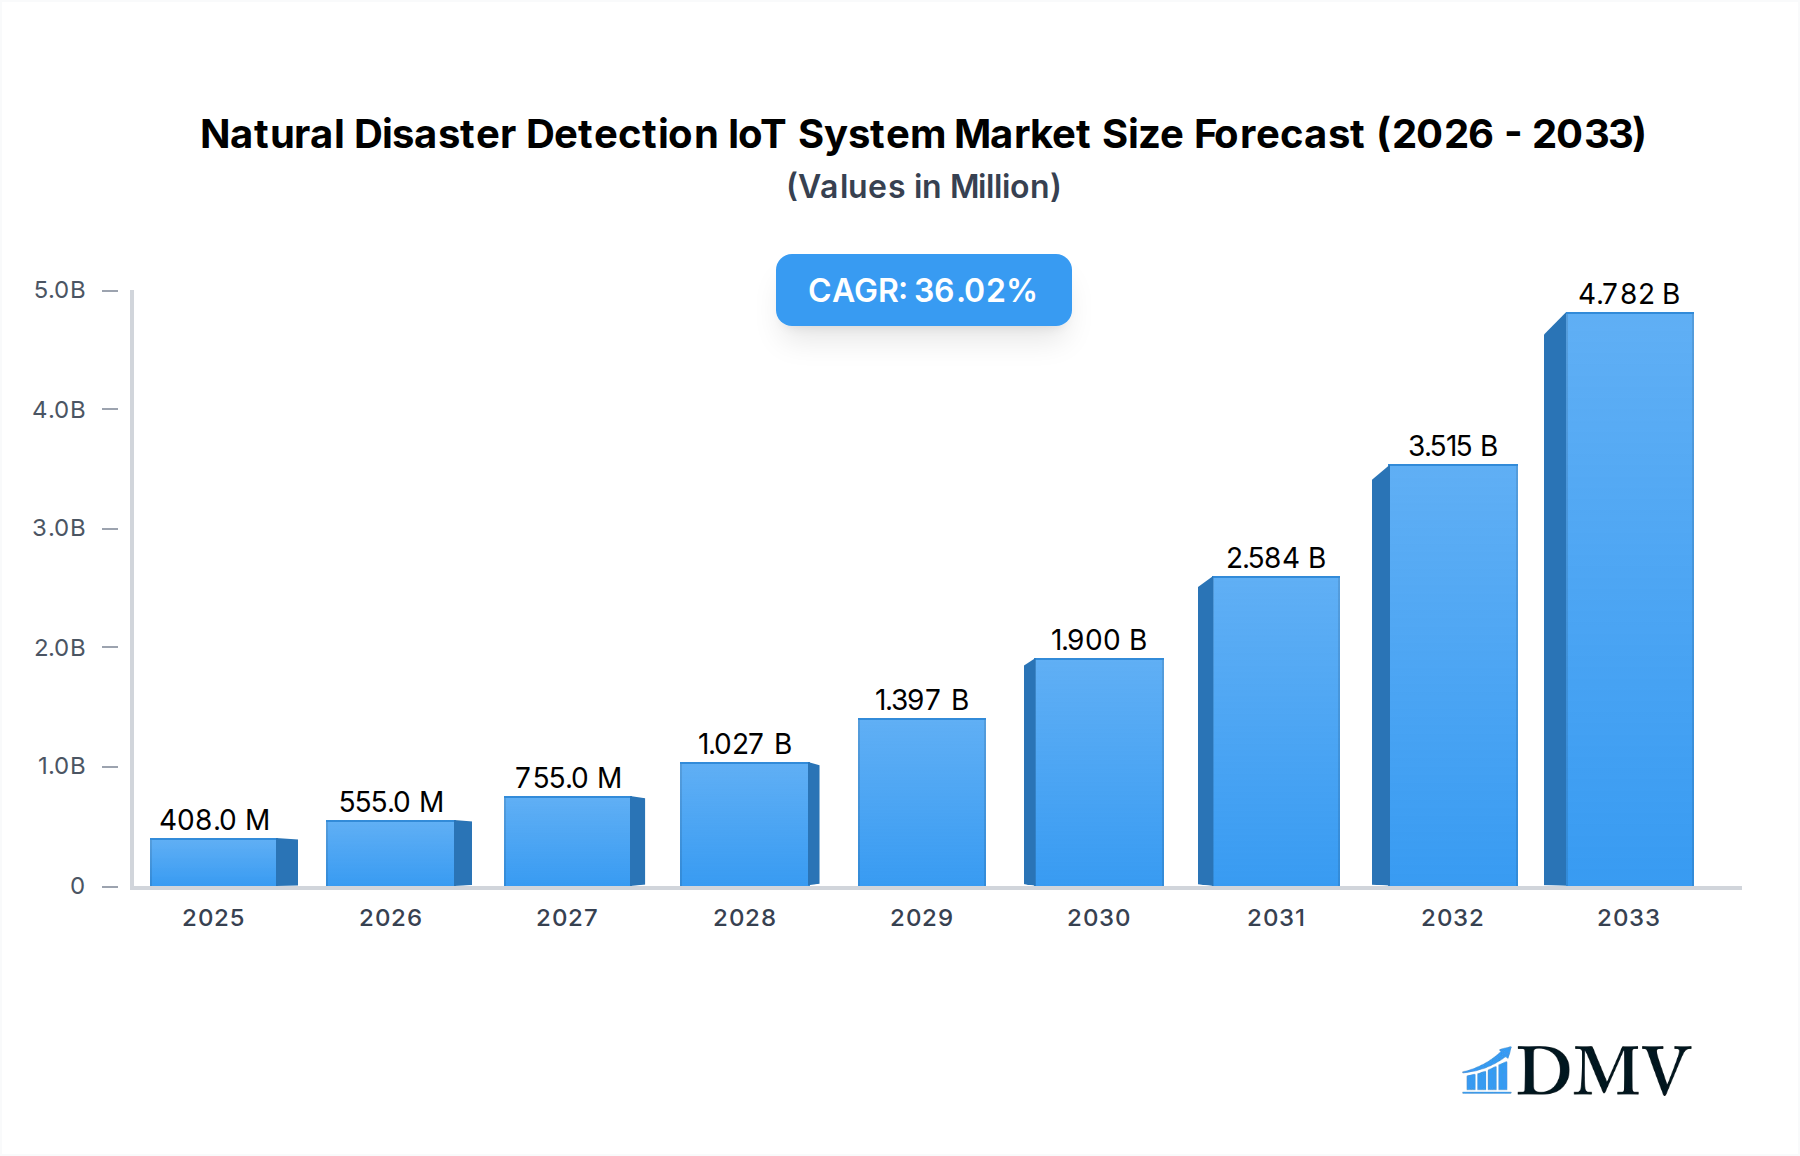
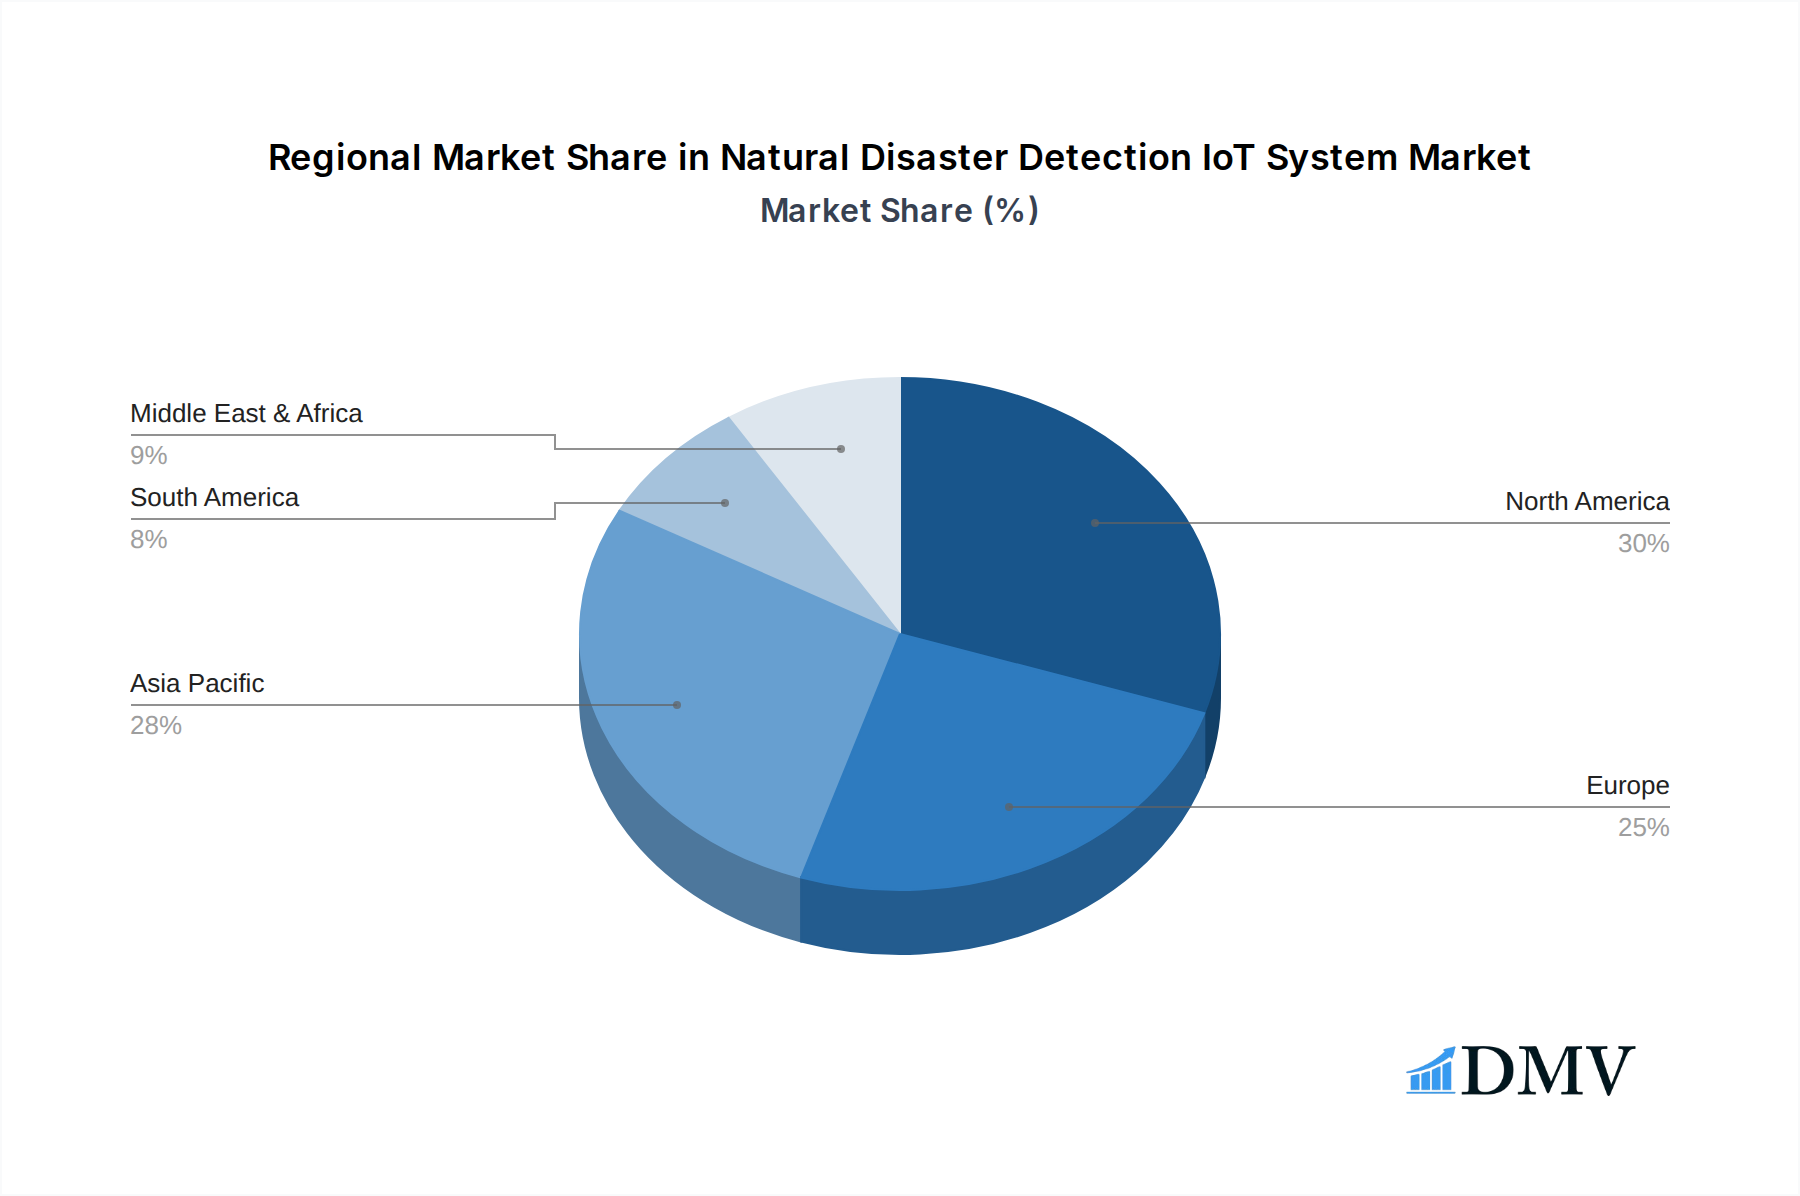
Natural Disaster Detection IoT System Market Size (In Million)
The market is segmented across various applications, including Flood Detection, Drought Detection, Wildfire Detection, and Landslide Detection, reflecting the diverse threats posed by natural calamities. The "Others" category likely encompasses emerging applications or specialized detection systems. On the type front, the market is divided into Solutions, Software, and "Others," with a clear trend towards integrated, comprehensive solution offerings that combine hardware, software, and analytical services. Key players such as NEC Corporation, Blackberry, Semtech, Sony, and SAP are at the forefront, innovating and expanding their portfolios to meet the growing demand. Geographically, North America is expected to lead, driven by advanced technological infrastructure and significant investment in disaster preparedness. However, the Asia Pacific region, with its vulnerability to a wide array of natural disasters and a rapidly growing adoption of IoT, presents substantial growth opportunities. The market's trajectory suggests a future where IoT-enabled disaster detection becomes a standard component of national and international safety frameworks.

Natural Disaster Detection IoT System Company Market Share
Natural Disaster Detection IoT System Market Composition & Trends
The global Natural Disaster Detection IoT System market demonstrates a moderate concentration, with key players like Nec Corporation, Blackberry, Semtech, Sony, Nokia, SAP, Intel, Green Stream Technologies, Earth Networks, and Responscity Systems vying for market share. Innovation remains a significant catalyst, driven by advancements in sensor technology, AI-powered analytics, and robust cloud infrastructure. The regulatory landscape is evolving, with governments worldwide increasingly mandating or incentivizing the adoption of early warning systems to mitigate the devastating impact of natural calamities. Substitute products, such as traditional manual monitoring systems, are gradually being phased out due to their inherent limitations in real-time data acquisition and analysis. End-user profiles span critical infrastructure operators, governmental disaster management agencies, agricultural enterprises, and insurance companies, all seeking to minimize losses and protect lives. Mergers and acquisitions (M&A) activities, projected to reach XXX million in deal value over the study period, are shaping the market, enabling companies to consolidate their offerings, expand their geographical reach, and acquire critical technologies. Market share distribution currently sees Flood Detection applications leading, followed by Wildfire Detection, accounting for an estimated XX% and XX% respectively in the base year.
Natural Disaster Detection IoT System Industry Evolution
The Natural Disaster Detection IoT System industry is witnessing a remarkable evolution, characterized by consistent growth trajectories and rapid technological advancements. Over the historical period from 2019 to 2024, the market has expanded at a Compound Annual Growth Rate (CAGR) of approximately XX%, a testament to the increasing urgency and investment in disaster preparedness. The base year of 2025 is estimated to see market revenues reaching XXX million, with projections indicating a robust CAGR of XX% during the forecast period of 2025–2033. This expansion is largely fueled by a paradigm shift in how communities and organizations approach disaster management, moving from reactive responses to proactive detection and early warning systems.
Technological advancements have been the primary engine of this evolution. The integration of the Internet of Things (IoT) has revolutionized data collection capabilities. Sophisticated sensors, ranging from advanced seismic sensors for landslide detection to satellite imagery analysis for wildfire identification and hydrological sensors for flood monitoring, are now capable of providing real-time, granular data. This data is then processed and analyzed using Artificial Intelligence (AI) and Machine Learning (ML) algorithms, enabling more accurate predictions, faster alert dissemination, and optimized resource allocation. For instance, the adoption of AI-driven predictive analytics for flood forecasting has seen a XX% increase in accuracy compared to traditional methods.
Furthermore, the proliferation of low-power wide-area network (LPWAN) technologies like LoRaWAN and NB-IoT has made it feasible to deploy vast networks of sensors in remote and challenging terrains, crucial for comprehensive disaster monitoring. The increasing availability of cloud computing services has provided the necessary infrastructure for storing, processing, and analyzing the immense volumes of data generated by these IoT systems, making sophisticated analytics accessible and scalable.
Shifting consumer and organizational demands have also played a pivotal role. As the frequency and intensity of natural disasters escalate due to climate change, there's a growing awareness and demand for reliable, real-time detection and warning systems. Governments, driven by the need to protect citizens and infrastructure, are investing heavily in national disaster management initiatives. Insurance companies are actively promoting the adoption of these systems to mitigate risks and reduce claim payouts. The private sector, particularly those operating in disaster-prone regions or managing critical infrastructure, is recognizing the economic imperative of minimizing operational disruptions and asset damage. The adoption rate of IoT-based natural disaster detection solutions across various industries has surged by an estimated XX% between 2020 and 2024, reflecting this increasing demand for enhanced resilience and safety.
Leading Regions, Countries, or Segments in Natural Disaster Detection IoT System
The Flood Detection application segment, within the Natural Disaster Detection IoT System market, is poised to exhibit significant dominance across leading regions and countries. This leadership is underpinned by a confluence of factors, including geographical vulnerability, escalating climate change impacts, and robust governmental initiatives. North America and Asia Pacific are emerging as frontrunners, driven by substantial investments and increasing awareness.
Key Drivers of Dominance in Flood Detection:
- Geographical Vulnerability: Extensive coastlines, major river systems, and regions prone to extreme rainfall events in countries like the United States, China, India, and Bangladesh make flood detection a paramount concern.
- Escalating Climate Change Impacts: The heightened frequency and intensity of extreme weather events, directly linked to climate change, have amplified the risk of widespread flooding, necessitating advanced detection and early warning capabilities.
- Governmental and Regulatory Support: Many governments are prioritizing investments in disaster management infrastructure, including advanced flood monitoring systems. Regulatory mandates for critical infrastructure protection and urban planning often include requirements for robust flood detection solutions. For instance, US$ XXX million has been allocated by various national agencies in North America towards upgrading flood warning systems.
- Technological Advancement & Adoption: The availability of sophisticated IoT sensors, AI-powered hydrological modeling, and real-time data analytics platforms are making flood detection more accurate and actionable. Companies like Sony are contributing advanced sensor technologies, while SAP is providing analytical platforms.
- Economic Impact Mitigation: Floods cause immense economic damage, affecting agriculture, infrastructure, and businesses. Proactive detection and warning systems are crucial for mitigating these financial losses, leading to increased adoption by businesses and insurance providers.
In-depth analysis of dominance factors reveals that countries with significant populations residing in flood-prone areas and robust economic capacities are leading the charge. In North America, the United States, with its extensive coastlines and major river basins, has seen substantial investment in smart flood monitoring networks, projected to reach XXX million by 2028. The adoption of IoT solutions for flood detection in the US is estimated to be XX% higher than the global average. Similarly, in the Asia Pacific region, countries like China and India are rapidly deploying advanced flood detection systems due to their high vulnerability to monsoon-induced floods and rapid urbanization in low-lying areas. China alone has invested US$ XXX million in its national flood forecasting and warning system.
The Solution type within the Natural Disaster Detection IoT System market is also a key indicator of market leadership, as integrated solutions offer end-to-end capabilities from sensor deployment to data analysis and alert generation. This comprehensive approach is favored by municipalities and large-scale disaster management agencies seeking turnkey solutions. The market for integrated flood detection solutions is projected to grow at a CAGR of XX% during the forecast period. The combined investment in flood detection solutions by governments and private enterprises is expected to exceed XXX million by 2030.
Natural Disaster Detection IoT System Product Innovations
Product innovations in the Natural Disaster Detection IoT System market are continuously enhancing detection accuracy and response times. Companies are developing advanced IoT sensors with increased sensitivity and reliability, capable of operating in harsh environmental conditions. These include multi-parameter environmental sensors for detecting subtle changes in soil moisture, water levels, and air quality, crucial for early landslide, flood, and wildfire detection. AI-powered analytics are being integrated directly into edge devices, enabling faster on-site data processing and reducing latency. For instance, predictive analytics algorithms are now achieving XX% accuracy in forecasting wildfire ignition points based on real-time weather data and vegetation dryness indices. Furthermore, advancements in low-power communication modules, exemplified by offerings from Semtech, are extending sensor network lifespans and reducing maintenance costs, making comprehensive disaster monitoring more economically viable.
Propelling Factors for Natural Disaster Detection IoT System Growth
The growth of the Natural Disaster Detection IoT System market is propelled by several key factors. Firstly, the escalating frequency and intensity of natural disasters globally, attributed to climate change, is a primary driver, creating an urgent need for effective early warning systems. Secondly, increasing government investments in disaster preparedness and resilient infrastructure, coupled with supportive regulatory frameworks, are significantly boosting adoption. For example, numerous countries have launched national IoT strategies that prioritize public safety and disaster management. Thirdly, rapid technological advancements in IoT sensors, AI, and data analytics are enhancing the capabilities and affordability of these systems, making them more accessible to a wider range of users. The development of specialized applications for Flood Detection, Wildfire Detection, and Landslide Detection further caters to specific risk mitigation needs.
Obstacles in the Natural Disaster Detection IoT System Market
Despite robust growth, the Natural Disaster Detection IoT System market faces several obstacles. High initial investment costs for deploying extensive sensor networks and sophisticated analytical platforms remain a significant barrier for smaller organizations and developing regions. Interoperability challenges between different IoT devices and platforms from various vendors can hinder seamless integration and data sharing. Data security and privacy concerns are paramount, as sensitive environmental and location data is collected, requiring robust cybersecurity measures. Furthermore, regulatory complexities and standardization gaps across different regions can create hurdles for widespread adoption and scalability. Supply chain disruptions, as witnessed in recent global events, can also impact the availability and cost of critical IoT components, potentially delaying project implementations by XX%.
Future Opportunities in Natural Disaster Detection IoT System
The future of the Natural Disaster Detection IoT System market is brimming with opportunities. The expansion of smart cities and resilient infrastructure projects presents a significant avenue for deploying integrated disaster management solutions. The growing adoption of AI and machine learning will lead to more predictive and proactive detection capabilities, moving beyond simple alerts to actionable insights. Emerging markets in regions with high disaster risk and increasing technological adoption offer substantial growth potential. Furthermore, the development of specialized IoT solutions for Drought Detection and Landslide Detection, alongside existing applications, will broaden the market's scope. The increasing integration of blockchain technology for secure and transparent data management in disaster response also represents a promising innovation. The market is expected to see a XX% increase in the adoption of predictive maintenance for critical infrastructure through these systems.
Major Players in the Natural Disaster Detection IoT System Ecosystem
- Nec Corporation
- Blackberry
- Semtech
- Sony
- Nokia
- SAP
- Intel
- Green Stream Technologies
- Earth Networks
- Responscity Systems
Key Developments in Natural Disaster Detection IoT System Industry
- 2023: Launch of advanced AI-powered wildfire detection algorithms by Earth Networks, improving early warning accuracy by XX%.
- 2023: Semtech announces the availability of new LoRaWAN-based sensors optimized for harsh environmental monitoring, extending battery life by XX%.
- 2022: Nec Corporation partners with governmental agencies to deploy city-wide flood monitoring systems, covering over XXX square kilometers.
- 2022: SAP integrates real-time weather data with its disaster management platform, enhancing predictive capabilities for extreme weather events.
- 2021: Blackberry enhances its IoT security suite to protect natural disaster detection networks from cyber threats.
- 2020: Sony introduces high-resolution image sensors for satellite imagery analysis, improving the detection of subtle environmental changes indicative of disasters.
Strategic Natural Disaster Detection IoT System Market Forecast
The strategic outlook for the Natural Disaster Detection IoT System market is exceptionally positive, driven by an expanding global recognition of climate change impacts and the critical need for enhanced disaster resilience. The forecast period is characterized by sustained growth, fueled by continuous technological innovation in AI, IoT, and sensor technology, enabling more precise and timely detection of various natural hazards, including Flood Detection and Wildfire Detection. Increased government spending on smart infrastructure and disaster management initiatives, coupled with supportive regulatory landscapes, will continue to be significant growth catalysts. Emerging market penetration and the development of integrated, end-to-end solutions are expected to further propel market expansion. The projected market size is estimated to reach XXX million by 2033, with a robust CAGR of XX%.
Natural Disaster Detection IoT System Segmentation
-
1. Application
- 1.1. Flood Detection
- 1.2. Drought Detection
- 1.3. Wildfire Detection
- 1.4. Landslide Detection
- 1.5. Others
-
2. Types
- 2.1. Solution
- 2.2. Software
- 2.3. Others
Natural Disaster Detection IoT System Segmentation By Geography
-
1. North America
- 1.1. United States
- 1.2. Canada
- 1.3. Mexico
-
2. South America
- 2.1. Brazil
- 2.2. Argentina
- 2.3. Rest of South America
-
3. Europe
- 3.1. United Kingdom
- 3.2. Germany
- 3.3. France
- 3.4. Italy
- 3.5. Spain
- 3.6. Russia
- 3.7. Benelux
- 3.8. Nordics
- 3.9. Rest of Europe
-
4. Middle East & Africa
- 4.1. Turkey
- 4.2. Israel
- 4.3. GCC
- 4.4. North Africa
- 4.5. South Africa
- 4.6. Rest of Middle East & Africa
-
5. Asia Pacific
- 5.1. China
- 5.2. India
- 5.3. Japan
- 5.4. South Korea
- 5.5. ASEAN
- 5.6. Oceania
- 5.7. Rest of Asia Pacific
Natural Disaster Detection IoT System Regional Market Share
Geographic Coverage of Natural Disaster Detection IoT System
Natural Disaster Detection IoT System REPORT HIGHLIGHTS
| Aspects | Details |
|---|---|
| Study Period | 2020-2034 |
| Base Year | 2025 |
| Estimated Year | 2026 |
| Forecast Period | 2026-2034 |
| Historical Period | 2020-2025 |
| Growth Rate | CAGR of 36% from 2020-2034 |
| Segmentation |
|
Table of Contents
- 1. Introduction
- 1.1. Research Scope
- 1.2. Market Segmentation
- 1.3. Research Methodology
- 1.4. Definitions and Assumptions
- 2. Executive Summary
- 2.1. Introduction
- 3. Market Dynamics
- 3.1. Introduction
- 3.2. Market Drivers
- 3.3. Market Restrains
- 3.4. Market Trends
- 4. Market Factor Analysis
- 4.1. Porters Five Forces
- 4.2. Supply/Value Chain
- 4.3. PESTEL analysis
- 4.4. Market Entropy
- 4.5. Patent/Trademark Analysis
- 5. Global Natural Disaster Detection IoT System Analysis, Insights and Forecast, 2020-2032
- 5.1. Market Analysis, Insights and Forecast - by Application
- 5.1.1. Flood Detection
- 5.1.2. Drought Detection
- 5.1.3. Wildfire Detection
- 5.1.4. Landslide Detection
- 5.1.5. Others
- 5.2. Market Analysis, Insights and Forecast - by Types
- 5.2.1. Solution
- 5.2.2. Software
- 5.2.3. Others
- 5.3. Market Analysis, Insights and Forecast - by Region
- 5.3.1. North America
- 5.3.2. South America
- 5.3.3. Europe
- 5.3.4. Middle East & Africa
- 5.3.5. Asia Pacific
- 5.1. Market Analysis, Insights and Forecast - by Application
- 6. North America Natural Disaster Detection IoT System Analysis, Insights and Forecast, 2020-2032
- 6.1. Market Analysis, Insights and Forecast - by Application
- 6.1.1. Flood Detection
- 6.1.2. Drought Detection
- 6.1.3. Wildfire Detection
- 6.1.4. Landslide Detection
- 6.1.5. Others
- 6.2. Market Analysis, Insights and Forecast - by Types
- 6.2.1. Solution
- 6.2.2. Software
- 6.2.3. Others
- 6.1. Market Analysis, Insights and Forecast - by Application
- 7. South America Natural Disaster Detection IoT System Analysis, Insights and Forecast, 2020-2032
- 7.1. Market Analysis, Insights and Forecast - by Application
- 7.1.1. Flood Detection
- 7.1.2. Drought Detection
- 7.1.3. Wildfire Detection
- 7.1.4. Landslide Detection
- 7.1.5. Others
- 7.2. Market Analysis, Insights and Forecast - by Types
- 7.2.1. Solution
- 7.2.2. Software
- 7.2.3. Others
- 7.1. Market Analysis, Insights and Forecast - by Application
- 8. Europe Natural Disaster Detection IoT System Analysis, Insights and Forecast, 2020-2032
- 8.1. Market Analysis, Insights and Forecast - by Application
- 8.1.1. Flood Detection
- 8.1.2. Drought Detection
- 8.1.3. Wildfire Detection
- 8.1.4. Landslide Detection
- 8.1.5. Others
- 8.2. Market Analysis, Insights and Forecast - by Types
- 8.2.1. Solution
- 8.2.2. Software
- 8.2.3. Others
- 8.1. Market Analysis, Insights and Forecast - by Application
- 9. Middle East & Africa Natural Disaster Detection IoT System Analysis, Insights and Forecast, 2020-2032
- 9.1. Market Analysis, Insights and Forecast - by Application
- 9.1.1. Flood Detection
- 9.1.2. Drought Detection
- 9.1.3. Wildfire Detection
- 9.1.4. Landslide Detection
- 9.1.5. Others
- 9.2. Market Analysis, Insights and Forecast - by Types
- 9.2.1. Solution
- 9.2.2. Software
- 9.2.3. Others
- 9.1. Market Analysis, Insights and Forecast - by Application
- 10. Asia Pacific Natural Disaster Detection IoT System Analysis, Insights and Forecast, 2020-2032
- 10.1. Market Analysis, Insights and Forecast - by Application
- 10.1.1. Flood Detection
- 10.1.2. Drought Detection
- 10.1.3. Wildfire Detection
- 10.1.4. Landslide Detection
- 10.1.5. Others
- 10.2. Market Analysis, Insights and Forecast - by Types
- 10.2.1. Solution
- 10.2.2. Software
- 10.2.3. Others
- 10.1. Market Analysis, Insights and Forecast - by Application
- 11. Competitive Analysis
- 11.1. Global Market Share Analysis 2025
- 11.2. Company Profiles
- 11.2.1 Nec Corporation
- 11.2.1.1. Overview
- 11.2.1.2. Products
- 11.2.1.3. SWOT Analysis
- 11.2.1.4. Recent Developments
- 11.2.1.5. Financials (Based on Availability)
- 11.2.2 Blackberry
- 11.2.2.1. Overview
- 11.2.2.2. Products
- 11.2.2.3. SWOT Analysis
- 11.2.2.4. Recent Developments
- 11.2.2.5. Financials (Based on Availability)
- 11.2.3 Semtech
- 11.2.3.1. Overview
- 11.2.3.2. Products
- 11.2.3.3. SWOT Analysis
- 11.2.3.4. Recent Developments
- 11.2.3.5. Financials (Based on Availability)
- 11.2.4 Sony
- 11.2.4.1. Overview
- 11.2.4.2. Products
- 11.2.4.3. SWOT Analysis
- 11.2.4.4. Recent Developments
- 11.2.4.5. Financials (Based on Availability)
- 11.2.5 Nokia
- 11.2.5.1. Overview
- 11.2.5.2. Products
- 11.2.5.3. SWOT Analysis
- 11.2.5.4. Recent Developments
- 11.2.5.5. Financials (Based on Availability)
- 11.2.6 SAP
- 11.2.6.1. Overview
- 11.2.6.2. Products
- 11.2.6.3. SWOT Analysis
- 11.2.6.4. Recent Developments
- 11.2.6.5. Financials (Based on Availability)
- 11.2.7 Intel
- 11.2.7.1. Overview
- 11.2.7.2. Products
- 11.2.7.3. SWOT Analysis
- 11.2.7.4. Recent Developments
- 11.2.7.5. Financials (Based on Availability)
- 11.2.8 Green Stream Technologies
- 11.2.8.1. Overview
- 11.2.8.2. Products
- 11.2.8.3. SWOT Analysis
- 11.2.8.4. Recent Developments
- 11.2.8.5. Financials (Based on Availability)
- 11.2.9 Earth Networks
- 11.2.9.1. Overview
- 11.2.9.2. Products
- 11.2.9.3. SWOT Analysis
- 11.2.9.4. Recent Developments
- 11.2.9.5. Financials (Based on Availability)
- 11.2.10 Responscity Systems
- 11.2.10.1. Overview
- 11.2.10.2. Products
- 11.2.10.3. SWOT Analysis
- 11.2.10.4. Recent Developments
- 11.2.10.5. Financials (Based on Availability)
- 11.2.1 Nec Corporation
List of Figures
- Figure 1: Global Natural Disaster Detection IoT System Revenue Breakdown (million, %) by Region 2025 & 2033
- Figure 2: North America Natural Disaster Detection IoT System Revenue (million), by Application 2025 & 2033
- Figure 3: North America Natural Disaster Detection IoT System Revenue Share (%), by Application 2025 & 2033
- Figure 4: North America Natural Disaster Detection IoT System Revenue (million), by Types 2025 & 2033
- Figure 5: North America Natural Disaster Detection IoT System Revenue Share (%), by Types 2025 & 2033
- Figure 6: North America Natural Disaster Detection IoT System Revenue (million), by Country 2025 & 2033
- Figure 7: North America Natural Disaster Detection IoT System Revenue Share (%), by Country 2025 & 2033
- Figure 8: South America Natural Disaster Detection IoT System Revenue (million), by Application 2025 & 2033
- Figure 9: South America Natural Disaster Detection IoT System Revenue Share (%), by Application 2025 & 2033
- Figure 10: South America Natural Disaster Detection IoT System Revenue (million), by Types 2025 & 2033
- Figure 11: South America Natural Disaster Detection IoT System Revenue Share (%), by Types 2025 & 2033
- Figure 12: South America Natural Disaster Detection IoT System Revenue (million), by Country 2025 & 2033
- Figure 13: South America Natural Disaster Detection IoT System Revenue Share (%), by Country 2025 & 2033
- Figure 14: Europe Natural Disaster Detection IoT System Revenue (million), by Application 2025 & 2033
- Figure 15: Europe Natural Disaster Detection IoT System Revenue Share (%), by Application 2025 & 2033
- Figure 16: Europe Natural Disaster Detection IoT System Revenue (million), by Types 2025 & 2033
- Figure 17: Europe Natural Disaster Detection IoT System Revenue Share (%), by Types 2025 & 2033
- Figure 18: Europe Natural Disaster Detection IoT System Revenue (million), by Country 2025 & 2033
- Figure 19: Europe Natural Disaster Detection IoT System Revenue Share (%), by Country 2025 & 2033
- Figure 20: Middle East & Africa Natural Disaster Detection IoT System Revenue (million), by Application 2025 & 2033
- Figure 21: Middle East & Africa Natural Disaster Detection IoT System Revenue Share (%), by Application 2025 & 2033
- Figure 22: Middle East & Africa Natural Disaster Detection IoT System Revenue (million), by Types 2025 & 2033
- Figure 23: Middle East & Africa Natural Disaster Detection IoT System Revenue Share (%), by Types 2025 & 2033
- Figure 24: Middle East & Africa Natural Disaster Detection IoT System Revenue (million), by Country 2025 & 2033
- Figure 25: Middle East & Africa Natural Disaster Detection IoT System Revenue Share (%), by Country 2025 & 2033
- Figure 26: Asia Pacific Natural Disaster Detection IoT System Revenue (million), by Application 2025 & 2033
- Figure 27: Asia Pacific Natural Disaster Detection IoT System Revenue Share (%), by Application 2025 & 2033
- Figure 28: Asia Pacific Natural Disaster Detection IoT System Revenue (million), by Types 2025 & 2033
- Figure 29: Asia Pacific Natural Disaster Detection IoT System Revenue Share (%), by Types 2025 & 2033
- Figure 30: Asia Pacific Natural Disaster Detection IoT System Revenue (million), by Country 2025 & 2033
- Figure 31: Asia Pacific Natural Disaster Detection IoT System Revenue Share (%), by Country 2025 & 2033
List of Tables
- Table 1: Global Natural Disaster Detection IoT System Revenue million Forecast, by Application 2020 & 2033
- Table 2: Global Natural Disaster Detection IoT System Revenue million Forecast, by Types 2020 & 2033
- Table 3: Global Natural Disaster Detection IoT System Revenue million Forecast, by Region 2020 & 2033
- Table 4: Global Natural Disaster Detection IoT System Revenue million Forecast, by Application 2020 & 2033
- Table 5: Global Natural Disaster Detection IoT System Revenue million Forecast, by Types 2020 & 2033
- Table 6: Global Natural Disaster Detection IoT System Revenue million Forecast, by Country 2020 & 2033
- Table 7: United States Natural Disaster Detection IoT System Revenue (million) Forecast, by Application 2020 & 2033
- Table 8: Canada Natural Disaster Detection IoT System Revenue (million) Forecast, by Application 2020 & 2033
- Table 9: Mexico Natural Disaster Detection IoT System Revenue (million) Forecast, by Application 2020 & 2033
- Table 10: Global Natural Disaster Detection IoT System Revenue million Forecast, by Application 2020 & 2033
- Table 11: Global Natural Disaster Detection IoT System Revenue million Forecast, by Types 2020 & 2033
- Table 12: Global Natural Disaster Detection IoT System Revenue million Forecast, by Country 2020 & 2033
- Table 13: Brazil Natural Disaster Detection IoT System Revenue (million) Forecast, by Application 2020 & 2033
- Table 14: Argentina Natural Disaster Detection IoT System Revenue (million) Forecast, by Application 2020 & 2033
- Table 15: Rest of South America Natural Disaster Detection IoT System Revenue (million) Forecast, by Application 2020 & 2033
- Table 16: Global Natural Disaster Detection IoT System Revenue million Forecast, by Application 2020 & 2033
- Table 17: Global Natural Disaster Detection IoT System Revenue million Forecast, by Types 2020 & 2033
- Table 18: Global Natural Disaster Detection IoT System Revenue million Forecast, by Country 2020 & 2033
- Table 19: United Kingdom Natural Disaster Detection IoT System Revenue (million) Forecast, by Application 2020 & 2033
- Table 20: Germany Natural Disaster Detection IoT System Revenue (million) Forecast, by Application 2020 & 2033
- Table 21: France Natural Disaster Detection IoT System Revenue (million) Forecast, by Application 2020 & 2033
- Table 22: Italy Natural Disaster Detection IoT System Revenue (million) Forecast, by Application 2020 & 2033
- Table 23: Spain Natural Disaster Detection IoT System Revenue (million) Forecast, by Application 2020 & 2033
- Table 24: Russia Natural Disaster Detection IoT System Revenue (million) Forecast, by Application 2020 & 2033
- Table 25: Benelux Natural Disaster Detection IoT System Revenue (million) Forecast, by Application 2020 & 2033
- Table 26: Nordics Natural Disaster Detection IoT System Revenue (million) Forecast, by Application 2020 & 2033
- Table 27: Rest of Europe Natural Disaster Detection IoT System Revenue (million) Forecast, by Application 2020 & 2033
- Table 28: Global Natural Disaster Detection IoT System Revenue million Forecast, by Application 2020 & 2033
- Table 29: Global Natural Disaster Detection IoT System Revenue million Forecast, by Types 2020 & 2033
- Table 30: Global Natural Disaster Detection IoT System Revenue million Forecast, by Country 2020 & 2033
- Table 31: Turkey Natural Disaster Detection IoT System Revenue (million) Forecast, by Application 2020 & 2033
- Table 32: Israel Natural Disaster Detection IoT System Revenue (million) Forecast, by Application 2020 & 2033
- Table 33: GCC Natural Disaster Detection IoT System Revenue (million) Forecast, by Application 2020 & 2033
- Table 34: North Africa Natural Disaster Detection IoT System Revenue (million) Forecast, by Application 2020 & 2033
- Table 35: South Africa Natural Disaster Detection IoT System Revenue (million) Forecast, by Application 2020 & 2033
- Table 36: Rest of Middle East & Africa Natural Disaster Detection IoT System Revenue (million) Forecast, by Application 2020 & 2033
- Table 37: Global Natural Disaster Detection IoT System Revenue million Forecast, by Application 2020 & 2033
- Table 38: Global Natural Disaster Detection IoT System Revenue million Forecast, by Types 2020 & 2033
- Table 39: Global Natural Disaster Detection IoT System Revenue million Forecast, by Country 2020 & 2033
- Table 40: China Natural Disaster Detection IoT System Revenue (million) Forecast, by Application 2020 & 2033
- Table 41: India Natural Disaster Detection IoT System Revenue (million) Forecast, by Application 2020 & 2033
- Table 42: Japan Natural Disaster Detection IoT System Revenue (million) Forecast, by Application 2020 & 2033
- Table 43: South Korea Natural Disaster Detection IoT System Revenue (million) Forecast, by Application 2020 & 2033
- Table 44: ASEAN Natural Disaster Detection IoT System Revenue (million) Forecast, by Application 2020 & 2033
- Table 45: Oceania Natural Disaster Detection IoT System Revenue (million) Forecast, by Application 2020 & 2033
- Table 46: Rest of Asia Pacific Natural Disaster Detection IoT System Revenue (million) Forecast, by Application 2020 & 2033
Frequently Asked Questions
1. What is the projected Compound Annual Growth Rate (CAGR) of the Natural Disaster Detection IoT System?
The projected CAGR is approximately 36%.
2. Which companies are prominent players in the Natural Disaster Detection IoT System?
Key companies in the market include Nec Corporation, Blackberry, Semtech, Sony, Nokia, SAP, Intel, Green Stream Technologies, Earth Networks, Responscity Systems.
3. What are the main segments of the Natural Disaster Detection IoT System?
The market segments include Application, Types.
4. Can you provide details about the market size?
The market size is estimated to be USD 408 million as of 2022.
5. What are some drivers contributing to market growth?
N/A
6. What are the notable trends driving market growth?
N/A
7. Are there any restraints impacting market growth?
N/A
8. Can you provide examples of recent developments in the market?
N/A
9. What pricing options are available for accessing the report?
Pricing options include single-user, multi-user, and enterprise licenses priced at USD 4900.00, USD 7350.00, and USD 9800.00 respectively.
10. Is the market size provided in terms of value or volume?
The market size is provided in terms of value, measured in million.
11. Are there any specific market keywords associated with the report?
Yes, the market keyword associated with the report is "Natural Disaster Detection IoT System," which aids in identifying and referencing the specific market segment covered.
12. How do I determine which pricing option suits my needs best?
The pricing options vary based on user requirements and access needs. Individual users may opt for single-user licenses, while businesses requiring broader access may choose multi-user or enterprise licenses for cost-effective access to the report.
13. Are there any additional resources or data provided in the Natural Disaster Detection IoT System report?
While the report offers comprehensive insights, it's advisable to review the specific contents or supplementary materials provided to ascertain if additional resources or data are available.
14. How can I stay updated on further developments or reports in the Natural Disaster Detection IoT System?
To stay informed about further developments, trends, and reports in the Natural Disaster Detection IoT System, consider subscribing to industry newsletters, following relevant companies and organizations, or regularly checking reputable industry news sources and publications.
Methodology
Step 1 - Identification of Relevant Samples Size from Population Database


Step 2 - Approaches for Defining Global Market Size (Value, Volume* & Price*)

Note*: In applicable scenarios
Step 3 - Data Sources
Primary Research
- Web Analytics
- Survey Reports
- Research Institute
- Latest Research Reports
- Opinion Leaders
Secondary Research
- Annual Reports
- White Paper
- Latest Press Release
- Industry Association
- Paid Database
- Investor Presentations

Step 4 - Data Triangulation
Involves using different sources of information in order to increase the validity of a study
These sources are likely to be stakeholders in a program - participants, other researchers, program staff, other community members, and so on.
Then we put all data in single framework & apply various statistical tools to find out the dynamic on the market.
During the analysis stage, feedback from the stakeholder groups would be compared to determine areas of agreement as well as areas of divergence