

Key Insights
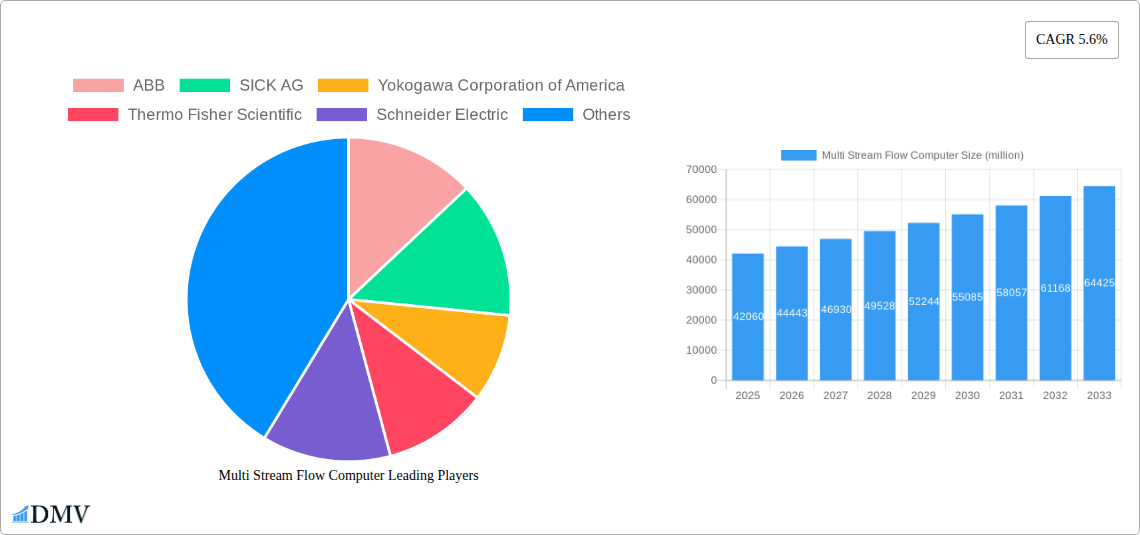
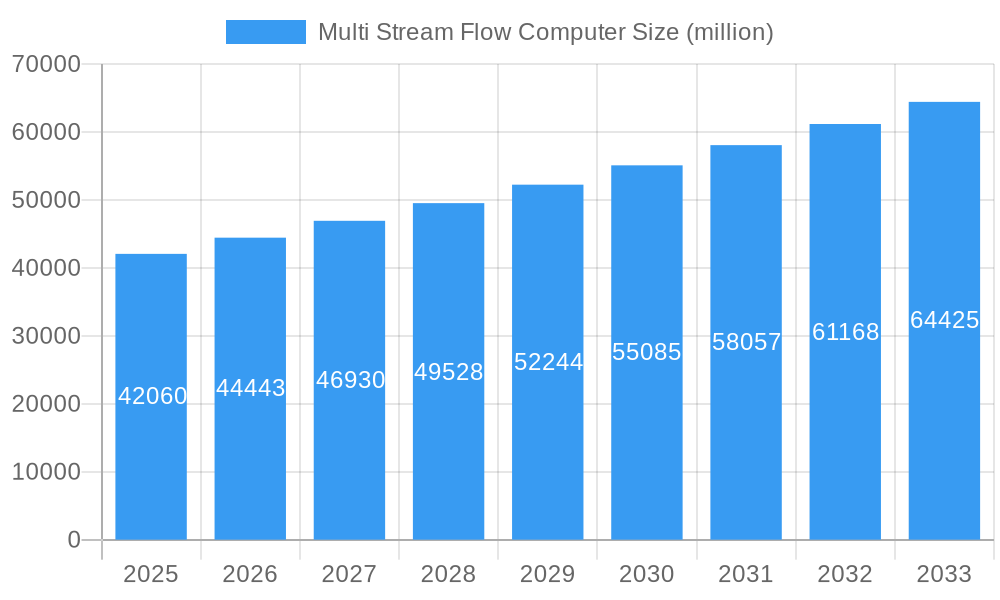
The global Multi-Stream Flow Computer market is poised for significant expansion, projected to reach an estimated $42,060 million by 2025, with a robust Compound Annual Growth Rate (CAGR) of 5.6%. This impressive growth trajectory is underpinned by a confluence of critical drivers, primarily the increasing demand for precise and automated fuel monitoring across various industries, including oil and gas, power generation, and transportation. The need for enhanced efficiency and regulatory compliance in liquid and gas measurement also fuels market expansion. Furthermore, the imperative to optimize wellhead operations for improved hydrocarbon recovery and the growing investments in pipeline transmission and distribution infrastructure are key contributors to this upward trend. As industries increasingly rely on accurate real-time data for operational intelligence and cost reduction, the sophisticated capabilities offered by multi-stream flow computers in handling complex flow conditions and multiple streams simultaneously become indispensable.
Multi Stream Flow Computer Market Size (In Billion)
The market's dynamism is further shaped by emerging trends such as the integration of advanced sensor technologies, including IoT-enabled devices, to provide comprehensive data analytics and remote monitoring capabilities. The development of more compact, rugged, and intelligent flow computer solutions tailored for diverse environmental conditions and specialized applications is also a notable trend. However, the market faces certain restraints, including the high initial investment cost associated with advanced multi-stream flow computer systems and the potential challenges in integrating these systems with legacy infrastructure. Stringent regulatory landscapes across different regions can also present hurdles. Despite these challenges, the continuous innovation in sensor technology, coupled with the growing emphasis on data-driven decision-making and operational safety, is expected to propel the multi-stream flow computer market to new heights. Key market segments include applications like Fuel Monitoring and Liquid and Gas Measurement, with Pressure Gauges and Temperature Probes being prominent sensor types.
Multi Stream Flow Computer Company Market Share
Multi Stream Flow Computer Market Composition & Trends
The global Multi Stream Flow Computer market is characterized by a moderate level of concentration, with a few key players holding significant market share. Innovation remains a critical catalyst, driven by the constant need for enhanced accuracy, efficiency, and data management in fluid flow applications. Regulatory landscapes, particularly concerning safety and environmental compliance in sectors like pipeline transmission and distribution, are increasingly shaping product development and market entry strategies. Substitute products, while present in some niche applications, are generally outpaced by the integrated capabilities of advanced multi-stream flow computers. End-user profiles span across diverse industries, including oil and gas, chemical processing, water management, and power generation. Merger and acquisition (M&A) activities, estimated at a cumulative value of over 1,500 million, have played a vital role in market consolidation, allowing larger entities to expand their product portfolios and geographical reach. These strategic moves are geared towards capturing a larger share of the liquid and gas measurement and fuel monitoring segments.
- Market Share Distribution: Leading companies like Emerson Electric Co, Yokogawa Corporation of America, and Endress + Hauser collectively hold approximately 45% of the market share.
- M&A Deal Values: Key acquisitions over the historical period (2019-2024) have seen deals ranging from 50 million to over 500 million.
- Innovation Drivers: Increased demand for real-time data analytics, integration with IoT platforms, and compliance with stringent industry standards.
- Regulatory Impact: Evolving standards for custody transfer and emissions monitoring are pushing for higher precision and traceability.
- End-User Segmentation: The oil and gas sector, particularly upstream and midstream operations, represents the largest consumer base for multi-stream flow computers.
Multi Stream Flow Computer Industry Evolution
The Multi Stream Flow Computer industry has witnessed remarkable growth and evolution over the study period (2019–2033), with the base year (2025) serving as a crucial benchmark for ongoing development. From 2019 to 2024, the market experienced a steady upward trajectory, driven by increasing global energy demands and the imperative for precise liquid and gas measurement across various industrial processes. The forecast period (2025–2033) is projected to see an accelerated growth rate, with an estimated Compound Annual Growth Rate (CAGR) of over 6.5%. This sustained expansion is fueled by a confluence of technological advancements, shifting consumer demands, and supportive industry developments.
Technological advancements have been central to this evolution. Early multi-stream flow computers primarily focused on basic flow rate calculations. However, the market has since transitioned towards sophisticated solutions offering integrated functionalities such as multi-phase flow measurement, advanced diagnostic capabilities, remote monitoring, and seamless integration with SCADA and DCS systems. The proliferation of smart sensors, including pressure gauges, temperature probes, and gas composition sensors, has significantly enhanced the accuracy and reliability of data captured by these devices. Furthermore, the development of advanced algorithms and computational power has enabled real-time compensation for varying fluid properties and environmental conditions, thereby improving the precision of wellhead measurement and optimization.
Shifting consumer demands have also played a pivotal role. Industries are increasingly prioritizing operational efficiency, cost reduction, and environmental sustainability. Multi-stream flow computers contribute to these goals by enabling better inventory management, optimizing resource allocation, minimizing product loss, and ensuring compliance with environmental regulations. The growing adoption of the Industrial Internet of Things (IIoT) has further propelled the demand for connected flow computers that can transmit data wirelessly and integrate into broader digital ecosystems. This has led to a surge in demand for solutions supporting fuel monitoring and pipeline transmission and distribution with enhanced cybersecurity features.
The evolution also reflects a greater emphasis on user-friendliness and reduced total cost of ownership. Manufacturers are investing in developing intuitive interfaces, modular designs for easier maintenance, and robust hardware capable of withstanding harsh industrial environments. The development of specialized meter provers and sampling systems designed to work seamlessly with multi-stream flow computers has also enhanced their applicability and accuracy. As the market matures, there is a discernible trend towards higher-value solutions that offer comprehensive data analysis and predictive maintenance capabilities, moving beyond mere measurement to provide actionable insights for process optimization.
Leading Regions, Countries, or Segments in Multi Stream Flow Computer
The Multi Stream Flow Computer market’s dominance is significantly influenced by regional investments, regulatory frameworks, and the specific demands of key industrial applications. North America, particularly the United States and Canada, stands out as a leading region due to its extensive oil and gas infrastructure, encompassing upstream exploration, midstream transportation (pipeline transmission and distribution), and downstream refining operations. The region's mature market, coupled with substantial investments in technological upgrades and the adoption of advanced liquid and gas measurement solutions, positions it at the forefront of market growth. Favorable regulatory environments encouraging precision and safety in fluid handling further bolster this leadership.
Dominant Application Segment: Pipeline Transmission and Distribution
- Drivers: Extensive network of oil and gas pipelines, stringent safety regulations, and the need for accurate custody transfer for revenue assurance.
- Analysis: North America’s vast pipeline network requires continuous and precise monitoring of flow rates, pressures, and temperatures to ensure operational integrity and prevent losses. Government initiatives aimed at modernizing aging infrastructure and enhancing pipeline security further drive the demand for advanced multi-stream flow computers equipped with sophisticated diagnostic and alarming capabilities. The segment benefits from the need to track product movements across long distances, involving various fluid compositions and environmental conditions.
Dominant Type Segment: Pressure Gauges and Temperature Probes
- Drivers: Fundamental requirement for accurate flow calculation, regulatory compliance for safety, and integration with other measurement devices.
- Analysis: While other sensor types like gas composition sensors and density measurement equipment are crucial for specific applications, pressure gauges and temperature probes remain foundational to almost all multi-stream flow computer operations. Their ubiquity across the liquid and gas measurement and fuel monitoring segments ensures consistent demand. The continuous need for precise real-time data on these parameters is non-negotiable for accurate flow computation, especially in dynamic environments encountered in wellhead measurement and optimization.
Key Country: United States
- Drivers: Significant presence of major oil and gas companies, advanced technological adoption, and proactive regulatory support for industrial automation.
- Analysis: The US market benefits from a highly competitive landscape that drives innovation and adoption of cutting-edge technologies. Companies are actively investing in digital transformation, integrating multi-stream flow computers with IoT platforms for enhanced data analytics and remote management. The shale gas revolution has also spurred significant demand for advanced measurement solutions in upstream operations. The presence of leading manufacturers and technology providers in the country further solidifies its position.
Other significant regions include the Middle East, driven by its vast hydrocarbon reserves and ongoing investments in infrastructure, and Europe, with its stringent environmental regulations and focus on energy efficiency. Asia-Pacific is emerging as a rapidly growing market due to expanding industrial sectors and increasing investments in energy infrastructure.
Multi Stream Flow Computer Product Innovations
Product innovations in the Multi Stream Flow Computer market are increasingly focused on enhancing accuracy, robustness, and connectivity. Manufacturers are integrating advanced computational algorithms to handle complex multi-phase flow scenarios with unprecedented precision. Innovations include the development of more compact and ruggedized units capable of withstanding extreme temperatures and harsh industrial environments. Furthermore, the integration of sophisticated diagnostic tools and remote access capabilities via secure IoT platforms is becoming a standard feature, enabling predictive maintenance and reducing downtime. Enhanced cybersecurity protocols are also a key area of innovation, ensuring the integrity of sensitive flow data. The incorporation of AI-driven analytics for process optimization and anomaly detection represents the next frontier in product development.
Propelling Factors for Multi Stream Flow Computer Growth
The growth of the Multi Stream Flow Computer market is propelled by several key factors. Firstly, the increasing global demand for energy necessitates more efficient and accurate liquid and gas measurement, particularly in the pipeline transmission and distribution sector. Secondly, stringent regulatory requirements for safety, environmental compliance, and accurate fuel monitoring are driving the adoption of sophisticated flow computing solutions. Thirdly, technological advancements, including the integration of IoT and AI, are enhancing the capabilities of these devices, offering real-time data analytics, predictive maintenance, and remote monitoring. Fourthly, the drive for operational efficiency and cost reduction across industries, from oil and gas to chemical processing, compels companies to invest in advanced measurement and control technologies to minimize product loss and optimize resource utilization.
Obstacles in the Multi Stream Flow Computer Market
Despite robust growth, the Multi Stream Flow Computer market faces several obstacles. Regulatory challenges related to data security and international standards can create complexities for global manufacturers. Supply chain disruptions, as experienced in recent years, can impact the availability of critical components, leading to extended lead times and increased costs. High initial investment costs for advanced systems can be a barrier for smaller enterprises or those in developing economies. Furthermore, fierce competition among established players and emerging companies can lead to price pressures. The need for skilled personnel to install, operate, and maintain these sophisticated systems also presents a human capital challenge.
Future Opportunities in Multi Stream Flow Computer
Emerging opportunities for Multi Stream Flow Computers are abundant. The growing focus on renewable energy sources and the need for accurate measurement in hydrogen production and distribution present new market avenues. Advancements in gas composition sensors and multi-phase flow measurement will unlock opportunities in unconventional resource extraction. The increasing adoption of smart grids and the demand for precise energy accounting in utilities will further drive market expansion. Furthermore, the development of more affordable and scalable solutions for emerging markets and the integration of flow computers into broader digital twin technologies for industrial plants represent significant growth potentials.
Major Players in the Multi Stream Flow Computer Ecosystem
- ABB
- SICK AG
- Yokogawa Corporation of America
- Thermo Fisher Scientific
- Schneider Electric
- Schlumberger
- Flowmetrics
- ProSoft Technology
- KROHNE Messtechnik GmbH
- OMNI FLOW COMPUTERS
- Fluidwell BV
- Contrec
- Dynamic Flow Computers
- Kessler-Ellis Products
- Flow Systems, Inc.
- Hoffer Flow Controls Inc
- Endress + Hauser
- Emerson Electric Co
- Technical Devices Co
- Rockwell Automation
Key Developments in Multi Stream Flow Computer Industry
- 2023 Q3: Emerson Electric Co. launched a new generation of multi-phase flow meters with enhanced accuracy for challenging upstream applications.
- 2023 Q4: Yokogawa Corporation of America announced a strategic partnership to integrate its flow computers with advanced AI analytics platforms.
- 2024 Q1: Endress + Hauser introduced a new series of compact flow computers designed for hazardous environments, improving safety in pipeline transmission and distribution.
- 2024 Q2: ABB expanded its portfolio with the acquisition of a specialized provider of wellhead measurement and optimization solutions.
- 2024 Q3: Schlumberger unveiled a cloud-based platform for real-time monitoring and diagnostics of flow computers, enhancing remote management capabilities.
- 2024 Q4: Thermo Fisher Scientific launched a new range of gas composition sensors with improved response times for critical liquid and gas measurement.
Strategic Multi Stream Flow Computer Market Forecast
The strategic forecast for the Multi Stream Flow Computer market indicates sustained and robust growth, driven by an escalating global energy demand and the critical need for precise liquid and gas measurement. The increasing emphasis on operational efficiency and stringent regulatory compliance across various industries, especially in pipeline transmission and distribution and fuel monitoring, will continue to fuel adoption. Technological advancements, including the integration of IIoT, AI, and advanced sensor technologies like gas composition sensors and pressure gauges, will unlock new capabilities and market segments. Emerging opportunities in sectors like hydrogen energy and the growing industrial automation trend in developing regions further solidify the positive outlook, suggesting a market poised for significant expansion and innovation.
Multi Stream Flow Computer Segmentation
-
1. Application
- 1.1. Fuel Monitoring
- 1.2. Liquid and Gas Measurement
- 1.3. Wellhead Measurement and Optimization
- 1.4. Pipeline Transmission and Distribution
- 1.5. Others
-
2. Type
- 2.1. Pressure Gauges
- 2.2. Temperature Probes
- 2.3. Gas Composition Sensors
- 2.4. Meter Prover
- 2.5. Sampling System
- 2.6. Density Measurement Equipment
- 2.7. Others
Multi Stream Flow Computer Segmentation By Geography
-
1. North America
- 1.1. United States
- 1.2. Canada
- 1.3. Mexico
-
2. South America
- 2.1. Brazil
- 2.2. Argentina
- 2.3. Rest of South America
-
3. Europe
- 3.1. United Kingdom
- 3.2. Germany
- 3.3. France
- 3.4. Italy
- 3.5. Spain
- 3.6. Russia
- 3.7. Benelux
- 3.8. Nordics
- 3.9. Rest of Europe
-
4. Middle East & Africa
- 4.1. Turkey
- 4.2. Israel
- 4.3. GCC
- 4.4. North Africa
- 4.5. South Africa
- 4.6. Rest of Middle East & Africa
-
5. Asia Pacific
- 5.1. China
- 5.2. India
- 5.3. Japan
- 5.4. South Korea
- 5.5. ASEAN
- 5.6. Oceania
- 5.7. Rest of Asia Pacific
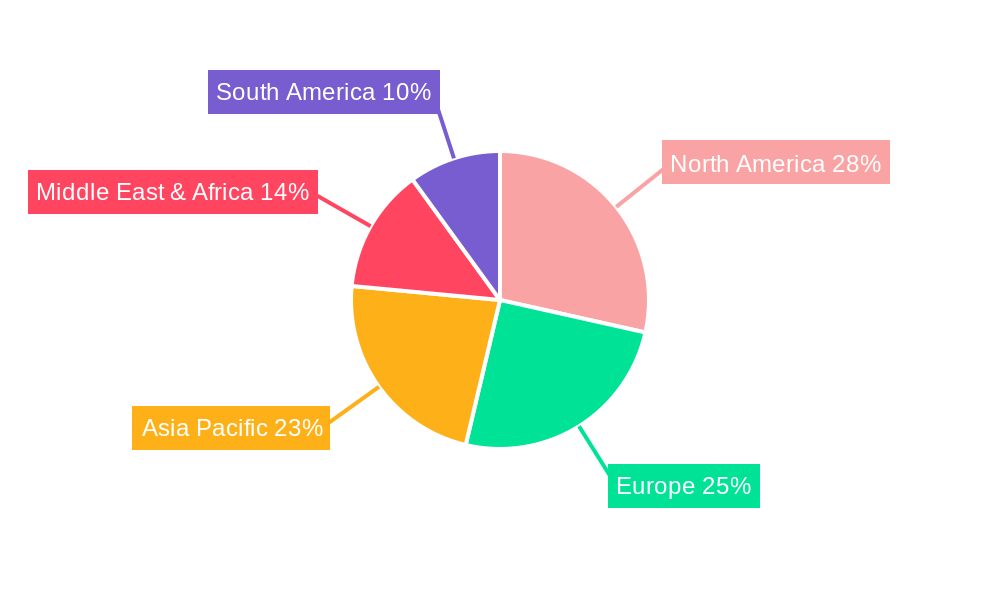
Multi Stream Flow Computer Regional Market Share
Geographic Coverage of Multi Stream Flow Computer
Multi Stream Flow Computer REPORT HIGHLIGHTS
| Aspects | Details |
|---|---|
| Study Period | 2020-2034 |
| Base Year | 2025 |
| Estimated Year | 2026 |
| Forecast Period | 2026-2034 |
| Historical Period | 2020-2025 |
| Growth Rate | CAGR of 5.6% from 2020-2034 |
| Segmentation |
|
Table of Contents
- 1. Introduction
- 1.1. Research Scope
- 1.2. Market Segmentation
- 1.3. Research Objective
- 1.4. Definitions and Assumptions
- 2. Executive Summary
- 2.1. Market Snapshot
- 3. Market Dynamics
- 3.1. Market Drivers
- 3.2. Market Restrains
- 3.3. Market Trends
- 3.4. Market Opportunities
- 4. Market Factor Analysis
- 4.1. Porters Five Forces
- 4.1.1. Bargaining Power of Suppliers
- 4.1.2. Bargaining Power of Buyers
- 4.1.3. Threat of New Entrants
- 4.1.4. Threat of Substitutes
- 4.1.5. Competitive Rivalry
- 4.2. PESTEL analysis
- 4.3. BCG Analysis
- 4.3.1. Stars (High Growth, High Market Share)
- 4.3.2. Cash Cows (Low Growth, High Market Share)
- 4.3.3. Question Mark (High Growth, Low Market Share)
- 4.3.4. Dogs (Low Growth, Low Market Share)
- 4.4. Ansoff Matrix Analysis
- 4.5. Supply Chain Analysis
- 4.6. Regulatory Landscape
- 4.7. Current Market Potential and Opportunity Assessment (TAM–SAM–SOM Framework)
- 4.8. DMV Analyst Note
- 4.1. Porters Five Forces
- 5. Market Analysis, Insights and Forecast 2021-2033
- 5.1. Market Analysis, Insights and Forecast - by Application
- 5.1.1. Fuel Monitoring
- 5.1.2. Liquid and Gas Measurement
- 5.1.3. Wellhead Measurement and Optimization
- 5.1.4. Pipeline Transmission and Distribution
- 5.1.5. Others
- 5.2. Market Analysis, Insights and Forecast - by Type
- 5.2.1. Pressure Gauges
- 5.2.2. Temperature Probes
- 5.2.3. Gas Composition Sensors
- 5.2.4. Meter Prover
- 5.2.5. Sampling System
- 5.2.6. Density Measurement Equipment
- 5.2.7. Others
- 5.3. Market Analysis, Insights and Forecast - by Region
- 5.3.1. North America
- 5.3.2. South America
- 5.3.3. Europe
- 5.3.4. Middle East & Africa
- 5.3.5. Asia Pacific
- 5.1. Market Analysis, Insights and Forecast - by Application
- 6. Global Multi Stream Flow Computer Analysis, Insights and Forecast, 2021-2033
- 6.1. Market Analysis, Insights and Forecast - by Application
- 6.1.1. Fuel Monitoring
- 6.1.2. Liquid and Gas Measurement
- 6.1.3. Wellhead Measurement and Optimization
- 6.1.4. Pipeline Transmission and Distribution
- 6.1.5. Others
- 6.2. Market Analysis, Insights and Forecast - by Type
- 6.2.1. Pressure Gauges
- 6.2.2. Temperature Probes
- 6.2.3. Gas Composition Sensors
- 6.2.4. Meter Prover
- 6.2.5. Sampling System
- 6.2.6. Density Measurement Equipment
- 6.2.7. Others
- 6.1. Market Analysis, Insights and Forecast - by Application
- 7. North America Multi Stream Flow Computer Analysis, Insights and Forecast, 2020-2032
- 7.1. Market Analysis, Insights and Forecast - by Application
- 7.1.1. Fuel Monitoring
- 7.1.2. Liquid and Gas Measurement
- 7.1.3. Wellhead Measurement and Optimization
- 7.1.4. Pipeline Transmission and Distribution
- 7.1.5. Others
- 7.2. Market Analysis, Insights and Forecast - by Type
- 7.2.1. Pressure Gauges
- 7.2.2. Temperature Probes
- 7.2.3. Gas Composition Sensors
- 7.2.4. Meter Prover
- 7.2.5. Sampling System
- 7.2.6. Density Measurement Equipment
- 7.2.7. Others
- 7.1. Market Analysis, Insights and Forecast - by Application
- 8. South America Multi Stream Flow Computer Analysis, Insights and Forecast, 2020-2032
- 8.1. Market Analysis, Insights and Forecast - by Application
- 8.1.1. Fuel Monitoring
- 8.1.2. Liquid and Gas Measurement
- 8.1.3. Wellhead Measurement and Optimization
- 8.1.4. Pipeline Transmission and Distribution
- 8.1.5. Others
- 8.2. Market Analysis, Insights and Forecast - by Type
- 8.2.1. Pressure Gauges
- 8.2.2. Temperature Probes
- 8.2.3. Gas Composition Sensors
- 8.2.4. Meter Prover
- 8.2.5. Sampling System
- 8.2.6. Density Measurement Equipment
- 8.2.7. Others
- 8.1. Market Analysis, Insights and Forecast - by Application
- 9. Europe Multi Stream Flow Computer Analysis, Insights and Forecast, 2020-2032
- 9.1. Market Analysis, Insights and Forecast - by Application
- 9.1.1. Fuel Monitoring
- 9.1.2. Liquid and Gas Measurement
- 9.1.3. Wellhead Measurement and Optimization
- 9.1.4. Pipeline Transmission and Distribution
- 9.1.5. Others
- 9.2. Market Analysis, Insights and Forecast - by Type
- 9.2.1. Pressure Gauges
- 9.2.2. Temperature Probes
- 9.2.3. Gas Composition Sensors
- 9.2.4. Meter Prover
- 9.2.5. Sampling System
- 9.2.6. Density Measurement Equipment
- 9.2.7. Others
- 9.1. Market Analysis, Insights and Forecast - by Application
- 10. Middle East & Africa Multi Stream Flow Computer Analysis, Insights and Forecast, 2020-2032
- 10.1. Market Analysis, Insights and Forecast - by Application
- 10.1.1. Fuel Monitoring
- 10.1.2. Liquid and Gas Measurement
- 10.1.3. Wellhead Measurement and Optimization
- 10.1.4. Pipeline Transmission and Distribution
- 10.1.5. Others
- 10.2. Market Analysis, Insights and Forecast - by Type
- 10.2.1. Pressure Gauges
- 10.2.2. Temperature Probes
- 10.2.3. Gas Composition Sensors
- 10.2.4. Meter Prover
- 10.2.5. Sampling System
- 10.2.6. Density Measurement Equipment
- 10.2.7. Others
- 10.1. Market Analysis, Insights and Forecast - by Application
- 11. Asia Pacific Multi Stream Flow Computer Analysis, Insights and Forecast, 2020-2032
- 11.1. Market Analysis, Insights and Forecast - by Application
- 11.1.1. Fuel Monitoring
- 11.1.2. Liquid and Gas Measurement
- 11.1.3. Wellhead Measurement and Optimization
- 11.1.4. Pipeline Transmission and Distribution
- 11.1.5. Others
- 11.2. Market Analysis, Insights and Forecast - by Type
- 11.2.1. Pressure Gauges
- 11.2.2. Temperature Probes
- 11.2.3. Gas Composition Sensors
- 11.2.4. Meter Prover
- 11.2.5. Sampling System
- 11.2.6. Density Measurement Equipment
- 11.2.7. Others
- 11.1. Market Analysis, Insights and Forecast - by Application
- 12. Competitive Analysis
- 12.1. Company Profiles
- 12.1.1 ABB
- 12.1.1.1. Company Overview
- 12.1.1.2. Products
- 12.1.1.3. Company Financials
- 12.1.1.4. SWOT Analysis
- 12.1.2 SICK AG
- 12.1.2.1. Company Overview
- 12.1.2.2. Products
- 12.1.2.3. Company Financials
- 12.1.2.4. SWOT Analysis
- 12.1.3 Yokogawa Corporation of America
- 12.1.3.1. Company Overview
- 12.1.3.2. Products
- 12.1.3.3. Company Financials
- 12.1.3.4. SWOT Analysis
- 12.1.4 Thermo Fisher Scientific
- 12.1.4.1. Company Overview
- 12.1.4.2. Products
- 12.1.4.3. Company Financials
- 12.1.4.4. SWOT Analysis
- 12.1.5 Schneider Electric
- 12.1.5.1. Company Overview
- 12.1.5.2. Products
- 12.1.5.3. Company Financials
- 12.1.5.4. SWOT Analysis
- 12.1.6 Schlumberger
- 12.1.6.1. Company Overview
- 12.1.6.2. Products
- 12.1.6.3. Company Financials
- 12.1.6.4. SWOT Analysis
- 12.1.7 Flowmetrics
- 12.1.7.1. Company Overview
- 12.1.7.2. Products
- 12.1.7.3. Company Financials
- 12.1.7.4. SWOT Analysis
- 12.1.8 ProSoft Technology
- 12.1.8.1. Company Overview
- 12.1.8.2. Products
- 12.1.8.3. Company Financials
- 12.1.8.4. SWOT Analysis
- 12.1.9 KROHNE Messtechnik GmbH
- 12.1.9.1. Company Overview
- 12.1.9.2. Products
- 12.1.9.3. Company Financials
- 12.1.9.4. SWOT Analysis
- 12.1.10 OMNI FLOW Computers
- 12.1.10.1. Company Overview
- 12.1.10.2. Products
- 12.1.10.3. Company Financials
- 12.1.10.4. SWOT Analysis
- 12.1.11 Fluidwell BV
- 12.1.11.1. Company Overview
- 12.1.11.2. Products
- 12.1.11.3. Company Financials
- 12.1.11.4. SWOT Analysis
- 12.1.12 Contrec
- 12.1.12.1. Company Overview
- 12.1.12.2. Products
- 12.1.12.3. Company Financials
- 12.1.12.4. SWOT Analysis
- 12.1.13 Dynamic Flow Computers
- 12.1.13.1. Company Overview
- 12.1.13.2. Products
- 12.1.13.3. Company Financials
- 12.1.13.4. SWOT Analysis
- 12.1.14 Kessler-Ellis Products
- 12.1.14.1. Company Overview
- 12.1.14.2. Products
- 12.1.14.3. Company Financials
- 12.1.14.4. SWOT Analysis
- 12.1.15 Flow Systems Inc.
- 12.1.15.1. Company Overview
- 12.1.15.2. Products
- 12.1.15.3. Company Financials
- 12.1.15.4. SWOT Analysis
- 12.1.16 Hoffer Flow Controls Inc
- 12.1.16.1. Company Overview
- 12.1.16.2. Products
- 12.1.16.3. Company Financials
- 12.1.16.4. SWOT Analysis
- 12.1.17 Endress + Hauser
- 12.1.17.1. Company Overview
- 12.1.17.2. Products
- 12.1.17.3. Company Financials
- 12.1.17.4. SWOT Analysis
- 12.1.18 Emerson Electric Co
- 12.1.18.1. Company Overview
- 12.1.18.2. Products
- 12.1.18.3. Company Financials
- 12.1.18.4. SWOT Analysis
- 12.1.19 Technical Devices Co
- 12.1.19.1. Company Overview
- 12.1.19.2. Products
- 12.1.19.3. Company Financials
- 12.1.19.4. SWOT Analysis
- 12.1.20 Rockwell Automation
- 12.1.20.1. Company Overview
- 12.1.20.2. Products
- 12.1.20.3. Company Financials
- 12.1.20.4. SWOT Analysis
- 12.1.1 ABB
- 12.2. Market Entropy
- 12.2.1 Company's Key Areas Served
- 12.2.2 Recent Developments
- 12.3. Company Market Share Analysis 2025
- 12.3.1 Top 5 Companies Market Share Analysis
- 12.3.2 Top 3 Companies Market Share Analysis
- 12.4. List of Potential Customers
- 13. Research Methodology
List of Figures
- Figure 1: Global Multi Stream Flow Computer Revenue Breakdown (million, %) by Region 2025 & 2033
- Figure 2: North America Multi Stream Flow Computer Revenue (million), by Application 2025 & 2033
- Figure 3: North America Multi Stream Flow Computer Revenue Share (%), by Application 2025 & 2033
- Figure 4: North America Multi Stream Flow Computer Revenue (million), by Type 2025 & 2033
- Figure 5: North America Multi Stream Flow Computer Revenue Share (%), by Type 2025 & 2033
- Figure 6: North America Multi Stream Flow Computer Revenue (million), by Country 2025 & 2033
- Figure 7: North America Multi Stream Flow Computer Revenue Share (%), by Country 2025 & 2033
- Figure 8: South America Multi Stream Flow Computer Revenue (million), by Application 2025 & 2033
- Figure 9: South America Multi Stream Flow Computer Revenue Share (%), by Application 2025 & 2033
- Figure 10: South America Multi Stream Flow Computer Revenue (million), by Type 2025 & 2033
- Figure 11: South America Multi Stream Flow Computer Revenue Share (%), by Type 2025 & 2033
- Figure 12: South America Multi Stream Flow Computer Revenue (million), by Country 2025 & 2033
- Figure 13: South America Multi Stream Flow Computer Revenue Share (%), by Country 2025 & 2033
- Figure 14: Europe Multi Stream Flow Computer Revenue (million), by Application 2025 & 2033
- Figure 15: Europe Multi Stream Flow Computer Revenue Share (%), by Application 2025 & 2033
- Figure 16: Europe Multi Stream Flow Computer Revenue (million), by Type 2025 & 2033
- Figure 17: Europe Multi Stream Flow Computer Revenue Share (%), by Type 2025 & 2033
- Figure 18: Europe Multi Stream Flow Computer Revenue (million), by Country 2025 & 2033
- Figure 19: Europe Multi Stream Flow Computer Revenue Share (%), by Country 2025 & 2033
- Figure 20: Middle East & Africa Multi Stream Flow Computer Revenue (million), by Application 2025 & 2033
- Figure 21: Middle East & Africa Multi Stream Flow Computer Revenue Share (%), by Application 2025 & 2033
- Figure 22: Middle East & Africa Multi Stream Flow Computer Revenue (million), by Type 2025 & 2033
- Figure 23: Middle East & Africa Multi Stream Flow Computer Revenue Share (%), by Type 2025 & 2033
- Figure 24: Middle East & Africa Multi Stream Flow Computer Revenue (million), by Country 2025 & 2033
- Figure 25: Middle East & Africa Multi Stream Flow Computer Revenue Share (%), by Country 2025 & 2033
- Figure 26: Asia Pacific Multi Stream Flow Computer Revenue (million), by Application 2025 & 2033
- Figure 27: Asia Pacific Multi Stream Flow Computer Revenue Share (%), by Application 2025 & 2033
- Figure 28: Asia Pacific Multi Stream Flow Computer Revenue (million), by Type 2025 & 2033
- Figure 29: Asia Pacific Multi Stream Flow Computer Revenue Share (%), by Type 2025 & 2033
- Figure 30: Asia Pacific Multi Stream Flow Computer Revenue (million), by Country 2025 & 2033
- Figure 31: Asia Pacific Multi Stream Flow Computer Revenue Share (%), by Country 2025 & 2033
List of Tables
- Table 1: Global Multi Stream Flow Computer Revenue million Forecast, by Application 2020 & 2033
- Table 2: Global Multi Stream Flow Computer Revenue million Forecast, by Type 2020 & 2033
- Table 3: Global Multi Stream Flow Computer Revenue million Forecast, by Region 2020 & 2033
- Table 4: Global Multi Stream Flow Computer Revenue million Forecast, by Application 2020 & 2033
- Table 5: Global Multi Stream Flow Computer Revenue million Forecast, by Type 2020 & 2033
- Table 6: Global Multi Stream Flow Computer Revenue million Forecast, by Country 2020 & 2033
- Table 7: United States Multi Stream Flow Computer Revenue (million) Forecast, by Application 2020 & 2033
- Table 8: Canada Multi Stream Flow Computer Revenue (million) Forecast, by Application 2020 & 2033
- Table 9: Mexico Multi Stream Flow Computer Revenue (million) Forecast, by Application 2020 & 2033
- Table 10: Global Multi Stream Flow Computer Revenue million Forecast, by Application 2020 & 2033
- Table 11: Global Multi Stream Flow Computer Revenue million Forecast, by Type 2020 & 2033
- Table 12: Global Multi Stream Flow Computer Revenue million Forecast, by Country 2020 & 2033
- Table 13: Brazil Multi Stream Flow Computer Revenue (million) Forecast, by Application 2020 & 2033
- Table 14: Argentina Multi Stream Flow Computer Revenue (million) Forecast, by Application 2020 & 2033
- Table 15: Rest of South America Multi Stream Flow Computer Revenue (million) Forecast, by Application 2020 & 2033
- Table 16: Global Multi Stream Flow Computer Revenue million Forecast, by Application 2020 & 2033
- Table 17: Global Multi Stream Flow Computer Revenue million Forecast, by Type 2020 & 2033
- Table 18: Global Multi Stream Flow Computer Revenue million Forecast, by Country 2020 & 2033
- Table 19: United Kingdom Multi Stream Flow Computer Revenue (million) Forecast, by Application 2020 & 2033
- Table 20: Germany Multi Stream Flow Computer Revenue (million) Forecast, by Application 2020 & 2033
- Table 21: France Multi Stream Flow Computer Revenue (million) Forecast, by Application 2020 & 2033
- Table 22: Italy Multi Stream Flow Computer Revenue (million) Forecast, by Application 2020 & 2033
- Table 23: Spain Multi Stream Flow Computer Revenue (million) Forecast, by Application 2020 & 2033
- Table 24: Russia Multi Stream Flow Computer Revenue (million) Forecast, by Application 2020 & 2033
- Table 25: Benelux Multi Stream Flow Computer Revenue (million) Forecast, by Application 2020 & 2033
- Table 26: Nordics Multi Stream Flow Computer Revenue (million) Forecast, by Application 2020 & 2033
- Table 27: Rest of Europe Multi Stream Flow Computer Revenue (million) Forecast, by Application 2020 & 2033
- Table 28: Global Multi Stream Flow Computer Revenue million Forecast, by Application 2020 & 2033
- Table 29: Global Multi Stream Flow Computer Revenue million Forecast, by Type 2020 & 2033
- Table 30: Global Multi Stream Flow Computer Revenue million Forecast, by Country 2020 & 2033
- Table 31: Turkey Multi Stream Flow Computer Revenue (million) Forecast, by Application 2020 & 2033
- Table 32: Israel Multi Stream Flow Computer Revenue (million) Forecast, by Application 2020 & 2033
- Table 33: GCC Multi Stream Flow Computer Revenue (million) Forecast, by Application 2020 & 2033
- Table 34: North Africa Multi Stream Flow Computer Revenue (million) Forecast, by Application 2020 & 2033
- Table 35: South Africa Multi Stream Flow Computer Revenue (million) Forecast, by Application 2020 & 2033
- Table 36: Rest of Middle East & Africa Multi Stream Flow Computer Revenue (million) Forecast, by Application 2020 & 2033
- Table 37: Global Multi Stream Flow Computer Revenue million Forecast, by Application 2020 & 2033
- Table 38: Global Multi Stream Flow Computer Revenue million Forecast, by Type 2020 & 2033
- Table 39: Global Multi Stream Flow Computer Revenue million Forecast, by Country 2020 & 2033
- Table 40: China Multi Stream Flow Computer Revenue (million) Forecast, by Application 2020 & 2033
- Table 41: India Multi Stream Flow Computer Revenue (million) Forecast, by Application 2020 & 2033
- Table 42: Japan Multi Stream Flow Computer Revenue (million) Forecast, by Application 2020 & 2033
- Table 43: South Korea Multi Stream Flow Computer Revenue (million) Forecast, by Application 2020 & 2033
- Table 44: ASEAN Multi Stream Flow Computer Revenue (million) Forecast, by Application 2020 & 2033
- Table 45: Oceania Multi Stream Flow Computer Revenue (million) Forecast, by Application 2020 & 2033
- Table 46: Rest of Asia Pacific Multi Stream Flow Computer Revenue (million) Forecast, by Application 2020 & 2033
Frequently Asked Questions
1. What is the projected Compound Annual Growth Rate (CAGR) of the Multi Stream Flow Computer?
The projected CAGR is approximately 5.6%.
2. Which companies are prominent players in the Multi Stream Flow Computer?
Key companies in the market include ABB, SICK AG, Yokogawa Corporation of America, Thermo Fisher Scientific, Schneider Electric, Schlumberger, Flowmetrics, ProSoft Technology, KROHNE Messtechnik GmbH, OMNI FLOW Computers, Fluidwell BV, Contrec, Dynamic Flow Computers, Kessler-Ellis Products, Flow Systems, Inc., Hoffer Flow Controls Inc, Endress + Hauser, Emerson Electric Co, Technical Devices Co, Rockwell Automation.
3. What are the main segments of the Multi Stream Flow Computer?
The market segments include Application, Type.
4. Can you provide details about the market size?
The market size is estimated to be USD 42060 million as of 2022.
5. What are some drivers contributing to market growth?
N/A
6. What are the notable trends driving market growth?
N/A
7. Are there any restraints impacting market growth?
N/A
8. Can you provide examples of recent developments in the market?
N/A
9. What pricing options are available for accessing the report?
Pricing options include single-user, multi-user, and enterprise licenses priced at USD 2900.00, USD 4350.00, and USD 5800.00 respectively.
10. Is the market size provided in terms of value or volume?
The market size is provided in terms of value, measured in million.
11. Are there any specific market keywords associated with the report?
Yes, the market keyword associated with the report is "Multi Stream Flow Computer," which aids in identifying and referencing the specific market segment covered.
12. How do I determine which pricing option suits my needs best?
The pricing options vary based on user requirements and access needs. Individual users may opt for single-user licenses, while businesses requiring broader access may choose multi-user or enterprise licenses for cost-effective access to the report.
13. Are there any additional resources or data provided in the Multi Stream Flow Computer report?
While the report offers comprehensive insights, it's advisable to review the specific contents or supplementary materials provided to ascertain if additional resources or data are available.
14. How can I stay updated on further developments or reports in the Multi Stream Flow Computer?
To stay informed about further developments, trends, and reports in the Multi Stream Flow Computer, consider subscribing to industry newsletters, following relevant companies and organizations, or regularly checking reputable industry news sources and publications.
Methodology
Step 1 - Identification of Relevant Samples Size from Population Database


Step 2 - Approaches for Defining Global Market Size (Value, Volume* & Price*)

Note*: In applicable scenarios
Step 3 - Data Sources
Primary Research
- Web Analytics
- Survey Reports
- Research Institute
- Latest Research Reports
- Opinion Leaders
Secondary Research
- Annual Reports
- White Paper
- Latest Press Release
- Industry Association
- Paid Database
- Investor Presentations

Step 4 - Data Triangulation
Involves using different sources of information in order to increase the validity of a study
These sources are likely to be stakeholders in a program - participants, other researchers, program staff, other community members, and so on.
Then we put all data in single framework & apply various statistical tools to find out the dynamic on the market.
During the analysis stage, feedback from the stakeholder groups would be compared to determine areas of agreement as well as areas of divergence