

Key Insights
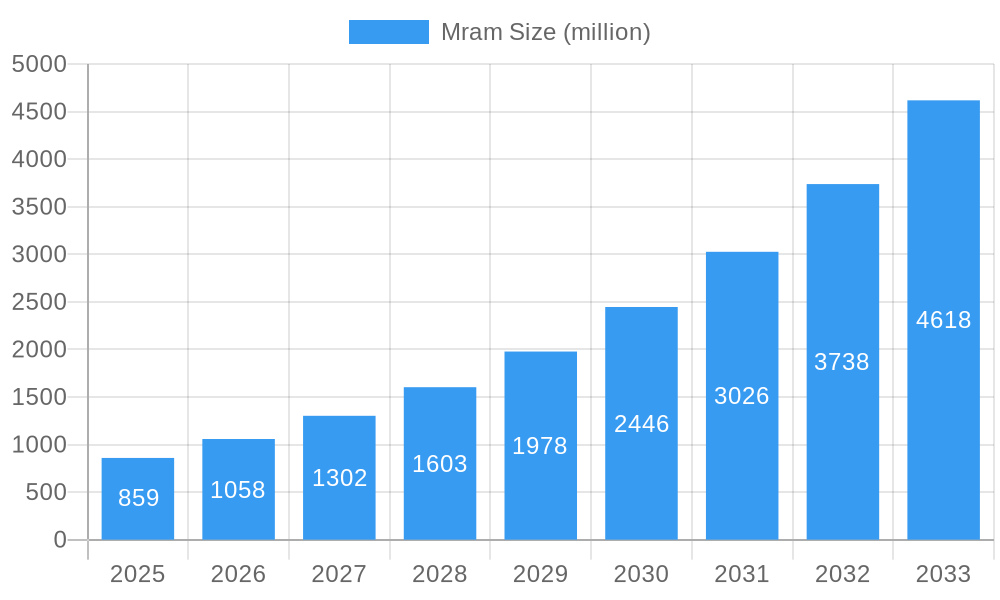
The MRAM market, currently valued at $859 million in 2025, is experiencing robust growth, projected to expand at a Compound Annual Growth Rate (CAGR) of 23.3% from 2025 to 2033. This explosive growth is driven by the increasing demand for high-speed, non-volatile memory solutions in diverse applications. Key drivers include the rising adoption of MRAM in automotive electronics, particularly in advanced driver-assistance systems (ADAS) and electric vehicles (EVs), where its low power consumption and fast read/write speeds are crucial. Furthermore, the expanding need for high-performance computing (HPC) and artificial intelligence (AI) applications fuels the demand for MRAM's superior speed and endurance compared to traditional memory technologies. The integration of MRAM into embedded systems and IoT devices is another significant growth catalyst. While challenges remain, such as cost considerations and technological advancements needed for widespread adoption, the market's inherent advantages are overcoming these obstacles. Strategic partnerships between memory manufacturers and system integrators are accelerating the pace of innovation and market penetration.
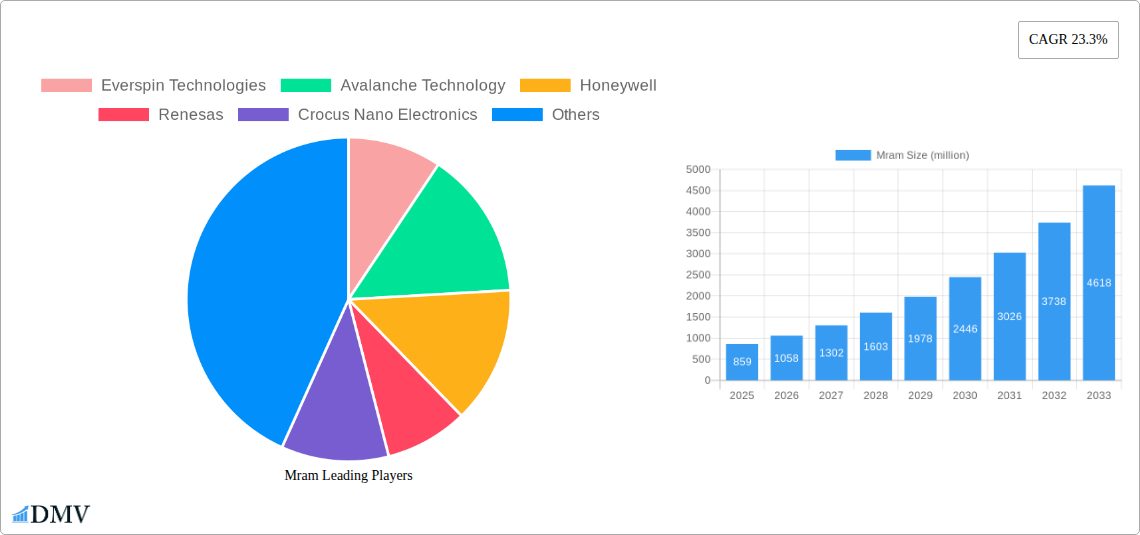
Mram Market Size (In Million)
The competitive landscape includes established players like Everspin Technologies, Avalanche Technology, Honeywell, Renesas, Crocus Nano Electronics, Samsung Electronics, Cobham, and NVE Corporation, each vying for market share through product differentiation and technological advancements. Regional growth is expected to be varied, with North America and Asia-Pacific likely leading the charge due to significant investments in technological development and the presence of key manufacturers and consumers. However, Europe and other regions are poised for significant growth, driven by increasing industrial automation and the adoption of smart technologies across various sectors. The forecast period, 2025-2033, promises a substantial expansion of the MRAM market, driven by continuous technological advancements, expanding applications, and increasing demand for faster and more efficient memory solutions across multiple industries.
Mram Company Market Share
MRAM Market Report: A Comprehensive Analysis (2019-2033)
This insightful report provides a comprehensive analysis of the MRAM market, projecting a multi-million-dollar valuation by 2033. We delve into market dynamics, technological advancements, key players, and future growth opportunities, equipping stakeholders with actionable intelligence for strategic decision-making. Our detailed forecast, spanning the historical period (2019-2024), base year (2025), and forecast period (2025-2033), offers a clear roadmap for navigating this rapidly evolving landscape.
MRAM Market Composition & Trends
This section evaluates the MRAM market's competitive landscape, examining market concentration, innovation drivers, regulatory frameworks, substitute technologies, end-user segments, and merger & acquisition (M&A) activity. The study period (2019-2033) reveals significant shifts in market share distribution, with xx million in M&A deals recorded during the historical period.
- Market Concentration: The market exhibits a moderately concentrated structure, with key players like Everspin Technologies, Avalanche Technology, and Samsung Electronics holding significant shares. The estimated 2025 market share of Everspin Technologies is xx%, Avalanche Technology holds xx%, and Samsung Electronics accounts for xx%.
- Innovation Catalysts: Continuous advancements in spintronics and nanotechnology fuel innovation, leading to higher density, faster speeds, and lower power consumption.
- Regulatory Landscape: Government initiatives promoting semiconductor advancements and data storage technologies significantly impact market growth. Specific regulations vary by region, with some offering substantial incentives.
- Substitute Products: While other non-volatile memory technologies exist (e.g., NAND Flash, NOR Flash), MRAM's unique advantages in speed and endurance position it for significant market penetration.
- End-User Profiles: Key end-users span diverse sectors including data centers, automotive, industrial automation, and consumer electronics, each driving specific MRAM application requirements.
- M&A Activities: The historical period (2019-2024) witnessed xx million in M&A activity, primarily focused on consolidating technological capabilities and expanding market reach.
MRAM Industry Evolution
This section analyzes the trajectory of the MRAM market, examining growth patterns, technological breakthroughs, and evolving consumer demands throughout the study period (2019-2033). The market is projected to experience a Compound Annual Growth Rate (CAGR) of xx% during the forecast period (2025-2033), reaching a value of xx million by 2033. This growth is driven by increasing demand for high-performance, low-power memory solutions. Technological advancements like improved spin-transfer torque (STT) and thermal-assisted switching (TAS) methods are crucial factors in this expansion. The adoption rate of MRAM in various applications, notably in the automotive and industrial sectors, is projected to accelerate significantly, exceeding xx% by 2030. Consumer demand shifts towards high-speed data processing and enhanced device efficiency directly correlate with growing adoption.
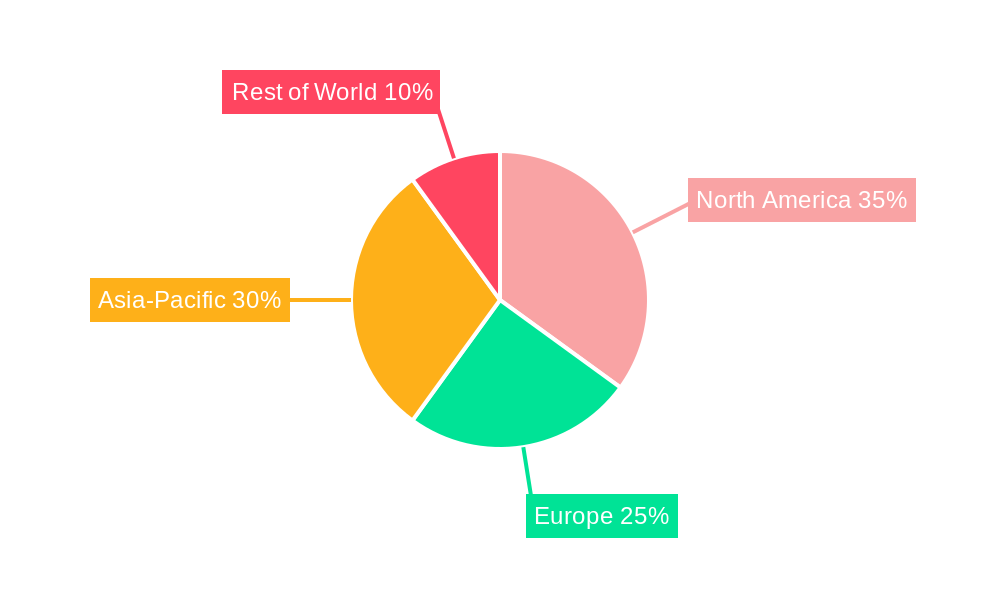
Leading Regions, Countries, or Segments in MRAM
This section identifies the dominant regions and segments in the MRAM market. North America currently holds the largest market share, driven primarily by significant investments in research and development and strong technological innovation within the region. The key drivers are as follows:
- High R&D Investment: Significant funding from both government and private sources has fueled innovation and development within the North American MRAM sector, leading to substantial technological advancements.
- Strong Technological Ecosystem: The presence of leading MRAM manufacturers and supporting companies creates a robust and collaborative ecosystem, fostering innovation.
- Government Support and Initiatives: Favorable regulatory policies and initiatives aimed at boosting domestic semiconductor production further strengthen the region's position.
MRAM Product Innovations
Recent product innovations focus on enhancing MRAM's performance metrics and expanding applications. New generations of MRAM chips boast significantly higher density, improved speed, and reduced power consumption compared to previous generations. This is achieved through advanced manufacturing techniques and novel materials. Unique selling propositions include non-volatility, enabling data retention even when power is off, and fast write speeds, comparable to SRAM. These advancements are making MRAM increasingly competitive against alternative memory technologies.
Propelling Factors for MRAM Growth
Several key factors propel MRAM market growth: Firstly, the increasing demand for high-speed, low-power memory solutions across various applications is a primary driver. Secondly, technological advancements, such as improvements in spin-transfer torque (STT) and thermal-assisted switching (TAS) technologies, are enhancing MRAM's performance capabilities. Finally, government initiatives supporting the development of advanced semiconductor technologies provide strong tailwinds. These combined factors position MRAM for significant market expansion.
Obstacles in the MRAM Market
Despite its potential, the MRAM market faces challenges. High manufacturing costs compared to established technologies like Flash memory represent a significant barrier to wider adoption. Furthermore, supply chain constraints and potential disruptions can impact production and market availability. Finally, intense competition from established memory players necessitates continuous innovation and cost reductions to maintain market share.
Future Opportunities in MRAM
Emerging opportunities lie in the expansion of MRAM applications into new sectors. The automotive industry, with its increasing reliance on sophisticated electronics, presents a substantial growth opportunity. Additionally, advancements in artificial intelligence and machine learning create demand for high-speed and low-power memory solutions, further fueling MRAM adoption. Exploration of new materials and architectures may unlock even greater performance and cost benefits.
Major Players in the MRAM Ecosystem
Key Developments in MRAM Industry
- 2022-Q4: Everspin Technologies announced a new generation of STT-MRAM with increased density.
- 2023-Q1: Avalanche Technology secured a major contract for MRAM supply in the automotive sector.
- 2023-Q2: Samsung Electronics unveiled advanced manufacturing techniques for higher-yield MRAM production.
- (Further developments can be added here as they become available.)
Strategic MRAM Market Forecast
The MRAM market is poised for substantial growth, driven by technological advancements, increasing demand across diverse sectors, and favorable government policies. The forecast period (2025-2033) promises significant market expansion, with an anticipated market value of xx million by 2033. Continuous innovation, strategic partnerships, and effective supply chain management will be crucial for capturing this market potential.
Mram Segmentation
-
1. Application
- 1.1. Aerospace
- 1.2. Automotive
- 1.3. Factory Automation
- 1.4. Enterprise Storage
- 1.5. Internet of Things
- 1.6. Others
-
2. Type
- 2.1. Toggle MRAM
- 2.2. STT-MRAM
Mram Segmentation By Geography
-
1. North America
- 1.1. United States
- 1.2. Canada
- 1.3. Mexico
-
2. South America
- 2.1. Brazil
- 2.2. Argentina
- 2.3. Rest of South America
-
3. Europe
- 3.1. United Kingdom
- 3.2. Germany
- 3.3. France
- 3.4. Italy
- 3.5. Spain
- 3.6. Russia
- 3.7. Benelux
- 3.8. Nordics
- 3.9. Rest of Europe
-
4. Middle East & Africa
- 4.1. Turkey
- 4.2. Israel
- 4.3. GCC
- 4.4. North Africa
- 4.5. South Africa
- 4.6. Rest of Middle East & Africa
-
5. Asia Pacific
- 5.1. China
- 5.2. India
- 5.3. Japan
- 5.4. South Korea
- 5.5. ASEAN
- 5.6. Oceania
- 5.7. Rest of Asia Pacific
Mram Regional Market Share
Geographic Coverage of Mram
Mram REPORT HIGHLIGHTS
| Aspects | Details |
|---|---|
| Study Period | 2020-2034 |
| Base Year | 2025 |
| Estimated Year | 2026 |
| Forecast Period | 2026-2034 |
| Historical Period | 2020-2025 |
| Growth Rate | CAGR of 23.3% from 2020-2034 |
| Segmentation |
|
Table of Contents
- 1. Introduction
- 1.1. Research Scope
- 1.2. Market Segmentation
- 1.3. Research Objective
- 1.4. Definitions and Assumptions
- 2. Executive Summary
- 2.1. Market Snapshot
- 3. Market Dynamics
- 3.1. Market Drivers
- 3.2. Market Restrains
- 3.3. Market Trends
- 3.4. Market Opportunities
- 4. Market Factor Analysis
- 4.1. Porters Five Forces
- 4.1.1. Bargaining Power of Suppliers
- 4.1.2. Bargaining Power of Buyers
- 4.1.3. Threat of New Entrants
- 4.1.4. Threat of Substitutes
- 4.1.5. Competitive Rivalry
- 4.2. PESTEL analysis
- 4.3. BCG Analysis
- 4.3.1. Stars (High Growth, High Market Share)
- 4.3.2. Cash Cows (Low Growth, High Market Share)
- 4.3.3. Question Mark (High Growth, Low Market Share)
- 4.3.4. Dogs (Low Growth, Low Market Share)
- 4.4. Ansoff Matrix Analysis
- 4.5. Supply Chain Analysis
- 4.6. Regulatory Landscape
- 4.7. Current Market Potential and Opportunity Assessment (TAM–SAM–SOM Framework)
- 4.8. DMV Analyst Note
- 4.1. Porters Five Forces
- 5. Market Analysis, Insights and Forecast 2021-2033
- 5.1. Market Analysis, Insights and Forecast - by Application
- 5.1.1. Aerospace
- 5.1.2. Automotive
- 5.1.3. Factory Automation
- 5.1.4. Enterprise Storage
- 5.1.5. Internet of Things
- 5.1.6. Others
- 5.2. Market Analysis, Insights and Forecast - by Type
- 5.2.1. Toggle MRAM
- 5.2.2. STT-MRAM
- 5.3. Market Analysis, Insights and Forecast - by Region
- 5.3.1. North America
- 5.3.2. South America
- 5.3.3. Europe
- 5.3.4. Middle East & Africa
- 5.3.5. Asia Pacific
- 5.1. Market Analysis, Insights and Forecast - by Application
- 6. Global Mram Analysis, Insights and Forecast, 2021-2033
- 6.1. Market Analysis, Insights and Forecast - by Application
- 6.1.1. Aerospace
- 6.1.2. Automotive
- 6.1.3. Factory Automation
- 6.1.4. Enterprise Storage
- 6.1.5. Internet of Things
- 6.1.6. Others
- 6.2. Market Analysis, Insights and Forecast - by Type
- 6.2.1. Toggle MRAM
- 6.2.2. STT-MRAM
- 6.1. Market Analysis, Insights and Forecast - by Application
- 7. North America Mram Analysis, Insights and Forecast, 2020-2032
- 7.1. Market Analysis, Insights and Forecast - by Application
- 7.1.1. Aerospace
- 7.1.2. Automotive
- 7.1.3. Factory Automation
- 7.1.4. Enterprise Storage
- 7.1.5. Internet of Things
- 7.1.6. Others
- 7.2. Market Analysis, Insights and Forecast - by Type
- 7.2.1. Toggle MRAM
- 7.2.2. STT-MRAM
- 7.1. Market Analysis, Insights and Forecast - by Application
- 8. South America Mram Analysis, Insights and Forecast, 2020-2032
- 8.1. Market Analysis, Insights and Forecast - by Application
- 8.1.1. Aerospace
- 8.1.2. Automotive
- 8.1.3. Factory Automation
- 8.1.4. Enterprise Storage
- 8.1.5. Internet of Things
- 8.1.6. Others
- 8.2. Market Analysis, Insights and Forecast - by Type
- 8.2.1. Toggle MRAM
- 8.2.2. STT-MRAM
- 8.1. Market Analysis, Insights and Forecast - by Application
- 9. Europe Mram Analysis, Insights and Forecast, 2020-2032
- 9.1. Market Analysis, Insights and Forecast - by Application
- 9.1.1. Aerospace
- 9.1.2. Automotive
- 9.1.3. Factory Automation
- 9.1.4. Enterprise Storage
- 9.1.5. Internet of Things
- 9.1.6. Others
- 9.2. Market Analysis, Insights and Forecast - by Type
- 9.2.1. Toggle MRAM
- 9.2.2. STT-MRAM
- 9.1. Market Analysis, Insights and Forecast - by Application
- 10. Middle East & Africa Mram Analysis, Insights and Forecast, 2020-2032
- 10.1. Market Analysis, Insights and Forecast - by Application
- 10.1.1. Aerospace
- 10.1.2. Automotive
- 10.1.3. Factory Automation
- 10.1.4. Enterprise Storage
- 10.1.5. Internet of Things
- 10.1.6. Others
- 10.2. Market Analysis, Insights and Forecast - by Type
- 10.2.1. Toggle MRAM
- 10.2.2. STT-MRAM
- 10.1. Market Analysis, Insights and Forecast - by Application
- 11. Asia Pacific Mram Analysis, Insights and Forecast, 2020-2032
- 11.1. Market Analysis, Insights and Forecast - by Application
- 11.1.1. Aerospace
- 11.1.2. Automotive
- 11.1.3. Factory Automation
- 11.1.4. Enterprise Storage
- 11.1.5. Internet of Things
- 11.1.6. Others
- 11.2. Market Analysis, Insights and Forecast - by Type
- 11.2.1. Toggle MRAM
- 11.2.2. STT-MRAM
- 11.1. Market Analysis, Insights and Forecast - by Application
- 12. Competitive Analysis
- 12.1. Company Profiles
- 12.1.1 Everspin Technologies
- 12.1.1.1. Company Overview
- 12.1.1.2. Products
- 12.1.1.3. Company Financials
- 12.1.1.4. SWOT Analysis
- 12.1.2 Avalanche Technology
- 12.1.2.1. Company Overview
- 12.1.2.2. Products
- 12.1.2.3. Company Financials
- 12.1.2.4. SWOT Analysis
- 12.1.3 Honeywell
- 12.1.3.1. Company Overview
- 12.1.3.2. Products
- 12.1.3.3. Company Financials
- 12.1.3.4. SWOT Analysis
- 12.1.4 Renesas
- 12.1.4.1. Company Overview
- 12.1.4.2. Products
- 12.1.4.3. Company Financials
- 12.1.4.4. SWOT Analysis
- 12.1.5 Crocus Nano Electronics
- 12.1.5.1. Company Overview
- 12.1.5.2. Products
- 12.1.5.3. Company Financials
- 12.1.5.4. SWOT Analysis
- 12.1.6 Samsung Electronics
- 12.1.6.1. Company Overview
- 12.1.6.2. Products
- 12.1.6.3. Company Financials
- 12.1.6.4. SWOT Analysis
- 12.1.7 Cobham
- 12.1.7.1. Company Overview
- 12.1.7.2. Products
- 12.1.7.3. Company Financials
- 12.1.7.4. SWOT Analysis
- 12.1.8 NVE Corporation
- 12.1.8.1. Company Overview
- 12.1.8.2. Products
- 12.1.8.3. Company Financials
- 12.1.8.4. SWOT Analysis
- 12.1.1 Everspin Technologies
- 12.2. Market Entropy
- 12.2.1 Company's Key Areas Served
- 12.2.2 Recent Developments
- 12.3. Company Market Share Analysis 2025
- 12.3.1 Top 5 Companies Market Share Analysis
- 12.3.2 Top 3 Companies Market Share Analysis
- 12.4. List of Potential Customers
- 13. Research Methodology
List of Figures
- Figure 1: Global Mram Revenue Breakdown (million, %) by Region 2025 & 2033
- Figure 2: Global Mram Volume Breakdown (K, %) by Region 2025 & 2033
- Figure 3: North America Mram Revenue (million), by Application 2025 & 2033
- Figure 4: North America Mram Volume (K), by Application 2025 & 2033
- Figure 5: North America Mram Revenue Share (%), by Application 2025 & 2033
- Figure 6: North America Mram Volume Share (%), by Application 2025 & 2033
- Figure 7: North America Mram Revenue (million), by Type 2025 & 2033
- Figure 8: North America Mram Volume (K), by Type 2025 & 2033
- Figure 9: North America Mram Revenue Share (%), by Type 2025 & 2033
- Figure 10: North America Mram Volume Share (%), by Type 2025 & 2033
- Figure 11: North America Mram Revenue (million), by Country 2025 & 2033
- Figure 12: North America Mram Volume (K), by Country 2025 & 2033
- Figure 13: North America Mram Revenue Share (%), by Country 2025 & 2033
- Figure 14: North America Mram Volume Share (%), by Country 2025 & 2033
- Figure 15: South America Mram Revenue (million), by Application 2025 & 2033
- Figure 16: South America Mram Volume (K), by Application 2025 & 2033
- Figure 17: South America Mram Revenue Share (%), by Application 2025 & 2033
- Figure 18: South America Mram Volume Share (%), by Application 2025 & 2033
- Figure 19: South America Mram Revenue (million), by Type 2025 & 2033
- Figure 20: South America Mram Volume (K), by Type 2025 & 2033
- Figure 21: South America Mram Revenue Share (%), by Type 2025 & 2033
- Figure 22: South America Mram Volume Share (%), by Type 2025 & 2033
- Figure 23: South America Mram Revenue (million), by Country 2025 & 2033
- Figure 24: South America Mram Volume (K), by Country 2025 & 2033
- Figure 25: South America Mram Revenue Share (%), by Country 2025 & 2033
- Figure 26: South America Mram Volume Share (%), by Country 2025 & 2033
- Figure 27: Europe Mram Revenue (million), by Application 2025 & 2033
- Figure 28: Europe Mram Volume (K), by Application 2025 & 2033
- Figure 29: Europe Mram Revenue Share (%), by Application 2025 & 2033
- Figure 30: Europe Mram Volume Share (%), by Application 2025 & 2033
- Figure 31: Europe Mram Revenue (million), by Type 2025 & 2033
- Figure 32: Europe Mram Volume (K), by Type 2025 & 2033
- Figure 33: Europe Mram Revenue Share (%), by Type 2025 & 2033
- Figure 34: Europe Mram Volume Share (%), by Type 2025 & 2033
- Figure 35: Europe Mram Revenue (million), by Country 2025 & 2033
- Figure 36: Europe Mram Volume (K), by Country 2025 & 2033
- Figure 37: Europe Mram Revenue Share (%), by Country 2025 & 2033
- Figure 38: Europe Mram Volume Share (%), by Country 2025 & 2033
- Figure 39: Middle East & Africa Mram Revenue (million), by Application 2025 & 2033
- Figure 40: Middle East & Africa Mram Volume (K), by Application 2025 & 2033
- Figure 41: Middle East & Africa Mram Revenue Share (%), by Application 2025 & 2033
- Figure 42: Middle East & Africa Mram Volume Share (%), by Application 2025 & 2033
- Figure 43: Middle East & Africa Mram Revenue (million), by Type 2025 & 2033
- Figure 44: Middle East & Africa Mram Volume (K), by Type 2025 & 2033
- Figure 45: Middle East & Africa Mram Revenue Share (%), by Type 2025 & 2033
- Figure 46: Middle East & Africa Mram Volume Share (%), by Type 2025 & 2033
- Figure 47: Middle East & Africa Mram Revenue (million), by Country 2025 & 2033
- Figure 48: Middle East & Africa Mram Volume (K), by Country 2025 & 2033
- Figure 49: Middle East & Africa Mram Revenue Share (%), by Country 2025 & 2033
- Figure 50: Middle East & Africa Mram Volume Share (%), by Country 2025 & 2033
- Figure 51: Asia Pacific Mram Revenue (million), by Application 2025 & 2033
- Figure 52: Asia Pacific Mram Volume (K), by Application 2025 & 2033
- Figure 53: Asia Pacific Mram Revenue Share (%), by Application 2025 & 2033
- Figure 54: Asia Pacific Mram Volume Share (%), by Application 2025 & 2033
- Figure 55: Asia Pacific Mram Revenue (million), by Type 2025 & 2033
- Figure 56: Asia Pacific Mram Volume (K), by Type 2025 & 2033
- Figure 57: Asia Pacific Mram Revenue Share (%), by Type 2025 & 2033
- Figure 58: Asia Pacific Mram Volume Share (%), by Type 2025 & 2033
- Figure 59: Asia Pacific Mram Revenue (million), by Country 2025 & 2033
- Figure 60: Asia Pacific Mram Volume (K), by Country 2025 & 2033
- Figure 61: Asia Pacific Mram Revenue Share (%), by Country 2025 & 2033
- Figure 62: Asia Pacific Mram Volume Share (%), by Country 2025 & 2033
List of Tables
- Table 1: Global Mram Revenue million Forecast, by Application 2020 & 2033
- Table 2: Global Mram Volume K Forecast, by Application 2020 & 2033
- Table 3: Global Mram Revenue million Forecast, by Type 2020 & 2033
- Table 4: Global Mram Volume K Forecast, by Type 2020 & 2033
- Table 5: Global Mram Revenue million Forecast, by Region 2020 & 2033
- Table 6: Global Mram Volume K Forecast, by Region 2020 & 2033
- Table 7: Global Mram Revenue million Forecast, by Application 2020 & 2033
- Table 8: Global Mram Volume K Forecast, by Application 2020 & 2033
- Table 9: Global Mram Revenue million Forecast, by Type 2020 & 2033
- Table 10: Global Mram Volume K Forecast, by Type 2020 & 2033
- Table 11: Global Mram Revenue million Forecast, by Country 2020 & 2033
- Table 12: Global Mram Volume K Forecast, by Country 2020 & 2033
- Table 13: United States Mram Revenue (million) Forecast, by Application 2020 & 2033
- Table 14: United States Mram Volume (K) Forecast, by Application 2020 & 2033
- Table 15: Canada Mram Revenue (million) Forecast, by Application 2020 & 2033
- Table 16: Canada Mram Volume (K) Forecast, by Application 2020 & 2033
- Table 17: Mexico Mram Revenue (million) Forecast, by Application 2020 & 2033
- Table 18: Mexico Mram Volume (K) Forecast, by Application 2020 & 2033
- Table 19: Global Mram Revenue million Forecast, by Application 2020 & 2033
- Table 20: Global Mram Volume K Forecast, by Application 2020 & 2033
- Table 21: Global Mram Revenue million Forecast, by Type 2020 & 2033
- Table 22: Global Mram Volume K Forecast, by Type 2020 & 2033
- Table 23: Global Mram Revenue million Forecast, by Country 2020 & 2033
- Table 24: Global Mram Volume K Forecast, by Country 2020 & 2033
- Table 25: Brazil Mram Revenue (million) Forecast, by Application 2020 & 2033
- Table 26: Brazil Mram Volume (K) Forecast, by Application 2020 & 2033
- Table 27: Argentina Mram Revenue (million) Forecast, by Application 2020 & 2033
- Table 28: Argentina Mram Volume (K) Forecast, by Application 2020 & 2033
- Table 29: Rest of South America Mram Revenue (million) Forecast, by Application 2020 & 2033
- Table 30: Rest of South America Mram Volume (K) Forecast, by Application 2020 & 2033
- Table 31: Global Mram Revenue million Forecast, by Application 2020 & 2033
- Table 32: Global Mram Volume K Forecast, by Application 2020 & 2033
- Table 33: Global Mram Revenue million Forecast, by Type 2020 & 2033
- Table 34: Global Mram Volume K Forecast, by Type 2020 & 2033
- Table 35: Global Mram Revenue million Forecast, by Country 2020 & 2033
- Table 36: Global Mram Volume K Forecast, by Country 2020 & 2033
- Table 37: United Kingdom Mram Revenue (million) Forecast, by Application 2020 & 2033
- Table 38: United Kingdom Mram Volume (K) Forecast, by Application 2020 & 2033
- Table 39: Germany Mram Revenue (million) Forecast, by Application 2020 & 2033
- Table 40: Germany Mram Volume (K) Forecast, by Application 2020 & 2033
- Table 41: France Mram Revenue (million) Forecast, by Application 2020 & 2033
- Table 42: France Mram Volume (K) Forecast, by Application 2020 & 2033
- Table 43: Italy Mram Revenue (million) Forecast, by Application 2020 & 2033
- Table 44: Italy Mram Volume (K) Forecast, by Application 2020 & 2033
- Table 45: Spain Mram Revenue (million) Forecast, by Application 2020 & 2033
- Table 46: Spain Mram Volume (K) Forecast, by Application 2020 & 2033
- Table 47: Russia Mram Revenue (million) Forecast, by Application 2020 & 2033
- Table 48: Russia Mram Volume (K) Forecast, by Application 2020 & 2033
- Table 49: Benelux Mram Revenue (million) Forecast, by Application 2020 & 2033
- Table 50: Benelux Mram Volume (K) Forecast, by Application 2020 & 2033
- Table 51: Nordics Mram Revenue (million) Forecast, by Application 2020 & 2033
- Table 52: Nordics Mram Volume (K) Forecast, by Application 2020 & 2033
- Table 53: Rest of Europe Mram Revenue (million) Forecast, by Application 2020 & 2033
- Table 54: Rest of Europe Mram Volume (K) Forecast, by Application 2020 & 2033
- Table 55: Global Mram Revenue million Forecast, by Application 2020 & 2033
- Table 56: Global Mram Volume K Forecast, by Application 2020 & 2033
- Table 57: Global Mram Revenue million Forecast, by Type 2020 & 2033
- Table 58: Global Mram Volume K Forecast, by Type 2020 & 2033
- Table 59: Global Mram Revenue million Forecast, by Country 2020 & 2033
- Table 60: Global Mram Volume K Forecast, by Country 2020 & 2033
- Table 61: Turkey Mram Revenue (million) Forecast, by Application 2020 & 2033
- Table 62: Turkey Mram Volume (K) Forecast, by Application 2020 & 2033
- Table 63: Israel Mram Revenue (million) Forecast, by Application 2020 & 2033
- Table 64: Israel Mram Volume (K) Forecast, by Application 2020 & 2033
- Table 65: GCC Mram Revenue (million) Forecast, by Application 2020 & 2033
- Table 66: GCC Mram Volume (K) Forecast, by Application 2020 & 2033
- Table 67: North Africa Mram Revenue (million) Forecast, by Application 2020 & 2033
- Table 68: North Africa Mram Volume (K) Forecast, by Application 2020 & 2033
- Table 69: South Africa Mram Revenue (million) Forecast, by Application 2020 & 2033
- Table 70: South Africa Mram Volume (K) Forecast, by Application 2020 & 2033
- Table 71: Rest of Middle East & Africa Mram Revenue (million) Forecast, by Application 2020 & 2033
- Table 72: Rest of Middle East & Africa Mram Volume (K) Forecast, by Application 2020 & 2033
- Table 73: Global Mram Revenue million Forecast, by Application 2020 & 2033
- Table 74: Global Mram Volume K Forecast, by Application 2020 & 2033
- Table 75: Global Mram Revenue million Forecast, by Type 2020 & 2033
- Table 76: Global Mram Volume K Forecast, by Type 2020 & 2033
- Table 77: Global Mram Revenue million Forecast, by Country 2020 & 2033
- Table 78: Global Mram Volume K Forecast, by Country 2020 & 2033
- Table 79: China Mram Revenue (million) Forecast, by Application 2020 & 2033
- Table 80: China Mram Volume (K) Forecast, by Application 2020 & 2033
- Table 81: India Mram Revenue (million) Forecast, by Application 2020 & 2033
- Table 82: India Mram Volume (K) Forecast, by Application 2020 & 2033
- Table 83: Japan Mram Revenue (million) Forecast, by Application 2020 & 2033
- Table 84: Japan Mram Volume (K) Forecast, by Application 2020 & 2033
- Table 85: South Korea Mram Revenue (million) Forecast, by Application 2020 & 2033
- Table 86: South Korea Mram Volume (K) Forecast, by Application 2020 & 2033
- Table 87: ASEAN Mram Revenue (million) Forecast, by Application 2020 & 2033
- Table 88: ASEAN Mram Volume (K) Forecast, by Application 2020 & 2033
- Table 89: Oceania Mram Revenue (million) Forecast, by Application 2020 & 2033
- Table 90: Oceania Mram Volume (K) Forecast, by Application 2020 & 2033
- Table 91: Rest of Asia Pacific Mram Revenue (million) Forecast, by Application 2020 & 2033
- Table 92: Rest of Asia Pacific Mram Volume (K) Forecast, by Application 2020 & 2033
Frequently Asked Questions
1. What is the projected Compound Annual Growth Rate (CAGR) of the Mram?
The projected CAGR is approximately 23.3%.
2. Which companies are prominent players in the Mram?
Key companies in the market include Everspin Technologies, Avalanche Technology, Honeywell, Renesas, Crocus Nano Electronics, Samsung Electronics, Cobham, NVE Corporation.
3. What are the main segments of the Mram?
The market segments include Application, Type.
4. Can you provide details about the market size?
The market size is estimated to be USD 859 million as of 2022.
5. What are some drivers contributing to market growth?
N/A
6. What are the notable trends driving market growth?
N/A
7. Are there any restraints impacting market growth?
N/A
8. Can you provide examples of recent developments in the market?
N/A
9. What pricing options are available for accessing the report?
Pricing options include single-user, multi-user, and enterprise licenses priced at USD 3950.00, USD 5925.00, and USD 7900.00 respectively.
10. Is the market size provided in terms of value or volume?
The market size is provided in terms of value, measured in million and volume, measured in K.
11. Are there any specific market keywords associated with the report?
Yes, the market keyword associated with the report is "Mram," which aids in identifying and referencing the specific market segment covered.
12. How do I determine which pricing option suits my needs best?
The pricing options vary based on user requirements and access needs. Individual users may opt for single-user licenses, while businesses requiring broader access may choose multi-user or enterprise licenses for cost-effective access to the report.
13. Are there any additional resources or data provided in the Mram report?
While the report offers comprehensive insights, it's advisable to review the specific contents or supplementary materials provided to ascertain if additional resources or data are available.
14. How can I stay updated on further developments or reports in the Mram?
To stay informed about further developments, trends, and reports in the Mram, consider subscribing to industry newsletters, following relevant companies and organizations, or regularly checking reputable industry news sources and publications.
Methodology
Step 1 - Identification of Relevant Samples Size from Population Database


Step 2 - Approaches for Defining Global Market Size (Value, Volume* & Price*)

Note*: In applicable scenarios
Step 3 - Data Sources
Primary Research
- Web Analytics
- Survey Reports
- Research Institute
- Latest Research Reports
- Opinion Leaders
Secondary Research
- Annual Reports
- White Paper
- Latest Press Release
- Industry Association
- Paid Database
- Investor Presentations

Step 4 - Data Triangulation
Involves using different sources of information in order to increase the validity of a study
These sources are likely to be stakeholders in a program - participants, other researchers, program staff, other community members, and so on.
Then we put all data in single framework & apply various statistical tools to find out the dynamic on the market.
During the analysis stage, feedback from the stakeholder groups would be compared to determine areas of agreement as well as areas of divergence