

Key Insights
The monochrome area scan camera market is poised for significant expansion, propelled by escalating automation demands across a multitude of industries. The market, valued at 6.84 billion in the 2025 base year, is projected to achieve a robust compound annual growth rate (CAGR) of 12.05%, reaching an estimated market size of 15.72 billion by 2033. Key growth drivers include the widespread integration of machine vision systems within manufacturing environments, specifically for critical quality control and inspection functions. The automotive, electronics, and logistics sectors are primary contributors, driven by the imperative for high-speed, high-resolution imaging capabilities. Moreover, advancements in sensor technology, delivering enhanced sensitivity and resolution at competitive price points, are substantially fueling market growth. Emerging applications in medical imaging and scientific research further augment the market's trajectory. Despite challenges such as the intricate integration of these cameras into existing infrastructures and potential supply chain vulnerabilities, the overall market outlook remains exceptionally strong, underpinned by continuous technological innovation and the diversification of applications.
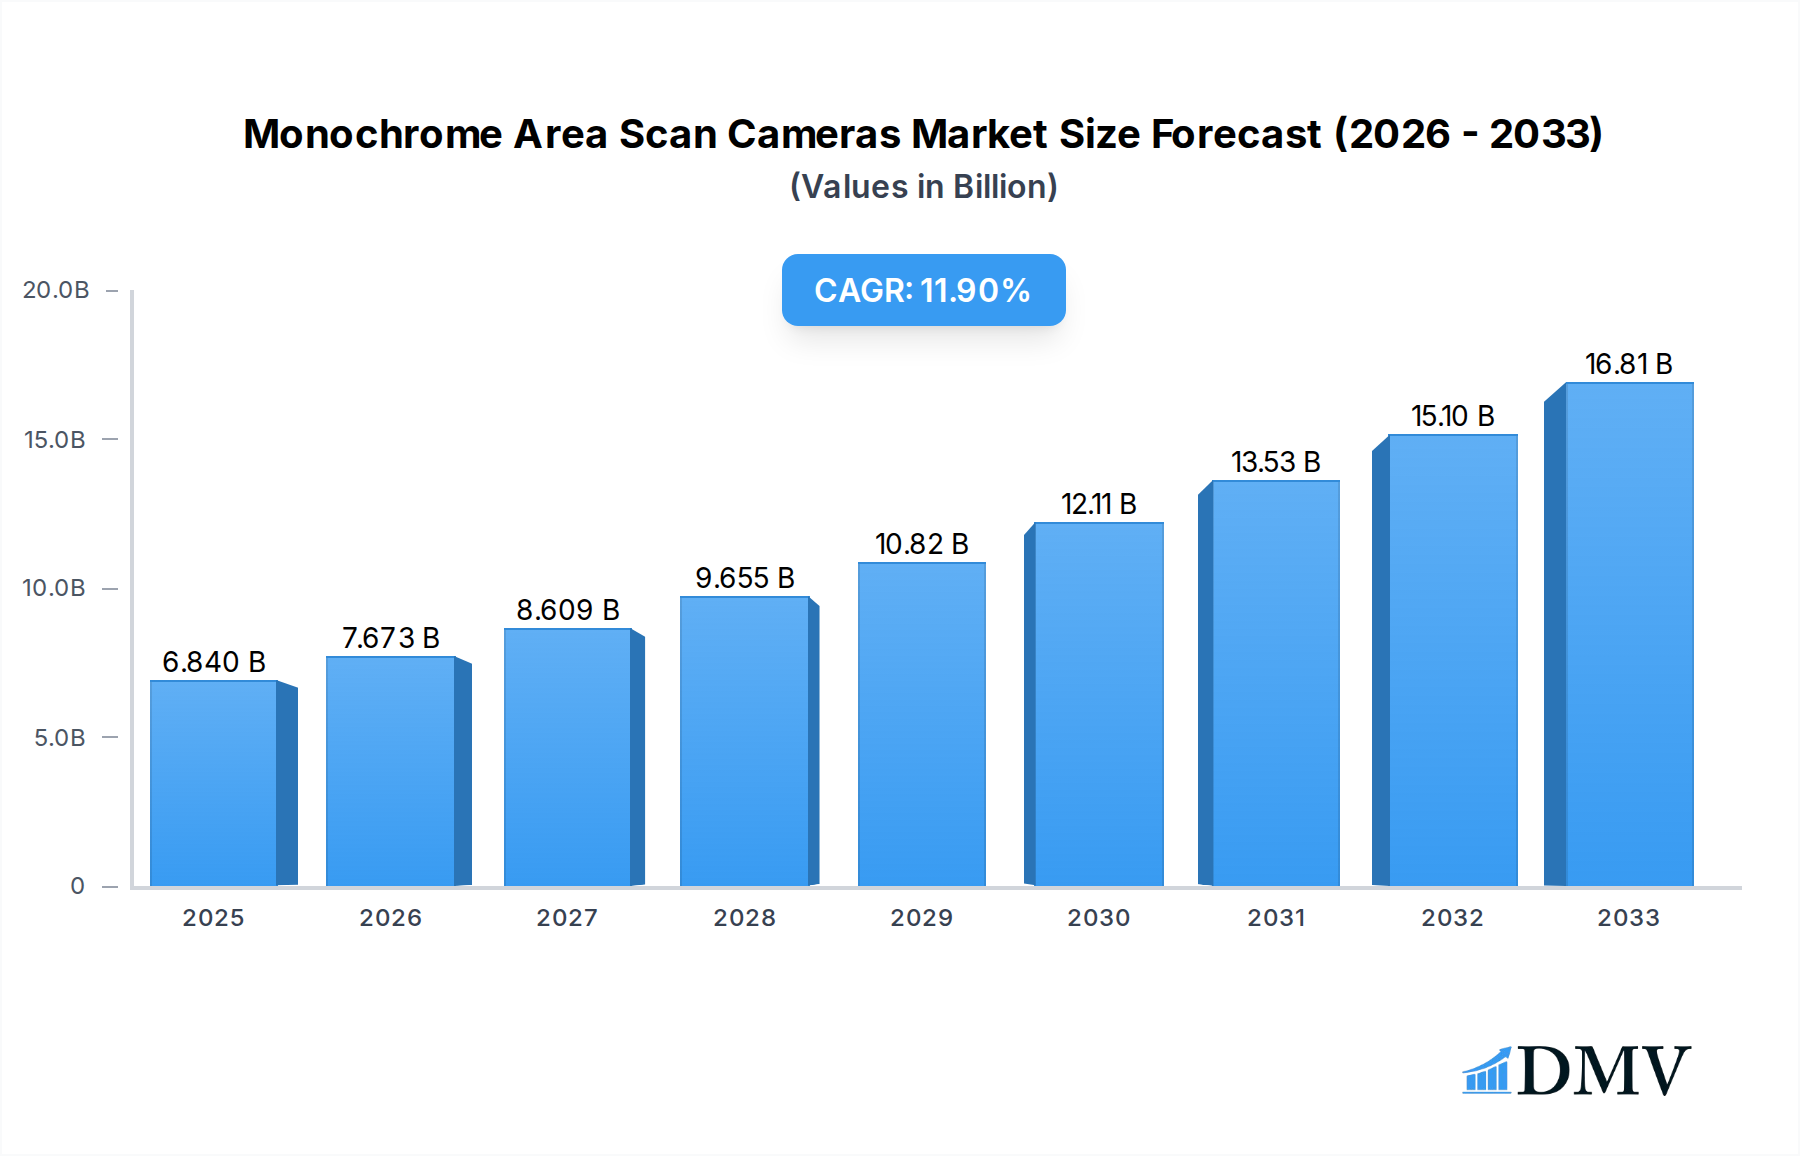
Monochrome Area Scan Cameras Market Size (In Billion)
The competitive arena features prominent established entities including Teledyne DALSA, JAI, and OMRON Corporation, alongside specialized providers such as XIMEA GmbH and Schäfter+Kirchhoff GmbH. These organizations are prioritizing research and development to elevate image quality, processing speeds, and functional capabilities. The market is characterized by intensifying competition centered on price, performance benchmarks, and specialized feature sets. The advent of smaller, agile companies offering tailored, niche solutions further heightens this competitive pressure. Sustained success will be contingent upon the ability of market participants to adeptly harmonize technological innovation with cost-efficiency and deliver bespoke solutions that precisely address the unique requirements of diverse industrial sectors. Future market development will be significantly shaped by the integration of artificial intelligence (AI) and machine learning (ML) within these cameras, enabling more sophisticated image analysis and advanced automation functionalities.

Monochrome Area Scan Cameras Company Market Share
Monochrome Area Scan Cameras Market Report: 2019-2033
This comprehensive report provides a detailed analysis of the global monochrome area scan cameras market, offering invaluable insights for stakeholders across the value chain. The study period covers 2019-2033, with a base year of 2025 and a forecast period extending to 2033. The report projects a market valued at several billion USD by 2033, driven by technological advancements and increasing demand across diverse industries. This in-depth analysis leverages rigorous data and insightful market trends to provide a clear understanding of the current market landscape and future projections.
Monochrome Area Scan Cameras Market Composition & Trends
This section analyzes the market's competitive landscape, innovation drivers, regulatory environment, substitute products, end-user profiles, and mergers & acquisitions (M&A) activities. The global monochrome area scan camera market exhibits a moderately concentrated structure, with key players holding significant market share. Teledyne DALSA, JAI, and XIMEA GmbH collectively accounted for approximately xx% of the market revenue in 2024.
- Market Share Distribution (2024): Teledyne DALSA (xx%), JAI (xx%), XIMEA GmbH (xx%), Others (xx%).
- Innovation Catalysts: Advancements in sensor technology, image processing algorithms, and miniaturization are key drivers.
- Regulatory Landscape: Stringent regulations regarding data privacy and industrial safety influence market dynamics. Compliance costs impact pricing and adoption.
- Substitute Products: While offering distinct advantages, monochrome area scan cameras face competition from other imaging technologies like color cameras and 3D scanners in specific applications.
- End-User Profiles: Major end-users include manufacturing, automotive, healthcare, and security sectors. The manufacturing sector alone accounted for over xx million USD in 2024.
- M&A Activities: The past five years witnessed xx M&A deals, with an aggregate value exceeding xx million USD, indicating consolidation within the market. Significant deals include [mention specific deals if available, otherwise state "significant deals are not publicly disclosed"].
Monochrome Area Scan Cameras Industry Evolution
The monochrome area scan camera market has experienced robust growth throughout the historical period (2019-2024), with a Compound Annual Growth Rate (CAGR) of xx%. This growth is attributed to increasing demand across various applications, coupled with continuous technological advancements. The adoption of high-resolution sensors and faster processing capabilities has broadened the scope of applications, particularly in high-speed inspection and automated manufacturing processes. The market is expected to maintain a healthy CAGR of xx% during the forecast period (2025-2033), reaching an estimated value of xx million USD by 2033. Technological advancements, such as the integration of artificial intelligence (AI) and machine learning (ML) algorithms for enhanced image analysis, are further fueling market expansion. The rising demand for automation across various industries, particularly in sectors like automotive and electronics, is another significant driver of growth. Consumer demand for improved image quality and faster processing speeds also plays a crucial role.
Leading Regions, Countries, or Segments in Monochrome Area Scan Cameras
North America currently dominates the monochrome area scan camera market, driven by strong technological advancements and robust adoption in industrial automation. Asia-Pacific is projected to exhibit significant growth potential in the coming years due to increased investments in manufacturing infrastructure and rising demand for high-precision imaging solutions.
- Key Drivers for North American Dominance:
- High levels of automation across various industries.
- Robust research and development investments in imaging technologies.
- Presence of major industry players.
- Strong regulatory support for industrial automation.
- Key Drivers for Asia-Pacific Growth:
- Rapid industrialization and expansion of manufacturing capacity.
- Increasing investments in advanced technologies like AI and machine learning.
- Government initiatives promoting technological advancement and automation.
Monochrome Area Scan Cameras Product Innovations
Recent advancements have focused on improving resolution, increasing frame rates, enhancing sensitivity, and reducing power consumption. Key innovations include the development of high-dynamic-range (HDR) sensors, improved noise reduction algorithms, and the integration of embedded processing capabilities. These advancements have broadened the application scope of monochrome area scan cameras, expanding their utility in diverse fields, such as medical imaging, scientific research, and industrial inspection. Unique selling propositions include compact size, high-speed image acquisition, and advanced features like programmable gain and exposure control, empowering superior image capture for diverse application needs.
Propelling Factors for Monochrome Area Scan Cameras Growth
Several factors contribute to the growth of this market:
- Technological Advancements: Improvements in sensor technology, image processing, and miniaturization lead to enhanced performance and cost reductions.
- Economic Growth: Increased industrial automation and the rise of smart manufacturing fuel demand for advanced imaging solutions.
- Favorable Regulatory Policies: Government support for industrial automation and technological advancements further boosts market growth.
Obstacles in the Monochrome Area Scan Cameras Market
The market faces challenges such as:
- Supply Chain Disruptions: Global supply chain vulnerabilities can lead to delays and increased costs, impacting market growth. The impact is predicted at xx million USD in lost revenue annually.
- Competitive Pressures: Intense competition among existing and emerging players may lead to price wars and reduced profit margins.
- Regulatory Hurdles: Stringent regulatory standards and compliance requirements can increase operational costs.
Future Opportunities in Monochrome Area Scan Cameras
Emerging opportunities lie in:
- New Applications: Expanding into new sectors like robotics, autonomous vehicles, and advanced surveillance systems.
- Technological Advancements: Development of advanced sensor technologies like 3D and hyperspectral imaging.
- Integration with AI/ML: Integrating artificial intelligence and machine learning algorithms for enhanced image processing.
Major Players in the Monochrome Area Scan Cameras Ecosystem
- Teledyne DALSA
- JAI
- XIMEA GmbH
- MaVis Imaging
- OMRON Corporation
- Schäfter+Kirchhoff GmbH
- Indigo-imaging
Key Developments in Monochrome Area Scan Cameras Industry
- 2022-Q4: Teledyne DALSA launched a new high-resolution monochrome area scan camera.
- 2023-Q1: JAI announced a strategic partnership to expand its market reach in Asia.
- 2023-Q3: XIMEA GmbH released a new camera model with improved low-light performance. [Add further key developments as available]
Strategic Monochrome Area Scan Cameras Market Forecast
The monochrome area scan camera market is poised for continued growth, driven by technological innovations, expanding applications, and increasing demand for high-quality imaging solutions. The forecast period (2025-2033) anticipates substantial growth, with significant opportunities in emerging markets and the integration of AI and ML capabilities. The market's projected value of xx million USD by 2033 signifies immense potential for investors and market participants alike.
Monochrome Area Scan Cameras Segmentation
-
1. Application
- 1.1. Food and Agricultural Products
- 1.2. Semiconductors
- 1.3. Industry
- 1.4. Other
-
2. Type
- 2.1. Single-Sensor
- 2.2. Multi-Sensor
Monochrome Area Scan Cameras Segmentation By Geography
-
1. North America
- 1.1. United States
- 1.2. Canada
- 1.3. Mexico
-
2. South America
- 2.1. Brazil
- 2.2. Argentina
- 2.3. Rest of South America
-
3. Europe
- 3.1. United Kingdom
- 3.2. Germany
- 3.3. France
- 3.4. Italy
- 3.5. Spain
- 3.6. Russia
- 3.7. Benelux
- 3.8. Nordics
- 3.9. Rest of Europe
-
4. Middle East & Africa
- 4.1. Turkey
- 4.2. Israel
- 4.3. GCC
- 4.4. North Africa
- 4.5. South Africa
- 4.6. Rest of Middle East & Africa
-
5. Asia Pacific
- 5.1. China
- 5.2. India
- 5.3. Japan
- 5.4. South Korea
- 5.5. ASEAN
- 5.6. Oceania
- 5.7. Rest of Asia Pacific
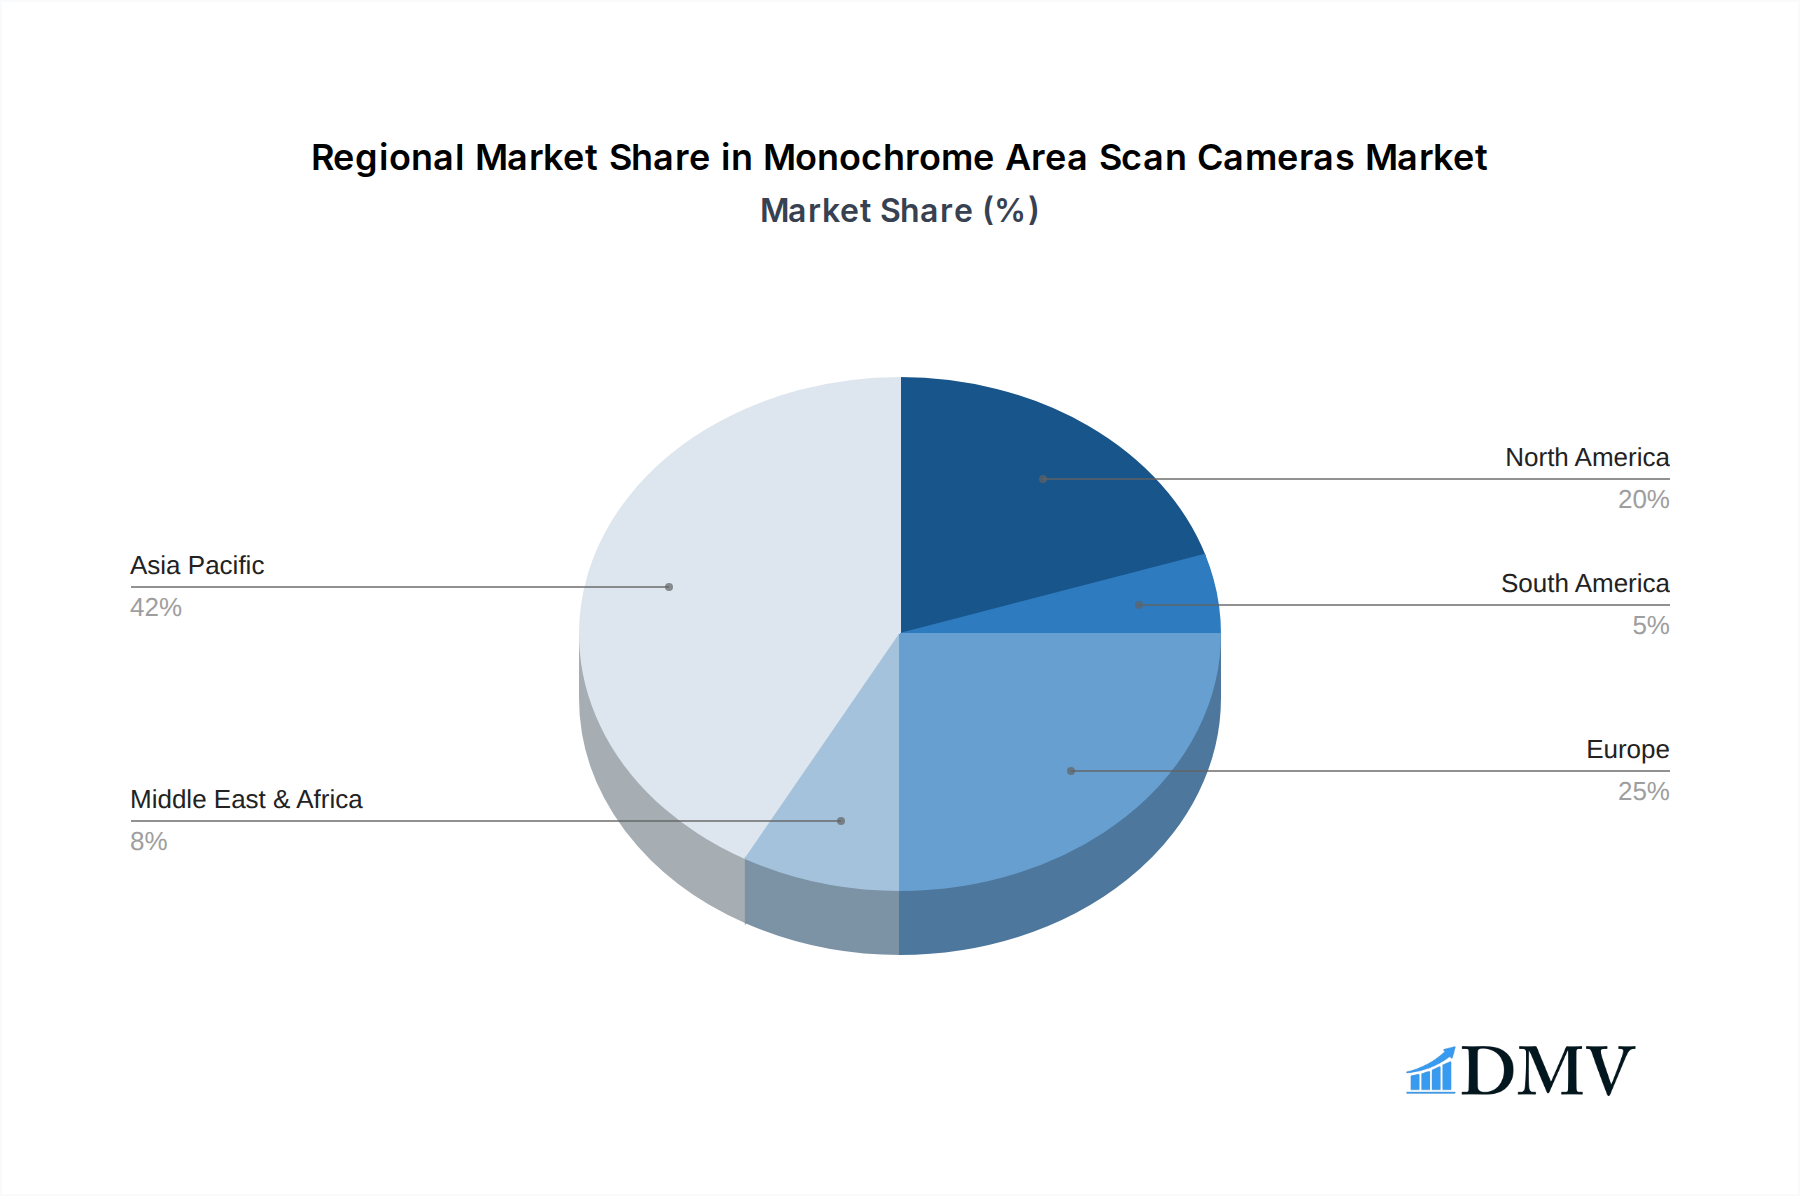
Monochrome Area Scan Cameras Regional Market Share
Geographic Coverage of Monochrome Area Scan Cameras
Monochrome Area Scan Cameras REPORT HIGHLIGHTS
| Aspects | Details |
|---|---|
| Study Period | 2020-2034 |
| Base Year | 2025 |
| Estimated Year | 2026 |
| Forecast Period | 2026-2034 |
| Historical Period | 2020-2025 |
| Growth Rate | CAGR of 12.05% from 2020-2034 |
| Segmentation |
|
Table of Contents
- 1. Introduction
- 1.1. Research Scope
- 1.2. Market Segmentation
- 1.3. Research Objective
- 1.4. Definitions and Assumptions
- 2. Executive Summary
- 2.1. Market Snapshot
- 3. Market Dynamics
- 3.1. Market Drivers
- 3.2. Market Restrains
- 3.3. Market Trends
- 3.4. Market Opportunities
- 4. Market Factor Analysis
- 4.1. Porters Five Forces
- 4.1.1. Bargaining Power of Suppliers
- 4.1.2. Bargaining Power of Buyers
- 4.1.3. Threat of New Entrants
- 4.1.4. Threat of Substitutes
- 4.1.5. Competitive Rivalry
- 4.2. PESTEL analysis
- 4.3. BCG Analysis
- 4.3.1. Stars (High Growth, High Market Share)
- 4.3.2. Cash Cows (Low Growth, High Market Share)
- 4.3.3. Question Mark (High Growth, Low Market Share)
- 4.3.4. Dogs (Low Growth, Low Market Share)
- 4.4. Ansoff Matrix Analysis
- 4.5. Supply Chain Analysis
- 4.6. Regulatory Landscape
- 4.7. Current Market Potential and Opportunity Assessment (TAM–SAM–SOM Framework)
- 4.8. DMV Analyst Note
- 4.1. Porters Five Forces
- 5. Market Analysis, Insights and Forecast 2021-2033
- 5.1. Market Analysis, Insights and Forecast - by Application
- 5.1.1. Food and Agricultural Products
- 5.1.2. Semiconductors
- 5.1.3. Industry
- 5.1.4. Other
- 5.2. Market Analysis, Insights and Forecast - by Type
- 5.2.1. Single-Sensor
- 5.2.2. Multi-Sensor
- 5.3. Market Analysis, Insights and Forecast - by Region
- 5.3.1. North America
- 5.3.2. South America
- 5.3.3. Europe
- 5.3.4. Middle East & Africa
- 5.3.5. Asia Pacific
- 5.1. Market Analysis, Insights and Forecast - by Application
- 6. Global Monochrome Area Scan Cameras Analysis, Insights and Forecast, 2021-2033
- 6.1. Market Analysis, Insights and Forecast - by Application
- 6.1.1. Food and Agricultural Products
- 6.1.2. Semiconductors
- 6.1.3. Industry
- 6.1.4. Other
- 6.2. Market Analysis, Insights and Forecast - by Type
- 6.2.1. Single-Sensor
- 6.2.2. Multi-Sensor
- 6.1. Market Analysis, Insights and Forecast - by Application
- 7. North America Monochrome Area Scan Cameras Analysis, Insights and Forecast, 2020-2032
- 7.1. Market Analysis, Insights and Forecast - by Application
- 7.1.1. Food and Agricultural Products
- 7.1.2. Semiconductors
- 7.1.3. Industry
- 7.1.4. Other
- 7.2. Market Analysis, Insights and Forecast - by Type
- 7.2.1. Single-Sensor
- 7.2.2. Multi-Sensor
- 7.1. Market Analysis, Insights and Forecast - by Application
- 8. South America Monochrome Area Scan Cameras Analysis, Insights and Forecast, 2020-2032
- 8.1. Market Analysis, Insights and Forecast - by Application
- 8.1.1. Food and Agricultural Products
- 8.1.2. Semiconductors
- 8.1.3. Industry
- 8.1.4. Other
- 8.2. Market Analysis, Insights and Forecast - by Type
- 8.2.1. Single-Sensor
- 8.2.2. Multi-Sensor
- 8.1. Market Analysis, Insights and Forecast - by Application
- 9. Europe Monochrome Area Scan Cameras Analysis, Insights and Forecast, 2020-2032
- 9.1. Market Analysis, Insights and Forecast - by Application
- 9.1.1. Food and Agricultural Products
- 9.1.2. Semiconductors
- 9.1.3. Industry
- 9.1.4. Other
- 9.2. Market Analysis, Insights and Forecast - by Type
- 9.2.1. Single-Sensor
- 9.2.2. Multi-Sensor
- 9.1. Market Analysis, Insights and Forecast - by Application
- 10. Middle East & Africa Monochrome Area Scan Cameras Analysis, Insights and Forecast, 2020-2032
- 10.1. Market Analysis, Insights and Forecast - by Application
- 10.1.1. Food and Agricultural Products
- 10.1.2. Semiconductors
- 10.1.3. Industry
- 10.1.4. Other
- 10.2. Market Analysis, Insights and Forecast - by Type
- 10.2.1. Single-Sensor
- 10.2.2. Multi-Sensor
- 10.1. Market Analysis, Insights and Forecast - by Application
- 11. Asia Pacific Monochrome Area Scan Cameras Analysis, Insights and Forecast, 2020-2032
- 11.1. Market Analysis, Insights and Forecast - by Application
- 11.1.1. Food and Agricultural Products
- 11.1.2. Semiconductors
- 11.1.3. Industry
- 11.1.4. Other
- 11.2. Market Analysis, Insights and Forecast - by Type
- 11.2.1. Single-Sensor
- 11.2.2. Multi-Sensor
- 11.1. Market Analysis, Insights and Forecast - by Application
- 12. Competitive Analysis
- 12.1. Company Profiles
- 12.1.1 Teledyne DALSA
- 12.1.1.1. Company Overview
- 12.1.1.2. Products
- 12.1.1.3. Company Financials
- 12.1.1.4. SWOT Analysis
- 12.1.2 JAI
- 12.1.2.1. Company Overview
- 12.1.2.2. Products
- 12.1.2.3. Company Financials
- 12.1.2.4. SWOT Analysis
- 12.1.3 XIMEA GmbH
- 12.1.3.1. Company Overview
- 12.1.3.2. Products
- 12.1.3.3. Company Financials
- 12.1.3.4. SWOT Analysis
- 12.1.4 MaVis Imaging
- 12.1.4.1. Company Overview
- 12.1.4.2. Products
- 12.1.4.3. Company Financials
- 12.1.4.4. SWOT Analysis
- 12.1.5 OMRON Corporation
- 12.1.5.1. Company Overview
- 12.1.5.2. Products
- 12.1.5.3. Company Financials
- 12.1.5.4. SWOT Analysis
- 12.1.6 Schäfter+Kirchhoff GmbH
- 12.1.6.1. Company Overview
- 12.1.6.2. Products
- 12.1.6.3. Company Financials
- 12.1.6.4. SWOT Analysis
- 12.1.7 Indigo-imaging
- 12.1.7.1. Company Overview
- 12.1.7.2. Products
- 12.1.7.3. Company Financials
- 12.1.7.4. SWOT Analysis
- 12.1.1 Teledyne DALSA
- 12.2. Market Entropy
- 12.2.1 Company's Key Areas Served
- 12.2.2 Recent Developments
- 12.3. Company Market Share Analysis 2025
- 12.3.1 Top 5 Companies Market Share Analysis
- 12.3.2 Top 3 Companies Market Share Analysis
- 12.4. List of Potential Customers
- 13. Research Methodology
List of Figures
- Figure 1: Global Monochrome Area Scan Cameras Revenue Breakdown (billion, %) by Region 2025 & 2033
- Figure 2: Global Monochrome Area Scan Cameras Volume Breakdown (K, %) by Region 2025 & 2033
- Figure 3: North America Monochrome Area Scan Cameras Revenue (billion), by Application 2025 & 2033
- Figure 4: North America Monochrome Area Scan Cameras Volume (K), by Application 2025 & 2033
- Figure 5: North America Monochrome Area Scan Cameras Revenue Share (%), by Application 2025 & 2033
- Figure 6: North America Monochrome Area Scan Cameras Volume Share (%), by Application 2025 & 2033
- Figure 7: North America Monochrome Area Scan Cameras Revenue (billion), by Type 2025 & 2033
- Figure 8: North America Monochrome Area Scan Cameras Volume (K), by Type 2025 & 2033
- Figure 9: North America Monochrome Area Scan Cameras Revenue Share (%), by Type 2025 & 2033
- Figure 10: North America Monochrome Area Scan Cameras Volume Share (%), by Type 2025 & 2033
- Figure 11: North America Monochrome Area Scan Cameras Revenue (billion), by Country 2025 & 2033
- Figure 12: North America Monochrome Area Scan Cameras Volume (K), by Country 2025 & 2033
- Figure 13: North America Monochrome Area Scan Cameras Revenue Share (%), by Country 2025 & 2033
- Figure 14: North America Monochrome Area Scan Cameras Volume Share (%), by Country 2025 & 2033
- Figure 15: South America Monochrome Area Scan Cameras Revenue (billion), by Application 2025 & 2033
- Figure 16: South America Monochrome Area Scan Cameras Volume (K), by Application 2025 & 2033
- Figure 17: South America Monochrome Area Scan Cameras Revenue Share (%), by Application 2025 & 2033
- Figure 18: South America Monochrome Area Scan Cameras Volume Share (%), by Application 2025 & 2033
- Figure 19: South America Monochrome Area Scan Cameras Revenue (billion), by Type 2025 & 2033
- Figure 20: South America Monochrome Area Scan Cameras Volume (K), by Type 2025 & 2033
- Figure 21: South America Monochrome Area Scan Cameras Revenue Share (%), by Type 2025 & 2033
- Figure 22: South America Monochrome Area Scan Cameras Volume Share (%), by Type 2025 & 2033
- Figure 23: South America Monochrome Area Scan Cameras Revenue (billion), by Country 2025 & 2033
- Figure 24: South America Monochrome Area Scan Cameras Volume (K), by Country 2025 & 2033
- Figure 25: South America Monochrome Area Scan Cameras Revenue Share (%), by Country 2025 & 2033
- Figure 26: South America Monochrome Area Scan Cameras Volume Share (%), by Country 2025 & 2033
- Figure 27: Europe Monochrome Area Scan Cameras Revenue (billion), by Application 2025 & 2033
- Figure 28: Europe Monochrome Area Scan Cameras Volume (K), by Application 2025 & 2033
- Figure 29: Europe Monochrome Area Scan Cameras Revenue Share (%), by Application 2025 & 2033
- Figure 30: Europe Monochrome Area Scan Cameras Volume Share (%), by Application 2025 & 2033
- Figure 31: Europe Monochrome Area Scan Cameras Revenue (billion), by Type 2025 & 2033
- Figure 32: Europe Monochrome Area Scan Cameras Volume (K), by Type 2025 & 2033
- Figure 33: Europe Monochrome Area Scan Cameras Revenue Share (%), by Type 2025 & 2033
- Figure 34: Europe Monochrome Area Scan Cameras Volume Share (%), by Type 2025 & 2033
- Figure 35: Europe Monochrome Area Scan Cameras Revenue (billion), by Country 2025 & 2033
- Figure 36: Europe Monochrome Area Scan Cameras Volume (K), by Country 2025 & 2033
- Figure 37: Europe Monochrome Area Scan Cameras Revenue Share (%), by Country 2025 & 2033
- Figure 38: Europe Monochrome Area Scan Cameras Volume Share (%), by Country 2025 & 2033
- Figure 39: Middle East & Africa Monochrome Area Scan Cameras Revenue (billion), by Application 2025 & 2033
- Figure 40: Middle East & Africa Monochrome Area Scan Cameras Volume (K), by Application 2025 & 2033
- Figure 41: Middle East & Africa Monochrome Area Scan Cameras Revenue Share (%), by Application 2025 & 2033
- Figure 42: Middle East & Africa Monochrome Area Scan Cameras Volume Share (%), by Application 2025 & 2033
- Figure 43: Middle East & Africa Monochrome Area Scan Cameras Revenue (billion), by Type 2025 & 2033
- Figure 44: Middle East & Africa Monochrome Area Scan Cameras Volume (K), by Type 2025 & 2033
- Figure 45: Middle East & Africa Monochrome Area Scan Cameras Revenue Share (%), by Type 2025 & 2033
- Figure 46: Middle East & Africa Monochrome Area Scan Cameras Volume Share (%), by Type 2025 & 2033
- Figure 47: Middle East & Africa Monochrome Area Scan Cameras Revenue (billion), by Country 2025 & 2033
- Figure 48: Middle East & Africa Monochrome Area Scan Cameras Volume (K), by Country 2025 & 2033
- Figure 49: Middle East & Africa Monochrome Area Scan Cameras Revenue Share (%), by Country 2025 & 2033
- Figure 50: Middle East & Africa Monochrome Area Scan Cameras Volume Share (%), by Country 2025 & 2033
- Figure 51: Asia Pacific Monochrome Area Scan Cameras Revenue (billion), by Application 2025 & 2033
- Figure 52: Asia Pacific Monochrome Area Scan Cameras Volume (K), by Application 2025 & 2033
- Figure 53: Asia Pacific Monochrome Area Scan Cameras Revenue Share (%), by Application 2025 & 2033
- Figure 54: Asia Pacific Monochrome Area Scan Cameras Volume Share (%), by Application 2025 & 2033
- Figure 55: Asia Pacific Monochrome Area Scan Cameras Revenue (billion), by Type 2025 & 2033
- Figure 56: Asia Pacific Monochrome Area Scan Cameras Volume (K), by Type 2025 & 2033
- Figure 57: Asia Pacific Monochrome Area Scan Cameras Revenue Share (%), by Type 2025 & 2033
- Figure 58: Asia Pacific Monochrome Area Scan Cameras Volume Share (%), by Type 2025 & 2033
- Figure 59: Asia Pacific Monochrome Area Scan Cameras Revenue (billion), by Country 2025 & 2033
- Figure 60: Asia Pacific Monochrome Area Scan Cameras Volume (K), by Country 2025 & 2033
- Figure 61: Asia Pacific Monochrome Area Scan Cameras Revenue Share (%), by Country 2025 & 2033
- Figure 62: Asia Pacific Monochrome Area Scan Cameras Volume Share (%), by Country 2025 & 2033
List of Tables
- Table 1: Global Monochrome Area Scan Cameras Revenue billion Forecast, by Application 2020 & 2033
- Table 2: Global Monochrome Area Scan Cameras Volume K Forecast, by Application 2020 & 2033
- Table 3: Global Monochrome Area Scan Cameras Revenue billion Forecast, by Type 2020 & 2033
- Table 4: Global Monochrome Area Scan Cameras Volume K Forecast, by Type 2020 & 2033
- Table 5: Global Monochrome Area Scan Cameras Revenue billion Forecast, by Region 2020 & 2033
- Table 6: Global Monochrome Area Scan Cameras Volume K Forecast, by Region 2020 & 2033
- Table 7: Global Monochrome Area Scan Cameras Revenue billion Forecast, by Application 2020 & 2033
- Table 8: Global Monochrome Area Scan Cameras Volume K Forecast, by Application 2020 & 2033
- Table 9: Global Monochrome Area Scan Cameras Revenue billion Forecast, by Type 2020 & 2033
- Table 10: Global Monochrome Area Scan Cameras Volume K Forecast, by Type 2020 & 2033
- Table 11: Global Monochrome Area Scan Cameras Revenue billion Forecast, by Country 2020 & 2033
- Table 12: Global Monochrome Area Scan Cameras Volume K Forecast, by Country 2020 & 2033
- Table 13: United States Monochrome Area Scan Cameras Revenue (billion) Forecast, by Application 2020 & 2033
- Table 14: United States Monochrome Area Scan Cameras Volume (K) Forecast, by Application 2020 & 2033
- Table 15: Canada Monochrome Area Scan Cameras Revenue (billion) Forecast, by Application 2020 & 2033
- Table 16: Canada Monochrome Area Scan Cameras Volume (K) Forecast, by Application 2020 & 2033
- Table 17: Mexico Monochrome Area Scan Cameras Revenue (billion) Forecast, by Application 2020 & 2033
- Table 18: Mexico Monochrome Area Scan Cameras Volume (K) Forecast, by Application 2020 & 2033
- Table 19: Global Monochrome Area Scan Cameras Revenue billion Forecast, by Application 2020 & 2033
- Table 20: Global Monochrome Area Scan Cameras Volume K Forecast, by Application 2020 & 2033
- Table 21: Global Monochrome Area Scan Cameras Revenue billion Forecast, by Type 2020 & 2033
- Table 22: Global Monochrome Area Scan Cameras Volume K Forecast, by Type 2020 & 2033
- Table 23: Global Monochrome Area Scan Cameras Revenue billion Forecast, by Country 2020 & 2033
- Table 24: Global Monochrome Area Scan Cameras Volume K Forecast, by Country 2020 & 2033
- Table 25: Brazil Monochrome Area Scan Cameras Revenue (billion) Forecast, by Application 2020 & 2033
- Table 26: Brazil Monochrome Area Scan Cameras Volume (K) Forecast, by Application 2020 & 2033
- Table 27: Argentina Monochrome Area Scan Cameras Revenue (billion) Forecast, by Application 2020 & 2033
- Table 28: Argentina Monochrome Area Scan Cameras Volume (K) Forecast, by Application 2020 & 2033
- Table 29: Rest of South America Monochrome Area Scan Cameras Revenue (billion) Forecast, by Application 2020 & 2033
- Table 30: Rest of South America Monochrome Area Scan Cameras Volume (K) Forecast, by Application 2020 & 2033
- Table 31: Global Monochrome Area Scan Cameras Revenue billion Forecast, by Application 2020 & 2033
- Table 32: Global Monochrome Area Scan Cameras Volume K Forecast, by Application 2020 & 2033
- Table 33: Global Monochrome Area Scan Cameras Revenue billion Forecast, by Type 2020 & 2033
- Table 34: Global Monochrome Area Scan Cameras Volume K Forecast, by Type 2020 & 2033
- Table 35: Global Monochrome Area Scan Cameras Revenue billion Forecast, by Country 2020 & 2033
- Table 36: Global Monochrome Area Scan Cameras Volume K Forecast, by Country 2020 & 2033
- Table 37: United Kingdom Monochrome Area Scan Cameras Revenue (billion) Forecast, by Application 2020 & 2033
- Table 38: United Kingdom Monochrome Area Scan Cameras Volume (K) Forecast, by Application 2020 & 2033
- Table 39: Germany Monochrome Area Scan Cameras Revenue (billion) Forecast, by Application 2020 & 2033
- Table 40: Germany Monochrome Area Scan Cameras Volume (K) Forecast, by Application 2020 & 2033
- Table 41: France Monochrome Area Scan Cameras Revenue (billion) Forecast, by Application 2020 & 2033
- Table 42: France Monochrome Area Scan Cameras Volume (K) Forecast, by Application 2020 & 2033
- Table 43: Italy Monochrome Area Scan Cameras Revenue (billion) Forecast, by Application 2020 & 2033
- Table 44: Italy Monochrome Area Scan Cameras Volume (K) Forecast, by Application 2020 & 2033
- Table 45: Spain Monochrome Area Scan Cameras Revenue (billion) Forecast, by Application 2020 & 2033
- Table 46: Spain Monochrome Area Scan Cameras Volume (K) Forecast, by Application 2020 & 2033
- Table 47: Russia Monochrome Area Scan Cameras Revenue (billion) Forecast, by Application 2020 & 2033
- Table 48: Russia Monochrome Area Scan Cameras Volume (K) Forecast, by Application 2020 & 2033
- Table 49: Benelux Monochrome Area Scan Cameras Revenue (billion) Forecast, by Application 2020 & 2033
- Table 50: Benelux Monochrome Area Scan Cameras Volume (K) Forecast, by Application 2020 & 2033
- Table 51: Nordics Monochrome Area Scan Cameras Revenue (billion) Forecast, by Application 2020 & 2033
- Table 52: Nordics Monochrome Area Scan Cameras Volume (K) Forecast, by Application 2020 & 2033
- Table 53: Rest of Europe Monochrome Area Scan Cameras Revenue (billion) Forecast, by Application 2020 & 2033
- Table 54: Rest of Europe Monochrome Area Scan Cameras Volume (K) Forecast, by Application 2020 & 2033
- Table 55: Global Monochrome Area Scan Cameras Revenue billion Forecast, by Application 2020 & 2033
- Table 56: Global Monochrome Area Scan Cameras Volume K Forecast, by Application 2020 & 2033
- Table 57: Global Monochrome Area Scan Cameras Revenue billion Forecast, by Type 2020 & 2033
- Table 58: Global Monochrome Area Scan Cameras Volume K Forecast, by Type 2020 & 2033
- Table 59: Global Monochrome Area Scan Cameras Revenue billion Forecast, by Country 2020 & 2033
- Table 60: Global Monochrome Area Scan Cameras Volume K Forecast, by Country 2020 & 2033
- Table 61: Turkey Monochrome Area Scan Cameras Revenue (billion) Forecast, by Application 2020 & 2033
- Table 62: Turkey Monochrome Area Scan Cameras Volume (K) Forecast, by Application 2020 & 2033
- Table 63: Israel Monochrome Area Scan Cameras Revenue (billion) Forecast, by Application 2020 & 2033
- Table 64: Israel Monochrome Area Scan Cameras Volume (K) Forecast, by Application 2020 & 2033
- Table 65: GCC Monochrome Area Scan Cameras Revenue (billion) Forecast, by Application 2020 & 2033
- Table 66: GCC Monochrome Area Scan Cameras Volume (K) Forecast, by Application 2020 & 2033
- Table 67: North Africa Monochrome Area Scan Cameras Revenue (billion) Forecast, by Application 2020 & 2033
- Table 68: North Africa Monochrome Area Scan Cameras Volume (K) Forecast, by Application 2020 & 2033
- Table 69: South Africa Monochrome Area Scan Cameras Revenue (billion) Forecast, by Application 2020 & 2033
- Table 70: South Africa Monochrome Area Scan Cameras Volume (K) Forecast, by Application 2020 & 2033
- Table 71: Rest of Middle East & Africa Monochrome Area Scan Cameras Revenue (billion) Forecast, by Application 2020 & 2033
- Table 72: Rest of Middle East & Africa Monochrome Area Scan Cameras Volume (K) Forecast, by Application 2020 & 2033
- Table 73: Global Monochrome Area Scan Cameras Revenue billion Forecast, by Application 2020 & 2033
- Table 74: Global Monochrome Area Scan Cameras Volume K Forecast, by Application 2020 & 2033
- Table 75: Global Monochrome Area Scan Cameras Revenue billion Forecast, by Type 2020 & 2033
- Table 76: Global Monochrome Area Scan Cameras Volume K Forecast, by Type 2020 & 2033
- Table 77: Global Monochrome Area Scan Cameras Revenue billion Forecast, by Country 2020 & 2033
- Table 78: Global Monochrome Area Scan Cameras Volume K Forecast, by Country 2020 & 2033
- Table 79: China Monochrome Area Scan Cameras Revenue (billion) Forecast, by Application 2020 & 2033
- Table 80: China Monochrome Area Scan Cameras Volume (K) Forecast, by Application 2020 & 2033
- Table 81: India Monochrome Area Scan Cameras Revenue (billion) Forecast, by Application 2020 & 2033
- Table 82: India Monochrome Area Scan Cameras Volume (K) Forecast, by Application 2020 & 2033
- Table 83: Japan Monochrome Area Scan Cameras Revenue (billion) Forecast, by Application 2020 & 2033
- Table 84: Japan Monochrome Area Scan Cameras Volume (K) Forecast, by Application 2020 & 2033
- Table 85: South Korea Monochrome Area Scan Cameras Revenue (billion) Forecast, by Application 2020 & 2033
- Table 86: South Korea Monochrome Area Scan Cameras Volume (K) Forecast, by Application 2020 & 2033
- Table 87: ASEAN Monochrome Area Scan Cameras Revenue (billion) Forecast, by Application 2020 & 2033
- Table 88: ASEAN Monochrome Area Scan Cameras Volume (K) Forecast, by Application 2020 & 2033
- Table 89: Oceania Monochrome Area Scan Cameras Revenue (billion) Forecast, by Application 2020 & 2033
- Table 90: Oceania Monochrome Area Scan Cameras Volume (K) Forecast, by Application 2020 & 2033
- Table 91: Rest of Asia Pacific Monochrome Area Scan Cameras Revenue (billion) Forecast, by Application 2020 & 2033
- Table 92: Rest of Asia Pacific Monochrome Area Scan Cameras Volume (K) Forecast, by Application 2020 & 2033
Frequently Asked Questions
1. What is the projected Compound Annual Growth Rate (CAGR) of the Monochrome Area Scan Cameras?
The projected CAGR is approximately 12.05%.
2. Which companies are prominent players in the Monochrome Area Scan Cameras?
Key companies in the market include Teledyne DALSA, JAI, XIMEA GmbH, MaVis Imaging, OMRON Corporation, Schäfter+Kirchhoff GmbH, Indigo-imaging.
3. What are the main segments of the Monochrome Area Scan Cameras?
The market segments include Application, Type.
4. Can you provide details about the market size?
The market size is estimated to be USD 6.84 billion as of 2022.
5. What are some drivers contributing to market growth?
N/A
6. What are the notable trends driving market growth?
N/A
7. Are there any restraints impacting market growth?
N/A
8. Can you provide examples of recent developments in the market?
N/A
9. What pricing options are available for accessing the report?
Pricing options include single-user, multi-user, and enterprise licenses priced at USD 3950.00, USD 5925.00, and USD 7900.00 respectively.
10. Is the market size provided in terms of value or volume?
The market size is provided in terms of value, measured in billion and volume, measured in K.
11. Are there any specific market keywords associated with the report?
Yes, the market keyword associated with the report is "Monochrome Area Scan Cameras," which aids in identifying and referencing the specific market segment covered.
12. How do I determine which pricing option suits my needs best?
The pricing options vary based on user requirements and access needs. Individual users may opt for single-user licenses, while businesses requiring broader access may choose multi-user or enterprise licenses for cost-effective access to the report.
13. Are there any additional resources or data provided in the Monochrome Area Scan Cameras report?
While the report offers comprehensive insights, it's advisable to review the specific contents or supplementary materials provided to ascertain if additional resources or data are available.
14. How can I stay updated on further developments or reports in the Monochrome Area Scan Cameras?
To stay informed about further developments, trends, and reports in the Monochrome Area Scan Cameras, consider subscribing to industry newsletters, following relevant companies and organizations, or regularly checking reputable industry news sources and publications.
Methodology
Step 1 - Identification of Relevant Samples Size from Population Database


Step 2 - Approaches for Defining Global Market Size (Value, Volume* & Price*)

Note*: In applicable scenarios
Step 3 - Data Sources
Primary Research
- Web Analytics
- Survey Reports
- Research Institute
- Latest Research Reports
- Opinion Leaders
Secondary Research
- Annual Reports
- White Paper
- Latest Press Release
- Industry Association
- Paid Database
- Investor Presentations

Step 4 - Data Triangulation
Involves using different sources of information in order to increase the validity of a study
These sources are likely to be stakeholders in a program - participants, other researchers, program staff, other community members, and so on.
Then we put all data in single framework & apply various statistical tools to find out the dynamic on the market.
During the analysis stage, feedback from the stakeholder groups would be compared to determine areas of agreement as well as areas of divergence