

Key Insights
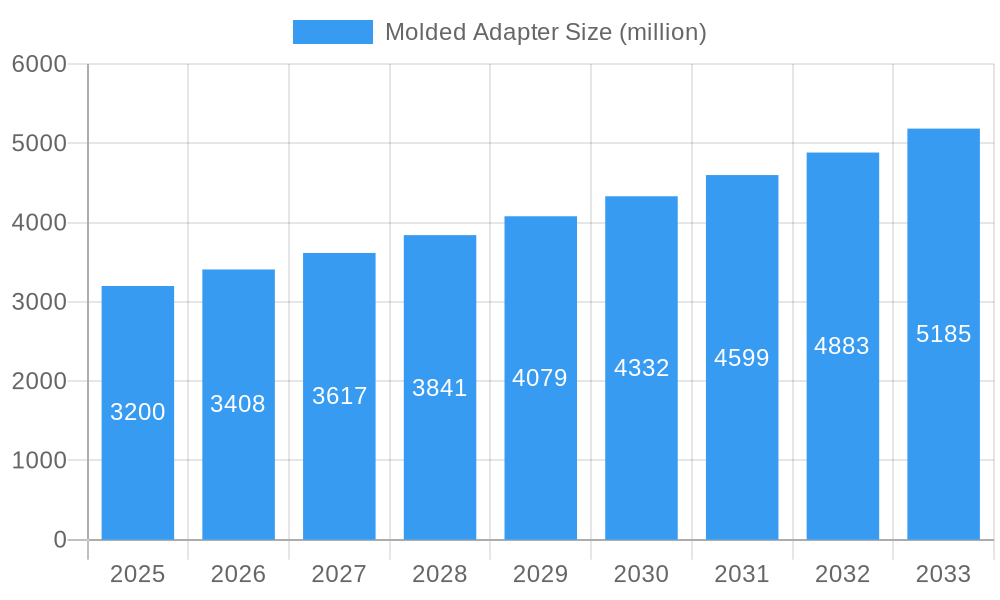
The global molded adapter market is projected for significant expansion, expected to reach approximately $3.2 billion by 2025, with a robust CAGR of 6.5%. This growth is propelled by increasing demand for sophisticated electronics in automotive, consumer, and new energy sectors. Advanced automotive features like infotainment and driver-assistance systems, alongside the proliferation of smart home devices and wearable technology, are key drivers. The new energy sector, including electric vehicles and renewable infrastructure, also presents substantial opportunities for high-performance adapter solutions.
Molded Adapter Market Size (In Billion)
Key market trends include a growing preference for miniaturized and customized adapters, alongside innovations in materials science leading to more durable, heat-resistant, and eco-friendly solutions. While regulatory compliance and raw material price volatility pose challenges, the market offers promising growth prospects. The market is segmented by application, with Automotive Electronics and Consumer Electronics anticipated as leading segments. Multi-line adapters (4, 5, and 6 lines) are gaining traction due to increasing electronic system complexity. Asia Pacific is expected to lead the market, fueled by its strong manufacturing base and rapid technological adoption.
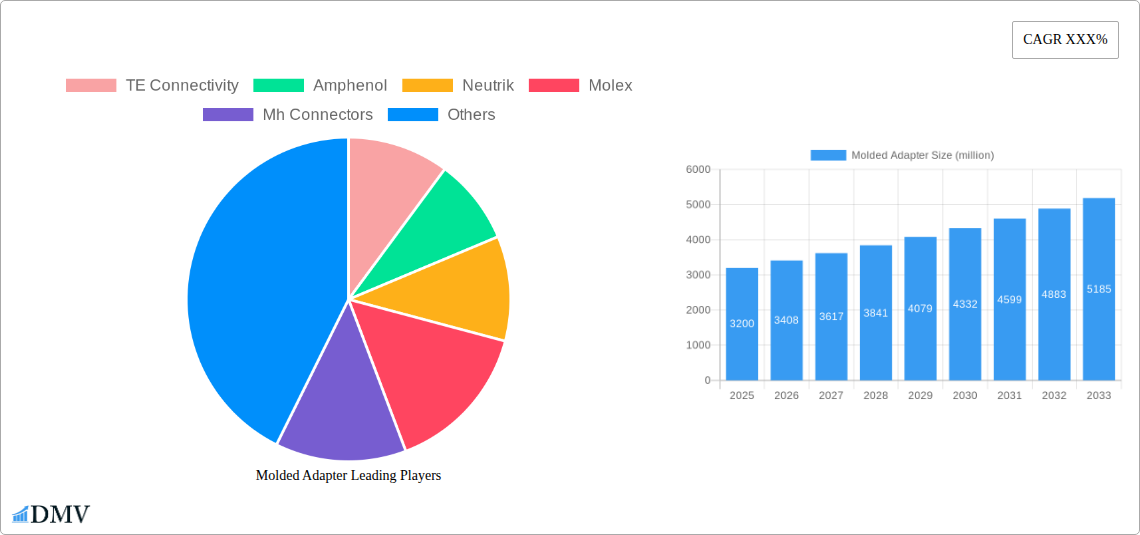
Molded Adapter Company Market Share
The global molded adapter market exhibits a dynamic competitive landscape driven by continuous innovation and evolving end-user demands. Market concentration varies across segments, with key players like TE Connectivity, Amphenol, and Molex holding significant influence in high-growth application areas such as Automotive Electronics and Consumer Electronics. Advancements in material science, miniaturization technologies, and the need for robust connectivity solutions in harsh environments are key innovation catalysts. Regulatory landscapes, particularly concerning safety and environmental compliance, are crucial factors shaping product development. Substitute products are generally outcompeted by the superior performance, durability, and cost-effectiveness of molded adapters. End-user profiles are diverse, including Automotive Electronics manufacturers, Home Appliance companies, and the rapidly expanding New Energy Industry. Mergers and acquisitions (M&A) are strategically important for market consolidation and technology acquisition, with an estimated M&A deal value in the range of $500 million to $1 billion during the study period. The market share distribution for the top five players is estimated to be around 60% to 70%.
Molded Adapter Industry Evolution
The molded adapter industry has witnessed a robust and steady growth trajectory over the historical period of 2019–2024, driven by an accelerating demand for interconnected devices and increasingly complex electronic systems. The market is projected to continue this upward trend, with an estimated Compound Annual Growth Rate (CAGR) of 8.5% for the forecast period of 2025–2033. This sustained expansion is underpinned by significant technological advancements, including the development of advanced over-molding techniques that enhance durability, environmental resistance (IP ratings up to IP68), and electrical performance. The adoption of high-performance polymers and specialized thermoplastic elastomers allows for greater design flexibility and improved thermal management, crucial for demanding applications.
Consumer demand has been a powerful catalyst, with an insatiable appetite for smart devices, electric vehicles, and sophisticated home automation systems. These sectors inherently require reliable, compact, and cost-effective interconnect solutions. The shift towards miniaturization in consumer electronics, for instance, necessitates smaller and more efficient molded adapters. In the automotive sector, the proliferation of advanced driver-assistance systems (ADAS), in-car infotainment, and the burgeoning electric vehicle (EV) market are creating unprecedented demand for high-reliability molded adapters capable of withstanding vibrations, temperature extremes, and exposure to fluids.
Furthermore, the New Energy Industry, encompassing solar power generation, energy storage, and wind turbines, relies heavily on robust molded adapters for efficient and safe power transmission and distribution. The industry's growth is directly correlated with the global push for renewable energy sources. Similarly, the Automation Control Industry, vital for smart manufacturing and industrial IoT (IIoT), is increasingly adopting integrated and sealed molded adapter solutions to ensure uninterrupted operation in challenging industrial environments. The estimated adoption rate of advanced molded adapters in these key segments is projected to reach 75% by 2033. The base year of 2025 marks a pivotal point where several emerging technologies are expected to gain significant traction, further accelerating market growth.
Leading Regions, Countries, or Segments in Molded Adapter
The Asia Pacific region stands out as the dominant force in the molded adapter market, driven by its robust manufacturing base, rapid industrialization, and burgeoning consumer electronics sector. Countries like China, Japan, and South Korea are not only major consumers but also significant producers of molded adapters, catering to both domestic demand and global export markets. The Automotive Electronics segment within this region is experiencing exponential growth, propelled by the massive production volumes of passenger vehicles and the increasing integration of advanced electronics.
Key Drivers for Asia Pacific's Dominance:
- Manufacturing Hub: Asia Pacific hosts a significant concentration of electronics manufacturing, leading to high demand for interconnect components like molded adapters.
- Cost-Effectiveness: The region offers competitive manufacturing costs, making it an attractive location for global OEMs to source their adapter needs.
- Government Initiatives: Supportive government policies and investments in advanced manufacturing and new energy sectors further bolster the demand. For instance, China's strong push for electric vehicles and renewable energy infrastructure directly fuels the need for specialized molded adapters.
- Consumer Electronics Boom: The region's vast population and rising disposable incomes drive the demand for consumer electronics, a key application area for molded adapters.
Within the Application breakdown, Automotive Electronics is projected to be the largest and fastest-growing segment, with an estimated market share exceeding 30% by 2033. This is directly attributed to the electrification of vehicles, the integration of sophisticated infotainment systems, and the need for durable connectors in harsh automotive environments. The New Energy Industry follows closely, fueled by global commitments to renewable energy sources and the expansion of charging infrastructure.
In terms of Type, 4 Lines and 6 Lines molded adapters are experiencing substantial growth due to their versatility in handling multiple data and power signals required by modern electronic devices and automotive systems. The demand for higher pin counts addresses the increasing complexity of integrated circuits and the need for consolidated connectivity solutions. The Consumer Electronics segment, while mature in some aspects, continues to innovate, demanding compact and reliable adapters for a wide array of devices, from smartphones to smart home appliances. The combined market share for Automotive Electronics and Consumer Electronics is expected to represent over 55% of the total market by 2033.
Molded Adapter Product Innovations
Molded adapters are at the forefront of innovation, offering enhanced performance and reliability across diverse applications. Key product advancements include the development of high-density, multi-pin connectors that enable miniaturization and space savings, crucial for segments like Consumer Electronics and Automotive Electronics. Innovations in material science have led to the creation of specialized over-molding compounds that provide superior resistance to extreme temperatures (ranging from -40°C to +150°C), chemicals, and physical stress, thereby increasing the lifespan and operational integrity of the adapters. Furthermore, the integration of advanced sealing technologies (IP67 and IP69K ratings) ensures robust protection against dust and water ingress, a critical requirement for the New Energy Industry and Automation Control Industry. The focus on high-speed data transmission capabilities, supporting USB4 and other next-generation protocols, is also a significant trend, directly impacting the performance metrics of molded adapters in communication-intensive applications.
Propelling Factors for Molded Adapter Growth
The molded adapter market is propelled by several key growth drivers. The escalating adoption of electric vehicles (EVs) and hybrid electric vehicles (HEVs) necessitates a significant increase in the demand for high-voltage and high-current molded adapters for battery management systems, charging ports, and power distribution units. The ongoing digitalization and automation across industries, particularly in manufacturing and industrial control (Automation Control Industry), are fueling the need for robust, reliable, and sealed connectors. Furthermore, the burgeoning demand for smart home devices and interconnected consumer electronics, including wearables and IoT devices, requires compact, cost-effective, and aesthetically pleasing molded adapter solutions. Technological advancements in over-molding processes and material science enable the development of more durable, versatile, and high-performance adapters, catering to increasingly stringent application requirements.
Obstacles in the Molded Adapter Market
Despite robust growth, the molded adapter market faces several obstacles. Intense price competition, particularly from manufacturers in lower-cost regions, can put pressure on profit margins for established players. Supply chain disruptions, exacerbated by geopolitical events and raw material price volatility, can impact production timelines and costs. Stringent and evolving regulatory requirements, especially concerning environmental compliance and product safety standards across different regions, necessitate continuous investment in research and development and compliance testing, adding to operational expenses. Furthermore, the emergence of alternative connection technologies or direct integration methods in some applications can pose a threat, although molded adapters generally offer a superior balance of cost and performance for many established use cases.
Future Opportunities in Molded Adapter
The future for molded adapters presents substantial opportunities. The continued global expansion of the New Energy Industry, including solar, wind, and energy storage solutions, will drive demand for high-reliability, high-power adapters. The ongoing advancements in autonomous driving and the increasing complexity of automotive electronics will create a persistent need for specialized, robust molded connectors. The proliferation of 5G technology and the expansion of the Internet of Things (IoT) ecosystem will spur innovation in high-speed data transmission and miniaturized molded adapters. Emerging markets in developing economies, with their growing industrial sectors and increasing consumer spending power, offer significant untapped potential for market penetration.
Major Players in the Molded Adapter Ecosystem
- TE Connectivity
- Amphenol
- Neutrik
- Molex
- MH Connectors
- Phoenix Contact
- Stewart Connector
- Switchcraft
- Hubbell Wiring Devices
- Cliff Electronic Components
- TUK
- Bulgin Limited
- Cinch Connectivity
- Belden
- Black Box
- GC Electronics
- Grace Technologies
- Harting
- Hylec
- MCM
- METZ CONNECT
- Panduit
- Roline
- Videk
- Weidmuller
Key Developments in Molded Adapter Industry
- January 2024: TE Connectivity launched a new series of high-performance molded connectors for the automotive industry, enhancing thermal management capabilities.
- November 2023: Amphenol introduced a compact, high-density molded adapter designed for 5G infrastructure applications, supporting increased data transfer rates.
- July 2023: Molex showcased its latest innovations in over-molding technology for consumer electronics, focusing on increased durability and IP ratings.
- April 2023: Phoenix Contact expanded its portfolio with environmentally sealed molded adapters for renewable energy applications, improving operational safety.
- February 2023: Neutrik announced a strategic partnership to develop advanced molded interconnect solutions for the burgeoning electric vehicle market.
- September 2022: MH Connectors acquired a specialized over-molding company, expanding its capabilities in custom adapter solutions.
- March 2022: Stewart Connector unveiled a new range of rugged molded adapters designed for demanding industrial automation environments.
- December 2021: Switchcraft launched a series of ultra-compact molded adapters for wearable technology and portable consumer devices.
- August 2021: Hubbell Wiring Devices introduced a new line of weather-resistant molded adapters for outdoor applications.
- May 2021: Bulgin Limited acquired a competitor, strengthening its position in the industrial and harsh environment connector market.
Strategic Molded Adapter Market Forecast
The strategic molded adapter market forecast indicates a period of sustained and robust growth, driven by the indispensable role these components play in an increasingly electrified and interconnected world. The accelerating transition towards new energy solutions, from electric vehicles to renewable power generation, will be a primary growth catalyst, demanding high-performance and reliable molded adapters. Concurrently, the relentless pace of innovation in consumer electronics and the widespread adoption of smart technologies will fuel demand for compact, versatile, and cost-effective solutions. Furthermore, the ongoing industrial automation and the expansion of Industry 4.0 initiatives will create a strong, consistent demand for ruggedized and high-reliability molded adapters. Strategic investments in advanced material science and manufacturing processes will enable players to offer differentiated products, meeting evolving application-specific needs and capturing significant market share. The market is poised for continued expansion, with an estimated market size reaching $15 billion by 2033.
Molded Adapter Segmentation
-
1. Application
- 1.1. Automotive Electronics
- 1.2. Home Appliances
- 1.3. Consumer Electronics
- 1.4. New Energy Industry
- 1.5. Automation Control Industry
-
2. Type
- 2.1. 1 Line
- 2.2. 2 Lines
- 2.3. 3 Lines
- 2.4. 4 Lines
- 2.5. 5 Lines
- 2.6. 6 Lines
- 2.7. Other
Molded Adapter Segmentation By Geography
-
1. North America
- 1.1. United States
- 1.2. Canada
- 1.3. Mexico
-
2. South America
- 2.1. Brazil
- 2.2. Argentina
- 2.3. Rest of South America
-
3. Europe
- 3.1. United Kingdom
- 3.2. Germany
- 3.3. France
- 3.4. Italy
- 3.5. Spain
- 3.6. Russia
- 3.7. Benelux
- 3.8. Nordics
- 3.9. Rest of Europe
-
4. Middle East & Africa
- 4.1. Turkey
- 4.2. Israel
- 4.3. GCC
- 4.4. North Africa
- 4.5. South Africa
- 4.6. Rest of Middle East & Africa
-
5. Asia Pacific
- 5.1. China
- 5.2. India
- 5.3. Japan
- 5.4. South Korea
- 5.5. ASEAN
- 5.6. Oceania
- 5.7. Rest of Asia Pacific
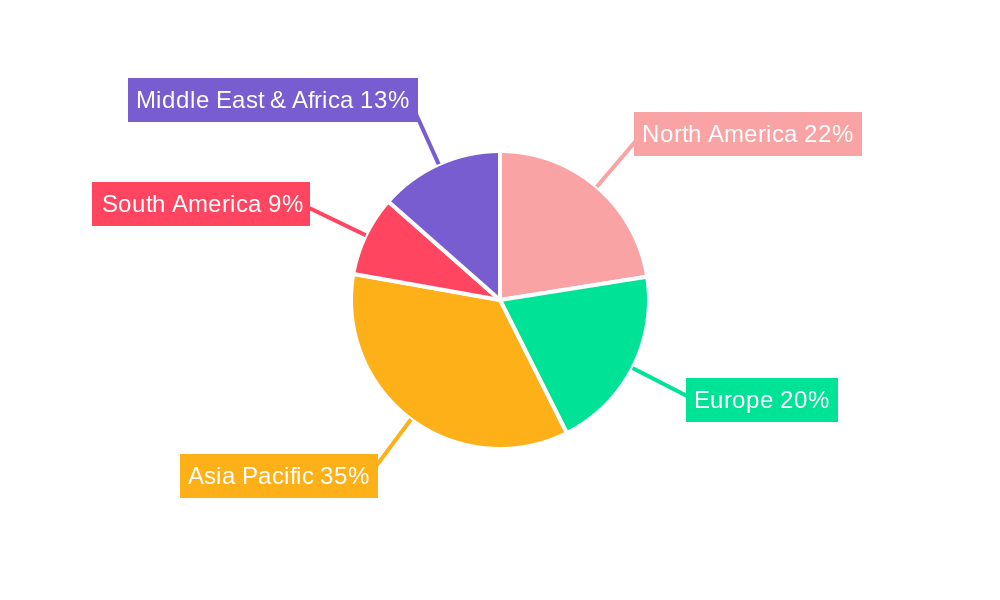
Molded Adapter Regional Market Share
Geographic Coverage of Molded Adapter
Molded Adapter REPORT HIGHLIGHTS
| Aspects | Details |
|---|---|
| Study Period | 2020-2034 |
| Base Year | 2025 |
| Estimated Year | 2026 |
| Forecast Period | 2026-2034 |
| Historical Period | 2020-2025 |
| Growth Rate | CAGR of 14.4% from 2020-2034 |
| Segmentation |
|
Table of Contents
- 1. Introduction
- 1.1. Research Scope
- 1.2. Market Segmentation
- 1.3. Research Objective
- 1.4. Definitions and Assumptions
- 2. Executive Summary
- 2.1. Market Snapshot
- 3. Market Dynamics
- 3.1. Market Drivers
- 3.2. Market Restrains
- 3.3. Market Trends
- 3.4. Market Opportunities
- 4. Market Factor Analysis
- 4.1. Porters Five Forces
- 4.1.1. Bargaining Power of Suppliers
- 4.1.2. Bargaining Power of Buyers
- 4.1.3. Threat of New Entrants
- 4.1.4. Threat of Substitutes
- 4.1.5. Competitive Rivalry
- 4.2. PESTEL analysis
- 4.3. BCG Analysis
- 4.3.1. Stars (High Growth, High Market Share)
- 4.3.2. Cash Cows (Low Growth, High Market Share)
- 4.3.3. Question Mark (High Growth, Low Market Share)
- 4.3.4. Dogs (Low Growth, Low Market Share)
- 4.4. Ansoff Matrix Analysis
- 4.5. Supply Chain Analysis
- 4.6. Regulatory Landscape
- 4.7. Current Market Potential and Opportunity Assessment (TAM–SAM–SOM Framework)
- 4.8. DMV Analyst Note
- 4.1. Porters Five Forces
- 5. Market Analysis, Insights and Forecast 2021-2033
- 5.1. Market Analysis, Insights and Forecast - by Application
- 5.1.1. Automotive Electronics
- 5.1.2. Home Appliances
- 5.1.3. Consumer Electronics
- 5.1.4. New Energy Industry
- 5.1.5. Automation Control Industry
- 5.2. Market Analysis, Insights and Forecast - by Type
- 5.2.1. 1 Line
- 5.2.2. 2 Lines
- 5.2.3. 3 Lines
- 5.2.4. 4 Lines
- 5.2.5. 5 Lines
- 5.2.6. 6 Lines
- 5.2.7. Other
- 5.3. Market Analysis, Insights and Forecast - by Region
- 5.3.1. North America
- 5.3.2. South America
- 5.3.3. Europe
- 5.3.4. Middle East & Africa
- 5.3.5. Asia Pacific
- 5.1. Market Analysis, Insights and Forecast - by Application
- 6. Global Molded Adapter Analysis, Insights and Forecast, 2021-2033
- 6.1. Market Analysis, Insights and Forecast - by Application
- 6.1.1. Automotive Electronics
- 6.1.2. Home Appliances
- 6.1.3. Consumer Electronics
- 6.1.4. New Energy Industry
- 6.1.5. Automation Control Industry
- 6.2. Market Analysis, Insights and Forecast - by Type
- 6.2.1. 1 Line
- 6.2.2. 2 Lines
- 6.2.3. 3 Lines
- 6.2.4. 4 Lines
- 6.2.5. 5 Lines
- 6.2.6. 6 Lines
- 6.2.7. Other
- 6.1. Market Analysis, Insights and Forecast - by Application
- 7. North America Molded Adapter Analysis, Insights and Forecast, 2020-2032
- 7.1. Market Analysis, Insights and Forecast - by Application
- 7.1.1. Automotive Electronics
- 7.1.2. Home Appliances
- 7.1.3. Consumer Electronics
- 7.1.4. New Energy Industry
- 7.1.5. Automation Control Industry
- 7.2. Market Analysis, Insights and Forecast - by Type
- 7.2.1. 1 Line
- 7.2.2. 2 Lines
- 7.2.3. 3 Lines
- 7.2.4. 4 Lines
- 7.2.5. 5 Lines
- 7.2.6. 6 Lines
- 7.2.7. Other
- 7.1. Market Analysis, Insights and Forecast - by Application
- 8. South America Molded Adapter Analysis, Insights and Forecast, 2020-2032
- 8.1. Market Analysis, Insights and Forecast - by Application
- 8.1.1. Automotive Electronics
- 8.1.2. Home Appliances
- 8.1.3. Consumer Electronics
- 8.1.4. New Energy Industry
- 8.1.5. Automation Control Industry
- 8.2. Market Analysis, Insights and Forecast - by Type
- 8.2.1. 1 Line
- 8.2.2. 2 Lines
- 8.2.3. 3 Lines
- 8.2.4. 4 Lines
- 8.2.5. 5 Lines
- 8.2.6. 6 Lines
- 8.2.7. Other
- 8.1. Market Analysis, Insights and Forecast - by Application
- 9. Europe Molded Adapter Analysis, Insights and Forecast, 2020-2032
- 9.1. Market Analysis, Insights and Forecast - by Application
- 9.1.1. Automotive Electronics
- 9.1.2. Home Appliances
- 9.1.3. Consumer Electronics
- 9.1.4. New Energy Industry
- 9.1.5. Automation Control Industry
- 9.2. Market Analysis, Insights and Forecast - by Type
- 9.2.1. 1 Line
- 9.2.2. 2 Lines
- 9.2.3. 3 Lines
- 9.2.4. 4 Lines
- 9.2.5. 5 Lines
- 9.2.6. 6 Lines
- 9.2.7. Other
- 9.1. Market Analysis, Insights and Forecast - by Application
- 10. Middle East & Africa Molded Adapter Analysis, Insights and Forecast, 2020-2032
- 10.1. Market Analysis, Insights and Forecast - by Application
- 10.1.1. Automotive Electronics
- 10.1.2. Home Appliances
- 10.1.3. Consumer Electronics
- 10.1.4. New Energy Industry
- 10.1.5. Automation Control Industry
- 10.2. Market Analysis, Insights and Forecast - by Type
- 10.2.1. 1 Line
- 10.2.2. 2 Lines
- 10.2.3. 3 Lines
- 10.2.4. 4 Lines
- 10.2.5. 5 Lines
- 10.2.6. 6 Lines
- 10.2.7. Other
- 10.1. Market Analysis, Insights and Forecast - by Application
- 11. Asia Pacific Molded Adapter Analysis, Insights and Forecast, 2020-2032
- 11.1. Market Analysis, Insights and Forecast - by Application
- 11.1.1. Automotive Electronics
- 11.1.2. Home Appliances
- 11.1.3. Consumer Electronics
- 11.1.4. New Energy Industry
- 11.1.5. Automation Control Industry
- 11.2. Market Analysis, Insights and Forecast - by Type
- 11.2.1. 1 Line
- 11.2.2. 2 Lines
- 11.2.3. 3 Lines
- 11.2.4. 4 Lines
- 11.2.5. 5 Lines
- 11.2.6. 6 Lines
- 11.2.7. Other
- 11.1. Market Analysis, Insights and Forecast - by Application
- 12. Competitive Analysis
- 12.1. Company Profiles
- 12.1.1 TE Connectivity
- 12.1.1.1. Company Overview
- 12.1.1.2. Products
- 12.1.1.3. Company Financials
- 12.1.1.4. SWOT Analysis
- 12.1.2 Amphenol
- 12.1.2.1. Company Overview
- 12.1.2.2. Products
- 12.1.2.3. Company Financials
- 12.1.2.4. SWOT Analysis
- 12.1.3 Neutrik
- 12.1.3.1. Company Overview
- 12.1.3.2. Products
- 12.1.3.3. Company Financials
- 12.1.3.4. SWOT Analysis
- 12.1.4 Molex
- 12.1.4.1. Company Overview
- 12.1.4.2. Products
- 12.1.4.3. Company Financials
- 12.1.4.4. SWOT Analysis
- 12.1.5 Mh Connectors
- 12.1.5.1. Company Overview
- 12.1.5.2. Products
- 12.1.5.3. Company Financials
- 12.1.5.4. SWOT Analysis
- 12.1.6 Phoenix Contact
- 12.1.6.1. Company Overview
- 12.1.6.2. Products
- 12.1.6.3. Company Financials
- 12.1.6.4. SWOT Analysis
- 12.1.7 Stewart Connector
- 12.1.7.1. Company Overview
- 12.1.7.2. Products
- 12.1.7.3. Company Financials
- 12.1.7.4. SWOT Analysis
- 12.1.8 Switchcraft
- 12.1.8.1. Company Overview
- 12.1.8.2. Products
- 12.1.8.3. Company Financials
- 12.1.8.4. SWOT Analysis
- 12.1.9 Hubbell Wiring Devices
- 12.1.9.1. Company Overview
- 12.1.9.2. Products
- 12.1.9.3. Company Financials
- 12.1.9.4. SWOT Analysis
- 12.1.10 Cliff Electronic Components
- 12.1.10.1. Company Overview
- 12.1.10.2. Products
- 12.1.10.3. Company Financials
- 12.1.10.4. SWOT Analysis
- 12.1.11 TUK
- 12.1.11.1. Company Overview
- 12.1.11.2. Products
- 12.1.11.3. Company Financials
- 12.1.11.4. SWOT Analysis
- 12.1.12 Bulgin Limited
- 12.1.12.1. Company Overview
- 12.1.12.2. Products
- 12.1.12.3. Company Financials
- 12.1.12.4. SWOT Analysis
- 12.1.13 Cinch Connectivity
- 12.1.13.1. Company Overview
- 12.1.13.2. Products
- 12.1.13.3. Company Financials
- 12.1.13.4. SWOT Analysis
- 12.1.14 Belden
- 12.1.14.1. Company Overview
- 12.1.14.2. Products
- 12.1.14.3. Company Financials
- 12.1.14.4. SWOT Analysis
- 12.1.15 Black Box
- 12.1.15.1. Company Overview
- 12.1.15.2. Products
- 12.1.15.3. Company Financials
- 12.1.15.4. SWOT Analysis
- 12.1.16 GC Electronics
- 12.1.16.1. Company Overview
- 12.1.16.2. Products
- 12.1.16.3. Company Financials
- 12.1.16.4. SWOT Analysis
- 12.1.17 Grace Technologies
- 12.1.17.1. Company Overview
- 12.1.17.2. Products
- 12.1.17.3. Company Financials
- 12.1.17.4. SWOT Analysis
- 12.1.18 Harting
- 12.1.18.1. Company Overview
- 12.1.18.2. Products
- 12.1.18.3. Company Financials
- 12.1.18.4. SWOT Analysis
- 12.1.19 Hylec
- 12.1.19.1. Company Overview
- 12.1.19.2. Products
- 12.1.19.3. Company Financials
- 12.1.19.4. SWOT Analysis
- 12.1.20 MCM
- 12.1.20.1. Company Overview
- 12.1.20.2. Products
- 12.1.20.3. Company Financials
- 12.1.20.4. SWOT Analysis
- 12.1.21 METZ Connect
- 12.1.21.1. Company Overview
- 12.1.21.2. Products
- 12.1.21.3. Company Financials
- 12.1.21.4. SWOT Analysis
- 12.1.22 Panduit
- 12.1.22.1. Company Overview
- 12.1.22.2. Products
- 12.1.22.3. Company Financials
- 12.1.22.4. SWOT Analysis
- 12.1.23 Roline
- 12.1.23.1. Company Overview
- 12.1.23.2. Products
- 12.1.23.3. Company Financials
- 12.1.23.4. SWOT Analysis
- 12.1.24 Videk
- 12.1.24.1. Company Overview
- 12.1.24.2. Products
- 12.1.24.3. Company Financials
- 12.1.24.4. SWOT Analysis
- 12.1.25 Weidmuller
- 12.1.25.1. Company Overview
- 12.1.25.2. Products
- 12.1.25.3. Company Financials
- 12.1.25.4. SWOT Analysis
- 12.1.1 TE Connectivity
- 12.2. Market Entropy
- 12.2.1 Company's Key Areas Served
- 12.2.2 Recent Developments
- 12.3. Company Market Share Analysis 2025
- 12.3.1 Top 5 Companies Market Share Analysis
- 12.3.2 Top 3 Companies Market Share Analysis
- 12.4. List of Potential Customers
- 13. Research Methodology
List of Figures
- Figure 1: Global Molded Adapter Revenue Breakdown (billion, %) by Region 2025 & 2033
- Figure 2: Global Molded Adapter Volume Breakdown (K, %) by Region 2025 & 2033
- Figure 3: North America Molded Adapter Revenue (billion), by Application 2025 & 2033
- Figure 4: North America Molded Adapter Volume (K), by Application 2025 & 2033
- Figure 5: North America Molded Adapter Revenue Share (%), by Application 2025 & 2033
- Figure 6: North America Molded Adapter Volume Share (%), by Application 2025 & 2033
- Figure 7: North America Molded Adapter Revenue (billion), by Type 2025 & 2033
- Figure 8: North America Molded Adapter Volume (K), by Type 2025 & 2033
- Figure 9: North America Molded Adapter Revenue Share (%), by Type 2025 & 2033
- Figure 10: North America Molded Adapter Volume Share (%), by Type 2025 & 2033
- Figure 11: North America Molded Adapter Revenue (billion), by Country 2025 & 2033
- Figure 12: North America Molded Adapter Volume (K), by Country 2025 & 2033
- Figure 13: North America Molded Adapter Revenue Share (%), by Country 2025 & 2033
- Figure 14: North America Molded Adapter Volume Share (%), by Country 2025 & 2033
- Figure 15: South America Molded Adapter Revenue (billion), by Application 2025 & 2033
- Figure 16: South America Molded Adapter Volume (K), by Application 2025 & 2033
- Figure 17: South America Molded Adapter Revenue Share (%), by Application 2025 & 2033
- Figure 18: South America Molded Adapter Volume Share (%), by Application 2025 & 2033
- Figure 19: South America Molded Adapter Revenue (billion), by Type 2025 & 2033
- Figure 20: South America Molded Adapter Volume (K), by Type 2025 & 2033
- Figure 21: South America Molded Adapter Revenue Share (%), by Type 2025 & 2033
- Figure 22: South America Molded Adapter Volume Share (%), by Type 2025 & 2033
- Figure 23: South America Molded Adapter Revenue (billion), by Country 2025 & 2033
- Figure 24: South America Molded Adapter Volume (K), by Country 2025 & 2033
- Figure 25: South America Molded Adapter Revenue Share (%), by Country 2025 & 2033
- Figure 26: South America Molded Adapter Volume Share (%), by Country 2025 & 2033
- Figure 27: Europe Molded Adapter Revenue (billion), by Application 2025 & 2033
- Figure 28: Europe Molded Adapter Volume (K), by Application 2025 & 2033
- Figure 29: Europe Molded Adapter Revenue Share (%), by Application 2025 & 2033
- Figure 30: Europe Molded Adapter Volume Share (%), by Application 2025 & 2033
- Figure 31: Europe Molded Adapter Revenue (billion), by Type 2025 & 2033
- Figure 32: Europe Molded Adapter Volume (K), by Type 2025 & 2033
- Figure 33: Europe Molded Adapter Revenue Share (%), by Type 2025 & 2033
- Figure 34: Europe Molded Adapter Volume Share (%), by Type 2025 & 2033
- Figure 35: Europe Molded Adapter Revenue (billion), by Country 2025 & 2033
- Figure 36: Europe Molded Adapter Volume (K), by Country 2025 & 2033
- Figure 37: Europe Molded Adapter Revenue Share (%), by Country 2025 & 2033
- Figure 38: Europe Molded Adapter Volume Share (%), by Country 2025 & 2033
- Figure 39: Middle East & Africa Molded Adapter Revenue (billion), by Application 2025 & 2033
- Figure 40: Middle East & Africa Molded Adapter Volume (K), by Application 2025 & 2033
- Figure 41: Middle East & Africa Molded Adapter Revenue Share (%), by Application 2025 & 2033
- Figure 42: Middle East & Africa Molded Adapter Volume Share (%), by Application 2025 & 2033
- Figure 43: Middle East & Africa Molded Adapter Revenue (billion), by Type 2025 & 2033
- Figure 44: Middle East & Africa Molded Adapter Volume (K), by Type 2025 & 2033
- Figure 45: Middle East & Africa Molded Adapter Revenue Share (%), by Type 2025 & 2033
- Figure 46: Middle East & Africa Molded Adapter Volume Share (%), by Type 2025 & 2033
- Figure 47: Middle East & Africa Molded Adapter Revenue (billion), by Country 2025 & 2033
- Figure 48: Middle East & Africa Molded Adapter Volume (K), by Country 2025 & 2033
- Figure 49: Middle East & Africa Molded Adapter Revenue Share (%), by Country 2025 & 2033
- Figure 50: Middle East & Africa Molded Adapter Volume Share (%), by Country 2025 & 2033
- Figure 51: Asia Pacific Molded Adapter Revenue (billion), by Application 2025 & 2033
- Figure 52: Asia Pacific Molded Adapter Volume (K), by Application 2025 & 2033
- Figure 53: Asia Pacific Molded Adapter Revenue Share (%), by Application 2025 & 2033
- Figure 54: Asia Pacific Molded Adapter Volume Share (%), by Application 2025 & 2033
- Figure 55: Asia Pacific Molded Adapter Revenue (billion), by Type 2025 & 2033
- Figure 56: Asia Pacific Molded Adapter Volume (K), by Type 2025 & 2033
- Figure 57: Asia Pacific Molded Adapter Revenue Share (%), by Type 2025 & 2033
- Figure 58: Asia Pacific Molded Adapter Volume Share (%), by Type 2025 & 2033
- Figure 59: Asia Pacific Molded Adapter Revenue (billion), by Country 2025 & 2033
- Figure 60: Asia Pacific Molded Adapter Volume (K), by Country 2025 & 2033
- Figure 61: Asia Pacific Molded Adapter Revenue Share (%), by Country 2025 & 2033
- Figure 62: Asia Pacific Molded Adapter Volume Share (%), by Country 2025 & 2033
List of Tables
- Table 1: Global Molded Adapter Revenue billion Forecast, by Application 2020 & 2033
- Table 2: Global Molded Adapter Volume K Forecast, by Application 2020 & 2033
- Table 3: Global Molded Adapter Revenue billion Forecast, by Type 2020 & 2033
- Table 4: Global Molded Adapter Volume K Forecast, by Type 2020 & 2033
- Table 5: Global Molded Adapter Revenue billion Forecast, by Region 2020 & 2033
- Table 6: Global Molded Adapter Volume K Forecast, by Region 2020 & 2033
- Table 7: Global Molded Adapter Revenue billion Forecast, by Application 2020 & 2033
- Table 8: Global Molded Adapter Volume K Forecast, by Application 2020 & 2033
- Table 9: Global Molded Adapter Revenue billion Forecast, by Type 2020 & 2033
- Table 10: Global Molded Adapter Volume K Forecast, by Type 2020 & 2033
- Table 11: Global Molded Adapter Revenue billion Forecast, by Country 2020 & 2033
- Table 12: Global Molded Adapter Volume K Forecast, by Country 2020 & 2033
- Table 13: United States Molded Adapter Revenue (billion) Forecast, by Application 2020 & 2033
- Table 14: United States Molded Adapter Volume (K) Forecast, by Application 2020 & 2033
- Table 15: Canada Molded Adapter Revenue (billion) Forecast, by Application 2020 & 2033
- Table 16: Canada Molded Adapter Volume (K) Forecast, by Application 2020 & 2033
- Table 17: Mexico Molded Adapter Revenue (billion) Forecast, by Application 2020 & 2033
- Table 18: Mexico Molded Adapter Volume (K) Forecast, by Application 2020 & 2033
- Table 19: Global Molded Adapter Revenue billion Forecast, by Application 2020 & 2033
- Table 20: Global Molded Adapter Volume K Forecast, by Application 2020 & 2033
- Table 21: Global Molded Adapter Revenue billion Forecast, by Type 2020 & 2033
- Table 22: Global Molded Adapter Volume K Forecast, by Type 2020 & 2033
- Table 23: Global Molded Adapter Revenue billion Forecast, by Country 2020 & 2033
- Table 24: Global Molded Adapter Volume K Forecast, by Country 2020 & 2033
- Table 25: Brazil Molded Adapter Revenue (billion) Forecast, by Application 2020 & 2033
- Table 26: Brazil Molded Adapter Volume (K) Forecast, by Application 2020 & 2033
- Table 27: Argentina Molded Adapter Revenue (billion) Forecast, by Application 2020 & 2033
- Table 28: Argentina Molded Adapter Volume (K) Forecast, by Application 2020 & 2033
- Table 29: Rest of South America Molded Adapter Revenue (billion) Forecast, by Application 2020 & 2033
- Table 30: Rest of South America Molded Adapter Volume (K) Forecast, by Application 2020 & 2033
- Table 31: Global Molded Adapter Revenue billion Forecast, by Application 2020 & 2033
- Table 32: Global Molded Adapter Volume K Forecast, by Application 2020 & 2033
- Table 33: Global Molded Adapter Revenue billion Forecast, by Type 2020 & 2033
- Table 34: Global Molded Adapter Volume K Forecast, by Type 2020 & 2033
- Table 35: Global Molded Adapter Revenue billion Forecast, by Country 2020 & 2033
- Table 36: Global Molded Adapter Volume K Forecast, by Country 2020 & 2033
- Table 37: United Kingdom Molded Adapter Revenue (billion) Forecast, by Application 2020 & 2033
- Table 38: United Kingdom Molded Adapter Volume (K) Forecast, by Application 2020 & 2033
- Table 39: Germany Molded Adapter Revenue (billion) Forecast, by Application 2020 & 2033
- Table 40: Germany Molded Adapter Volume (K) Forecast, by Application 2020 & 2033
- Table 41: France Molded Adapter Revenue (billion) Forecast, by Application 2020 & 2033
- Table 42: France Molded Adapter Volume (K) Forecast, by Application 2020 & 2033
- Table 43: Italy Molded Adapter Revenue (billion) Forecast, by Application 2020 & 2033
- Table 44: Italy Molded Adapter Volume (K) Forecast, by Application 2020 & 2033
- Table 45: Spain Molded Adapter Revenue (billion) Forecast, by Application 2020 & 2033
- Table 46: Spain Molded Adapter Volume (K) Forecast, by Application 2020 & 2033
- Table 47: Russia Molded Adapter Revenue (billion) Forecast, by Application 2020 & 2033
- Table 48: Russia Molded Adapter Volume (K) Forecast, by Application 2020 & 2033
- Table 49: Benelux Molded Adapter Revenue (billion) Forecast, by Application 2020 & 2033
- Table 50: Benelux Molded Adapter Volume (K) Forecast, by Application 2020 & 2033
- Table 51: Nordics Molded Adapter Revenue (billion) Forecast, by Application 2020 & 2033
- Table 52: Nordics Molded Adapter Volume (K) Forecast, by Application 2020 & 2033
- Table 53: Rest of Europe Molded Adapter Revenue (billion) Forecast, by Application 2020 & 2033
- Table 54: Rest of Europe Molded Adapter Volume (K) Forecast, by Application 2020 & 2033
- Table 55: Global Molded Adapter Revenue billion Forecast, by Application 2020 & 2033
- Table 56: Global Molded Adapter Volume K Forecast, by Application 2020 & 2033
- Table 57: Global Molded Adapter Revenue billion Forecast, by Type 2020 & 2033
- Table 58: Global Molded Adapter Volume K Forecast, by Type 2020 & 2033
- Table 59: Global Molded Adapter Revenue billion Forecast, by Country 2020 & 2033
- Table 60: Global Molded Adapter Volume K Forecast, by Country 2020 & 2033
- Table 61: Turkey Molded Adapter Revenue (billion) Forecast, by Application 2020 & 2033
- Table 62: Turkey Molded Adapter Volume (K) Forecast, by Application 2020 & 2033
- Table 63: Israel Molded Adapter Revenue (billion) Forecast, by Application 2020 & 2033
- Table 64: Israel Molded Adapter Volume (K) Forecast, by Application 2020 & 2033
- Table 65: GCC Molded Adapter Revenue (billion) Forecast, by Application 2020 & 2033
- Table 66: GCC Molded Adapter Volume (K) Forecast, by Application 2020 & 2033
- Table 67: North Africa Molded Adapter Revenue (billion) Forecast, by Application 2020 & 2033
- Table 68: North Africa Molded Adapter Volume (K) Forecast, by Application 2020 & 2033
- Table 69: South Africa Molded Adapter Revenue (billion) Forecast, by Application 2020 & 2033
- Table 70: South Africa Molded Adapter Volume (K) Forecast, by Application 2020 & 2033
- Table 71: Rest of Middle East & Africa Molded Adapter Revenue (billion) Forecast, by Application 2020 & 2033
- Table 72: Rest of Middle East & Africa Molded Adapter Volume (K) Forecast, by Application 2020 & 2033
- Table 73: Global Molded Adapter Revenue billion Forecast, by Application 2020 & 2033
- Table 74: Global Molded Adapter Volume K Forecast, by Application 2020 & 2033
- Table 75: Global Molded Adapter Revenue billion Forecast, by Type 2020 & 2033
- Table 76: Global Molded Adapter Volume K Forecast, by Type 2020 & 2033
- Table 77: Global Molded Adapter Revenue billion Forecast, by Country 2020 & 2033
- Table 78: Global Molded Adapter Volume K Forecast, by Country 2020 & 2033
- Table 79: China Molded Adapter Revenue (billion) Forecast, by Application 2020 & 2033
- Table 80: China Molded Adapter Volume (K) Forecast, by Application 2020 & 2033
- Table 81: India Molded Adapter Revenue (billion) Forecast, by Application 2020 & 2033
- Table 82: India Molded Adapter Volume (K) Forecast, by Application 2020 & 2033
- Table 83: Japan Molded Adapter Revenue (billion) Forecast, by Application 2020 & 2033
- Table 84: Japan Molded Adapter Volume (K) Forecast, by Application 2020 & 2033
- Table 85: South Korea Molded Adapter Revenue (billion) Forecast, by Application 2020 & 2033
- Table 86: South Korea Molded Adapter Volume (K) Forecast, by Application 2020 & 2033
- Table 87: ASEAN Molded Adapter Revenue (billion) Forecast, by Application 2020 & 2033
- Table 88: ASEAN Molded Adapter Volume (K) Forecast, by Application 2020 & 2033
- Table 89: Oceania Molded Adapter Revenue (billion) Forecast, by Application 2020 & 2033
- Table 90: Oceania Molded Adapter Volume (K) Forecast, by Application 2020 & 2033
- Table 91: Rest of Asia Pacific Molded Adapter Revenue (billion) Forecast, by Application 2020 & 2033
- Table 92: Rest of Asia Pacific Molded Adapter Volume (K) Forecast, by Application 2020 & 2033
Frequently Asked Questions
1. What is the projected Compound Annual Growth Rate (CAGR) of the Molded Adapter?
The projected CAGR is approximately 14.4%.
2. Which companies are prominent players in the Molded Adapter?
Key companies in the market include TE Connectivity, Amphenol, Neutrik, Molex, Mh Connectors, Phoenix Contact, Stewart Connector, Switchcraft, Hubbell Wiring Devices, Cliff Electronic Components, TUK, Bulgin Limited, Cinch Connectivity, Belden, Black Box, GC Electronics, Grace Technologies, Harting, Hylec, MCM, METZ Connect, Panduit, Roline, Videk, Weidmuller.
3. What are the main segments of the Molded Adapter?
The market segments include Application, Type.
4. Can you provide details about the market size?
The market size is estimated to be USD 2 billion as of 2022.
5. What are some drivers contributing to market growth?
N/A
6. What are the notable trends driving market growth?
N/A
7. Are there any restraints impacting market growth?
N/A
8. Can you provide examples of recent developments in the market?
N/A
9. What pricing options are available for accessing the report?
Pricing options include single-user, multi-user, and enterprise licenses priced at USD 3950.00, USD 5925.00, and USD 7900.00 respectively.
10. Is the market size provided in terms of value or volume?
The market size is provided in terms of value, measured in billion and volume, measured in K.
11. Are there any specific market keywords associated with the report?
Yes, the market keyword associated with the report is "Molded Adapter," which aids in identifying and referencing the specific market segment covered.
12. How do I determine which pricing option suits my needs best?
The pricing options vary based on user requirements and access needs. Individual users may opt for single-user licenses, while businesses requiring broader access may choose multi-user or enterprise licenses for cost-effective access to the report.
13. Are there any additional resources or data provided in the Molded Adapter report?
While the report offers comprehensive insights, it's advisable to review the specific contents or supplementary materials provided to ascertain if additional resources or data are available.
14. How can I stay updated on further developments or reports in the Molded Adapter?
To stay informed about further developments, trends, and reports in the Molded Adapter, consider subscribing to industry newsletters, following relevant companies and organizations, or regularly checking reputable industry news sources and publications.
Methodology
Step 1 - Identification of Relevant Samples Size from Population Database


Step 2 - Approaches for Defining Global Market Size (Value, Volume* & Price*)

Note*: In applicable scenarios
Step 3 - Data Sources
Primary Research
- Web Analytics
- Survey Reports
- Research Institute
- Latest Research Reports
- Opinion Leaders
Secondary Research
- Annual Reports
- White Paper
- Latest Press Release
- Industry Association
- Paid Database
- Investor Presentations

Step 4 - Data Triangulation
Involves using different sources of information in order to increase the validity of a study
These sources are likely to be stakeholders in a program - participants, other researchers, program staff, other community members, and so on.
Then we put all data in single framework & apply various statistical tools to find out the dynamic on the market.
During the analysis stage, feedback from the stakeholder groups would be compared to determine areas of agreement as well as areas of divergence