

Key Insights
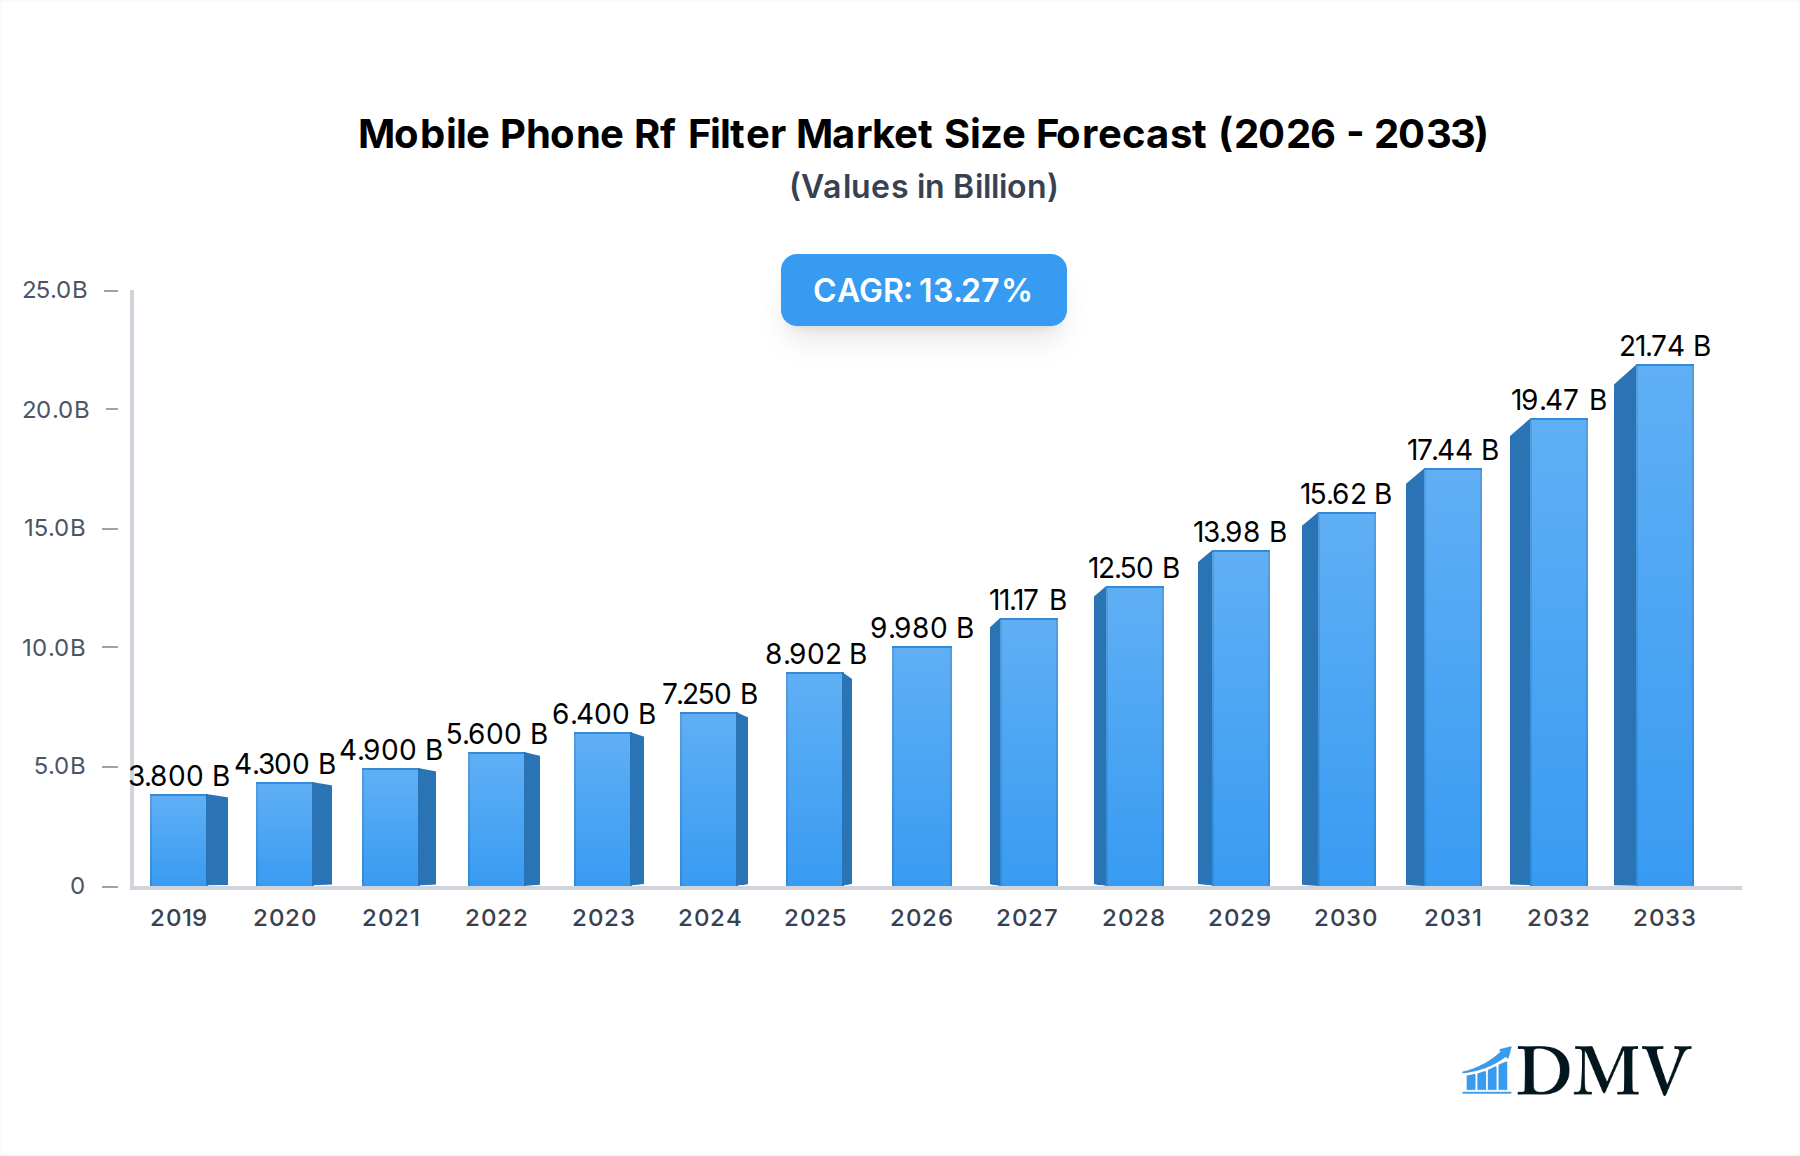
The global Mobile Phone RF Filter market is poised for significant expansion, projected to reach an impressive $8902 million by 2025. This robust growth is underpinned by a remarkable Compound Annual Growth Rate (CAGR) of 12.1% from 2019 to 2033. The primary drivers fueling this surge are the escalating demand for advanced mobile devices, particularly the rapid adoption of 5G technology and the continuous innovation in smartphone features. As consumers increasingly demand faster data speeds, improved connectivity, and enhanced performance, the role of sophisticated RF filters becomes paramount in ensuring seamless communication. The proliferation of smartphones across all demographics, coupled with the ongoing replacement cycle of older devices with newer, more capable models, further fuels this upward trajectory. The market is characterized by a dynamic landscape where technological advancements, such as the evolution of SAW and BAW filter technologies, are crucial for meeting the stringent performance requirements of modern mobile phones.

Mobile Phone Rf Filter Market Size (In Billion)
The competitive environment is dominated by major industry players like TDK, Murata, Taiyo Yuden, Skyworks, Qorvo, Broadcom, WISOL, and Kyocera, all actively investing in research and development to innovate and capture market share. These companies are focused on developing smaller, more efficient, and higher-performance RF filters to support the complex radio frequency needs of smartphones. Geographically, the Asia Pacific region, led by China and India, is expected to remain a dominant force due to its vast manufacturing capabilities and substantial consumer base. However, North America and Europe are also significant markets, driven by high smartphone penetration and early adoption of 5G networks. Key trends include miniaturization, integration of multiple functionalities into single filter components, and the development of filters with broader bandwidths and lower insertion loss to enhance user experience and battery life in mobile devices. While the market is experiencing strong growth, potential restraints could include supply chain disruptions, fluctuating raw material costs, and intense price competition among manufacturers.
Mobile Phone Rf Filter Company Market Share
This comprehensive report delivers an in-depth analysis of the global Mobile Phone RF Filter market, providing critical insights for stakeholders navigating this dynamic sector. Spanning a study period from 2019 to 2033, with a base year of 2025 and a forecast period of 2025-2033, this report equips you with the data and intelligence needed to make informed strategic decisions. We meticulously examine market composition, industry evolution, regional dominance, product innovations, growth drivers, challenges, and future opportunities, underpinned by a robust forecast.
Mobile Phone Rf Filter Market Composition & Trends
The global Mobile Phone RF Filter market is characterized by a moderate to high concentration, with key players like TDK, Murata, Taiyo Yuden, Skyworks, Qorvo, Broadcom, WISOL, and Kyocera dominating market share. Innovation is a primary catalyst, driven by the relentless demand for faster, more efficient wireless communication in both 4G Mobile Phone and the rapidly expanding 5G Mobile Phone segments. Regulatory landscapes, while generally supportive of technological advancement, can introduce compliance complexities for new entrants. Substitute products, though less prevalent for high-performance RF filtering, are continually evaluated. End-user profiles are diverse, encompassing smartphone manufacturers, telecommunication equipment providers, and even emerging IoT device developers. Merger and acquisition (M&A) activities, with an estimated aggregate deal value of over $XXX million over the study period, continue to shape the competitive environment, enabling consolidation of expertise and market reach.
Mobile Phone Rf Filter Industry Evolution
The Mobile Phone RF Filter industry has undergone a remarkable evolution, driven by an insatiable consumer appetite for enhanced mobile connectivity. Over the historical period from 2019 to 2024, the market witnessed steady growth fueled by the widespread adoption of 4G technologies and the nascent stages of 5G deployment. The transition to 5G, characterized by its higher frequencies and increased data throughput requirements, has been a pivotal moment, accelerating the demand for sophisticated RF filtering solutions. Technological advancements have been central to this evolution. We have observed a significant shift from traditional SAW (Surface Acoustic Wave) RF filters towards more advanced BAW (Bulk Acoustic Wave) RF filters, offering superior performance in terms of insertion loss, power handling, and miniaturization – crucial for modern, compact smartphone designs. The adoption rate of BAW filters in high-end 5G devices has surged, with projections indicating a market penetration of over XX% by 2025. Consumer demand for seamless connectivity, lower latency, and enhanced multimedia experiences directly translates into the need for more robust and spectrally pure mobile communication, making advanced RF filters indispensable components. The market growth trajectory has been consistently upward, with an estimated Compound Annual Growth Rate (CAGR) of approximately XX% during the historical period and an anticipated XX% CAGR from 2025-2033. This sustained growth underscores the indispensable role of RF filters in the mobile ecosystem.
Leading Regions, Countries, or Segments in Mobile Phone Rf Filter
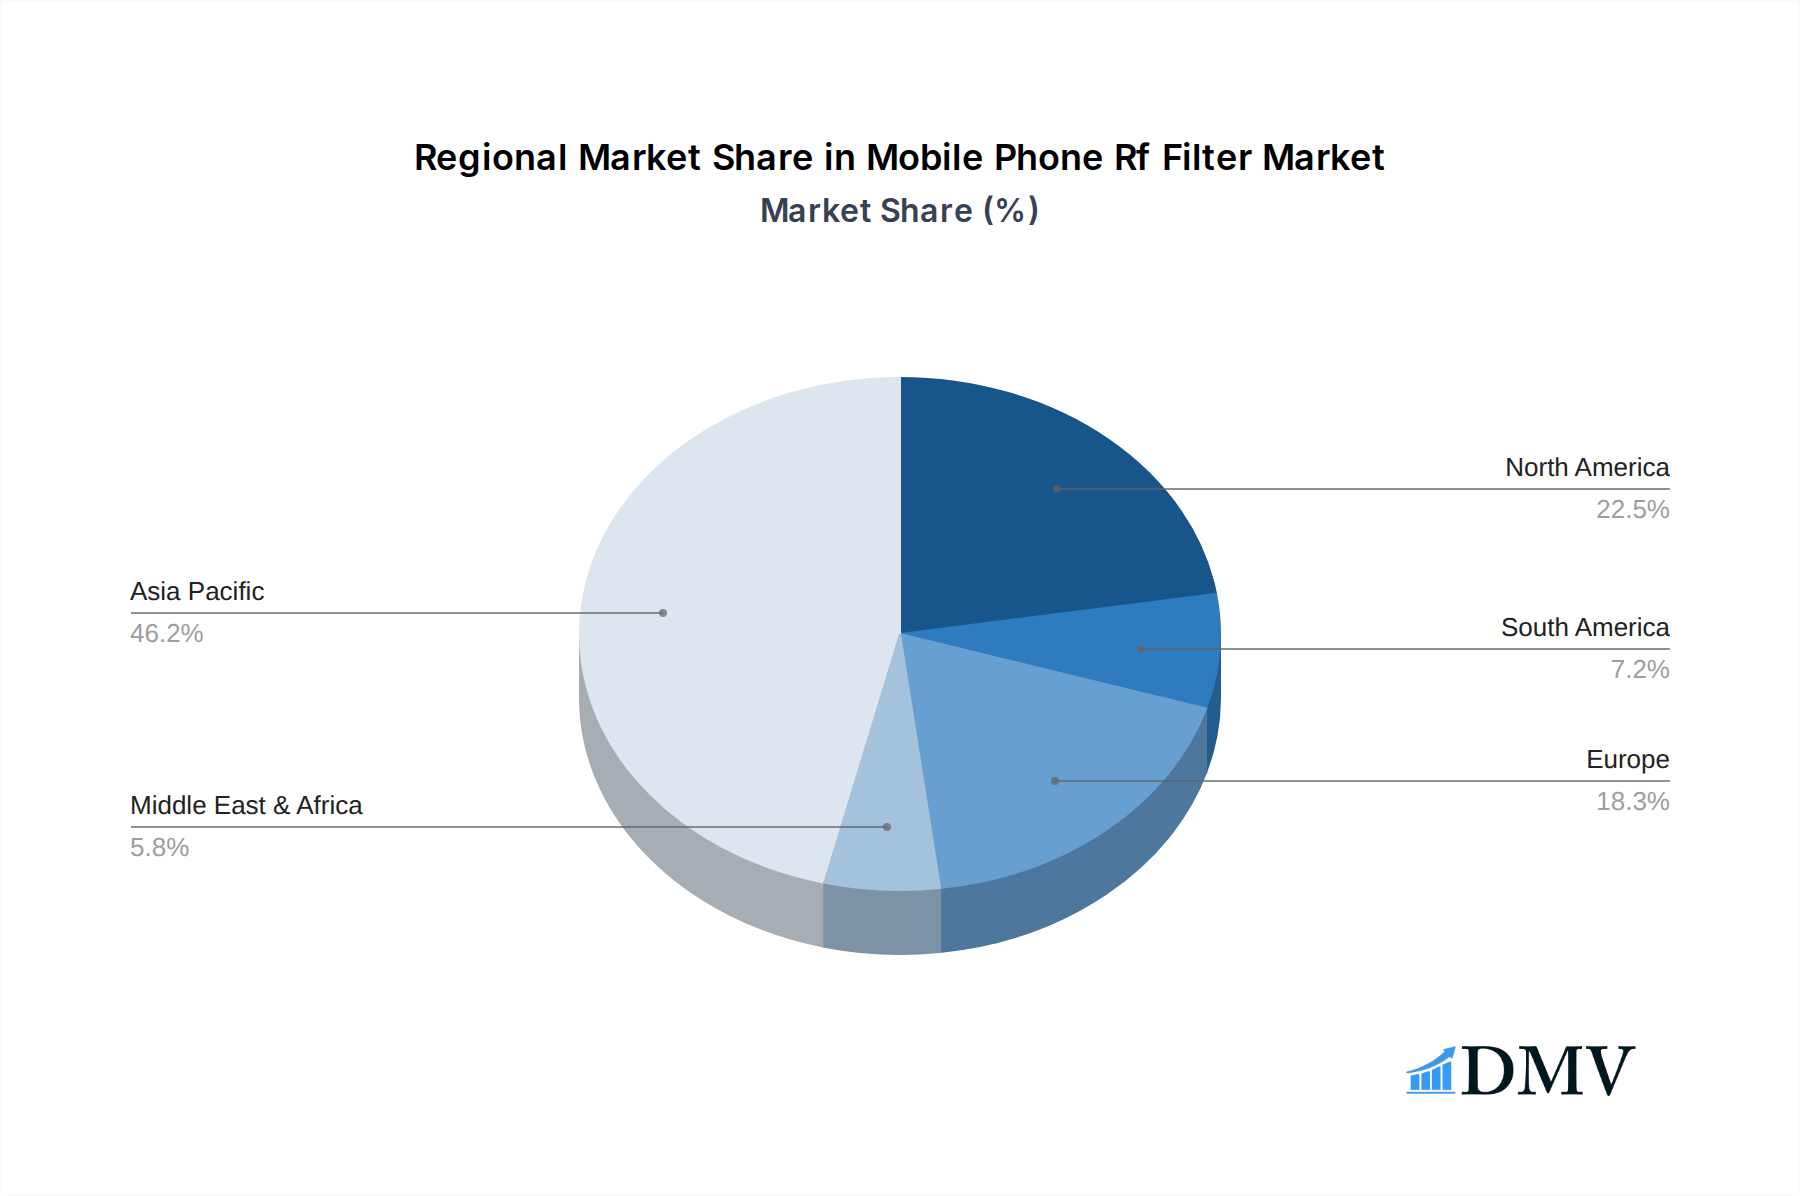
The Mobile Phone RF Filter market exhibits strong regional dynamics, with Asia Pacific currently holding a dominant position. This dominance is propelled by several key factors, including the region's status as a global hub for mobile phone manufacturing and its substantial consumer base.
Application Dominance: 5G Mobile Phone
- The rapid rollout of 5G networks and the increasing consumer demand for 5G-enabled devices are the primary drivers behind the dominance of the 5G Mobile Phone segment.
- Significant investments in 5G infrastructure by telecommunication companies across the globe, particularly in Asia, are creating a robust demand for high-performance RF filters.
- The need for advanced filtering to manage the complex frequency bands utilized in 5G, including millimeter-wave frequencies, necessitates the adoption of cutting-edge BAW RF Filter technology, further bolstering this segment.
Type Dominance: BAW RF Filter
- BAW RF filters are increasingly preferred over SAW RF filters in next-generation mobile devices due to their superior performance characteristics.
- These include higher frequency operation, lower insertion loss, higher Q-factor, and better temperature stability, all critical for enabling the enhanced capabilities of 5G.
- The miniaturization trend in smartphones also favors BAW filters, which can be integrated more compactly. The estimated market share of BAW filters within the overall RF filter market is projected to reach over XX% by 2025.
Regional Leadership: Asia Pacific
- Asia Pacific, particularly countries like China, South Korea, and Japan, leads in both production and consumption of mobile phones, directly translating to high demand for RF filters.
- The presence of major mobile device manufacturers and semiconductor foundries in this region creates a concentrated ecosystem for RF filter development and supply.
- Government initiatives and substantial R&D investments in advanced communication technologies within these countries further solidify their leadership.
While 4G Mobile Phone applications still contribute significantly, the growth momentum is clearly shifting towards 5G. The "Others" segment, encompassing IoT devices and specialized communication modules, represents a growing but currently smaller portion of the market.
Mobile Phone Rf Filter Product Innovations
Product innovation in the Mobile Phone RF Filter market is centered on enhancing performance and miniaturization. Manufacturers are developing filters with improved selectivity, lower insertion loss, and higher power handling capabilities to meet the stringent demands of 5G and future communication standards. Unique selling propositions include the integration of multiple filter functions into single modules, reducing component count and board space. For instance, advanced BAW filters are now achieving unprecedented levels of isolation between closely spaced frequency bands, crucial for efficient multi-band operation in smartphones. These advancements enable devices to support a wider range of frequencies, leading to better connectivity and data speeds, a key technological advancement for the industry.
Propelling Factors for Mobile Phone Rf Filter Growth
The growth of the Mobile Phone RF Filter market is propelled by several key factors. The accelerating global deployment of 5G Mobile Phone networks is a primary driver, necessitating advanced filtering solutions to manage complex frequency spectrums and ensure optimal performance. Technological advancements, particularly the rise of sophisticated BAW RF Filter technology offering superior bandwidth and reduced interference, are creating new market opportunities. Furthermore, the increasing demand for smartphones with enhanced features, including higher data speeds and seamless connectivity for applications like augmented reality and cloud gaming, directly fuels the need for more capable RF filters. Economic factors, such as growing disposable incomes in emerging markets, contribute to higher smartphone adoption rates, further expanding the market.
Obstacles in the Mobile Phone Rf Filter Market
Despite robust growth, the Mobile Phone RF Filter market faces several obstacles. Regulatory challenges, particularly concerning spectrum allocation and interference standards across different regions, can impact product development and market access. Supply chain disruptions, as witnessed in recent years due to global events, can lead to material shortages and increased lead times for critical components like piezoelectric substrates used in BAW filters, impacting production volumes and costs. Intense competitive pressures among established players and emerging manufacturers can lead to price erosion, impacting profit margins. The substantial R&D investment required to develop next-generation filters also presents a barrier for smaller companies.
Future Opportunities in Mobile Phone Rf Filter
Emerging opportunities in the Mobile Phone RF Filter market are abundant. The continued expansion of 5G into new frequency bands and the development of 6G technologies present significant avenues for innovation in filter design. The growing Internet of Things (IoT) ecosystem, with its diverse range of connected devices requiring reliable wireless communication, opens up new application areas for RF filters. Furthermore, advancements in semiconductor packaging technologies are enabling the integration of RF filters with other components, leading to more compact and cost-effective solutions. The increasing demand for ultra-reliable low-latency communication (URLLC) in industrial automation and autonomous vehicles also represents a burgeoning opportunity.
Major Players in the Mobile Phone Rf Filter Ecosystem
- TDK
- Murata
- Taiyo Yuden
- Skyworks
- Qorvo
- Broadcom
- WISOL
- Kyocera
Key Developments in Mobile Phone Rf Filter Industry
- 2023/Ongoing: Increased industry focus on developing advanced BAW filters for sub-6 GHz and mmWave 5G applications, offering higher performance and smaller form factors.
- 2023: Several companies announced significant investments in expanding manufacturing capacity for RF filters to meet escalating 5G demand.
- 2022: Introduction of innovative integrated RF front-end modules incorporating advanced filters, simplifying smartphone designs and reducing component count.
- 2021: Growing emphasis on supply chain resilience, with companies diversifying sourcing and exploring regional manufacturing options for critical raw materials and components.
- 2020: Accelerated research and development into filters for next-generation wireless technologies beyond 5G, including early exploration of 6G requirements.
Strategic Mobile Phone Rf Filter Market Forecast
The Mobile Phone RF Filter market is poised for significant growth, driven by the continued global rollout of 5G networks and the increasing demand for higher mobile data speeds and enhanced connectivity. Future opportunities lie in the development of next-generation filters for emerging 6G technologies, as well as catering to the diverse connectivity needs of the burgeoning Internet of Things ecosystem. Advances in material science and packaging technologies will enable more compact, efficient, and cost-effective RF filtering solutions. Strategic investments in R&D and manufacturing capacity by key players, coupled with favorable regulatory environments supporting advanced wireless communication, will underpin the market's robust upward trajectory. The market is projected to reach an estimated value of over $XXX million by 2033, reflecting sustained innovation and expanding application landscapes.
Mobile Phone Rf Filter Segmentation
-
1. Application
- 1.1. 4G Mobile Phone
- 1.2. 5G Mobile Phone
- 1.3. Others
-
2. Type
- 2.1. SAW RF Filter
- 2.2. BAW RF Filter
Mobile Phone Rf Filter Segmentation By Geography
-
1. North America
- 1.1. United States
- 1.2. Canada
- 1.3. Mexico
-
2. South America
- 2.1. Brazil
- 2.2. Argentina
- 2.3. Rest of South America
-
3. Europe
- 3.1. United Kingdom
- 3.2. Germany
- 3.3. France
- 3.4. Italy
- 3.5. Spain
- 3.6. Russia
- 3.7. Benelux
- 3.8. Nordics
- 3.9. Rest of Europe
-
4. Middle East & Africa
- 4.1. Turkey
- 4.2. Israel
- 4.3. GCC
- 4.4. North Africa
- 4.5. South Africa
- 4.6. Rest of Middle East & Africa
-
5. Asia Pacific
- 5.1. China
- 5.2. India
- 5.3. Japan
- 5.4. South Korea
- 5.5. ASEAN
- 5.6. Oceania
- 5.7. Rest of Asia Pacific
Mobile Phone Rf Filter Regional Market Share
Geographic Coverage of Mobile Phone Rf Filter
Mobile Phone Rf Filter REPORT HIGHLIGHTS
| Aspects | Details |
|---|---|
| Study Period | 2020-2034 |
| Base Year | 2025 |
| Estimated Year | 2026 |
| Forecast Period | 2026-2034 |
| Historical Period | 2020-2025 |
| Growth Rate | CAGR of 12.1% from 2020-2034 |
| Segmentation |
|
Table of Contents
- 1. Introduction
- 1.1. Research Scope
- 1.2. Market Segmentation
- 1.3. Research Objective
- 1.4. Definitions and Assumptions
- 2. Executive Summary
- 2.1. Market Snapshot
- 3. Market Dynamics
- 3.1. Market Drivers
- 3.2. Market Restrains
- 3.3. Market Trends
- 3.4. Market Opportunities
- 4. Market Factor Analysis
- 4.1. Porters Five Forces
- 4.1.1. Bargaining Power of Suppliers
- 4.1.2. Bargaining Power of Buyers
- 4.1.3. Threat of New Entrants
- 4.1.4. Threat of Substitutes
- 4.1.5. Competitive Rivalry
- 4.2. PESTEL analysis
- 4.3. BCG Analysis
- 4.3.1. Stars (High Growth, High Market Share)
- 4.3.2. Cash Cows (Low Growth, High Market Share)
- 4.3.3. Question Mark (High Growth, Low Market Share)
- 4.3.4. Dogs (Low Growth, Low Market Share)
- 4.4. Ansoff Matrix Analysis
- 4.5. Supply Chain Analysis
- 4.6. Regulatory Landscape
- 4.7. Current Market Potential and Opportunity Assessment (TAM–SAM–SOM Framework)
- 4.8. DMV Analyst Note
- 4.1. Porters Five Forces
- 5. Market Analysis, Insights and Forecast 2021-2033
- 5.1. Market Analysis, Insights and Forecast - by Application
- 5.1.1. 4G Mobile Phone
- 5.1.2. 5G Mobile Phone
- 5.1.3. Others
- 5.2. Market Analysis, Insights and Forecast - by Type
- 5.2.1. SAW RF Filter
- 5.2.2. BAW RF Filter
- 5.3. Market Analysis, Insights and Forecast - by Region
- 5.3.1. North America
- 5.3.2. South America
- 5.3.3. Europe
- 5.3.4. Middle East & Africa
- 5.3.5. Asia Pacific
- 5.1. Market Analysis, Insights and Forecast - by Application
- 6. Global Mobile Phone Rf Filter Analysis, Insights and Forecast, 2021-2033
- 6.1. Market Analysis, Insights and Forecast - by Application
- 6.1.1. 4G Mobile Phone
- 6.1.2. 5G Mobile Phone
- 6.1.3. Others
- 6.2. Market Analysis, Insights and Forecast - by Type
- 6.2.1. SAW RF Filter
- 6.2.2. BAW RF Filter
- 6.1. Market Analysis, Insights and Forecast - by Application
- 7. North America Mobile Phone Rf Filter Analysis, Insights and Forecast, 2020-2032
- 7.1. Market Analysis, Insights and Forecast - by Application
- 7.1.1. 4G Mobile Phone
- 7.1.2. 5G Mobile Phone
- 7.1.3. Others
- 7.2. Market Analysis, Insights and Forecast - by Type
- 7.2.1. SAW RF Filter
- 7.2.2. BAW RF Filter
- 7.1. Market Analysis, Insights and Forecast - by Application
- 8. South America Mobile Phone Rf Filter Analysis, Insights and Forecast, 2020-2032
- 8.1. Market Analysis, Insights and Forecast - by Application
- 8.1.1. 4G Mobile Phone
- 8.1.2. 5G Mobile Phone
- 8.1.3. Others
- 8.2. Market Analysis, Insights and Forecast - by Type
- 8.2.1. SAW RF Filter
- 8.2.2. BAW RF Filter
- 8.1. Market Analysis, Insights and Forecast - by Application
- 9. Europe Mobile Phone Rf Filter Analysis, Insights and Forecast, 2020-2032
- 9.1. Market Analysis, Insights and Forecast - by Application
- 9.1.1. 4G Mobile Phone
- 9.1.2. 5G Mobile Phone
- 9.1.3. Others
- 9.2. Market Analysis, Insights and Forecast - by Type
- 9.2.1. SAW RF Filter
- 9.2.2. BAW RF Filter
- 9.1. Market Analysis, Insights and Forecast - by Application
- 10. Middle East & Africa Mobile Phone Rf Filter Analysis, Insights and Forecast, 2020-2032
- 10.1. Market Analysis, Insights and Forecast - by Application
- 10.1.1. 4G Mobile Phone
- 10.1.2. 5G Mobile Phone
- 10.1.3. Others
- 10.2. Market Analysis, Insights and Forecast - by Type
- 10.2.1. SAW RF Filter
- 10.2.2. BAW RF Filter
- 10.1. Market Analysis, Insights and Forecast - by Application
- 11. Asia Pacific Mobile Phone Rf Filter Analysis, Insights and Forecast, 2020-2032
- 11.1. Market Analysis, Insights and Forecast - by Application
- 11.1.1. 4G Mobile Phone
- 11.1.2. 5G Mobile Phone
- 11.1.3. Others
- 11.2. Market Analysis, Insights and Forecast - by Type
- 11.2.1. SAW RF Filter
- 11.2.2. BAW RF Filter
- 11.1. Market Analysis, Insights and Forecast - by Application
- 12. Competitive Analysis
- 12.1. Company Profiles
- 12.1.1 TDK
- 12.1.1.1. Company Overview
- 12.1.1.2. Products
- 12.1.1.3. Company Financials
- 12.1.1.4. SWOT Analysis
- 12.1.2 Murata
- 12.1.2.1. Company Overview
- 12.1.2.2. Products
- 12.1.2.3. Company Financials
- 12.1.2.4. SWOT Analysis
- 12.1.3 Taiyo Yuden
- 12.1.3.1. Company Overview
- 12.1.3.2. Products
- 12.1.3.3. Company Financials
- 12.1.3.4. SWOT Analysis
- 12.1.4 Skyworks
- 12.1.4.1. Company Overview
- 12.1.4.2. Products
- 12.1.4.3. Company Financials
- 12.1.4.4. SWOT Analysis
- 12.1.5 Qorvo
- 12.1.5.1. Company Overview
- 12.1.5.2. Products
- 12.1.5.3. Company Financials
- 12.1.5.4. SWOT Analysis
- 12.1.6 Broadcom
- 12.1.6.1. Company Overview
- 12.1.6.2. Products
- 12.1.6.3. Company Financials
- 12.1.6.4. SWOT Analysis
- 12.1.7 WISOL
- 12.1.7.1. Company Overview
- 12.1.7.2. Products
- 12.1.7.3. Company Financials
- 12.1.7.4. SWOT Analysis
- 12.1.8 Kyocera
- 12.1.8.1. Company Overview
- 12.1.8.2. Products
- 12.1.8.3. Company Financials
- 12.1.8.4. SWOT Analysis
- 12.1.1 TDK
- 12.2. Market Entropy
- 12.2.1 Company's Key Areas Served
- 12.2.2 Recent Developments
- 12.3. Company Market Share Analysis 2025
- 12.3.1 Top 5 Companies Market Share Analysis
- 12.3.2 Top 3 Companies Market Share Analysis
- 12.4. List of Potential Customers
- 13. Research Methodology
List of Figures
- Figure 1: Global Mobile Phone Rf Filter Revenue Breakdown (million, %) by Region 2025 & 2033
- Figure 2: Global Mobile Phone Rf Filter Volume Breakdown (K, %) by Region 2025 & 2033
- Figure 3: North America Mobile Phone Rf Filter Revenue (million), by Application 2025 & 2033
- Figure 4: North America Mobile Phone Rf Filter Volume (K), by Application 2025 & 2033
- Figure 5: North America Mobile Phone Rf Filter Revenue Share (%), by Application 2025 & 2033
- Figure 6: North America Mobile Phone Rf Filter Volume Share (%), by Application 2025 & 2033
- Figure 7: North America Mobile Phone Rf Filter Revenue (million), by Type 2025 & 2033
- Figure 8: North America Mobile Phone Rf Filter Volume (K), by Type 2025 & 2033
- Figure 9: North America Mobile Phone Rf Filter Revenue Share (%), by Type 2025 & 2033
- Figure 10: North America Mobile Phone Rf Filter Volume Share (%), by Type 2025 & 2033
- Figure 11: North America Mobile Phone Rf Filter Revenue (million), by Country 2025 & 2033
- Figure 12: North America Mobile Phone Rf Filter Volume (K), by Country 2025 & 2033
- Figure 13: North America Mobile Phone Rf Filter Revenue Share (%), by Country 2025 & 2033
- Figure 14: North America Mobile Phone Rf Filter Volume Share (%), by Country 2025 & 2033
- Figure 15: South America Mobile Phone Rf Filter Revenue (million), by Application 2025 & 2033
- Figure 16: South America Mobile Phone Rf Filter Volume (K), by Application 2025 & 2033
- Figure 17: South America Mobile Phone Rf Filter Revenue Share (%), by Application 2025 & 2033
- Figure 18: South America Mobile Phone Rf Filter Volume Share (%), by Application 2025 & 2033
- Figure 19: South America Mobile Phone Rf Filter Revenue (million), by Type 2025 & 2033
- Figure 20: South America Mobile Phone Rf Filter Volume (K), by Type 2025 & 2033
- Figure 21: South America Mobile Phone Rf Filter Revenue Share (%), by Type 2025 & 2033
- Figure 22: South America Mobile Phone Rf Filter Volume Share (%), by Type 2025 & 2033
- Figure 23: South America Mobile Phone Rf Filter Revenue (million), by Country 2025 & 2033
- Figure 24: South America Mobile Phone Rf Filter Volume (K), by Country 2025 & 2033
- Figure 25: South America Mobile Phone Rf Filter Revenue Share (%), by Country 2025 & 2033
- Figure 26: South America Mobile Phone Rf Filter Volume Share (%), by Country 2025 & 2033
- Figure 27: Europe Mobile Phone Rf Filter Revenue (million), by Application 2025 & 2033
- Figure 28: Europe Mobile Phone Rf Filter Volume (K), by Application 2025 & 2033
- Figure 29: Europe Mobile Phone Rf Filter Revenue Share (%), by Application 2025 & 2033
- Figure 30: Europe Mobile Phone Rf Filter Volume Share (%), by Application 2025 & 2033
- Figure 31: Europe Mobile Phone Rf Filter Revenue (million), by Type 2025 & 2033
- Figure 32: Europe Mobile Phone Rf Filter Volume (K), by Type 2025 & 2033
- Figure 33: Europe Mobile Phone Rf Filter Revenue Share (%), by Type 2025 & 2033
- Figure 34: Europe Mobile Phone Rf Filter Volume Share (%), by Type 2025 & 2033
- Figure 35: Europe Mobile Phone Rf Filter Revenue (million), by Country 2025 & 2033
- Figure 36: Europe Mobile Phone Rf Filter Volume (K), by Country 2025 & 2033
- Figure 37: Europe Mobile Phone Rf Filter Revenue Share (%), by Country 2025 & 2033
- Figure 38: Europe Mobile Phone Rf Filter Volume Share (%), by Country 2025 & 2033
- Figure 39: Middle East & Africa Mobile Phone Rf Filter Revenue (million), by Application 2025 & 2033
- Figure 40: Middle East & Africa Mobile Phone Rf Filter Volume (K), by Application 2025 & 2033
- Figure 41: Middle East & Africa Mobile Phone Rf Filter Revenue Share (%), by Application 2025 & 2033
- Figure 42: Middle East & Africa Mobile Phone Rf Filter Volume Share (%), by Application 2025 & 2033
- Figure 43: Middle East & Africa Mobile Phone Rf Filter Revenue (million), by Type 2025 & 2033
- Figure 44: Middle East & Africa Mobile Phone Rf Filter Volume (K), by Type 2025 & 2033
- Figure 45: Middle East & Africa Mobile Phone Rf Filter Revenue Share (%), by Type 2025 & 2033
- Figure 46: Middle East & Africa Mobile Phone Rf Filter Volume Share (%), by Type 2025 & 2033
- Figure 47: Middle East & Africa Mobile Phone Rf Filter Revenue (million), by Country 2025 & 2033
- Figure 48: Middle East & Africa Mobile Phone Rf Filter Volume (K), by Country 2025 & 2033
- Figure 49: Middle East & Africa Mobile Phone Rf Filter Revenue Share (%), by Country 2025 & 2033
- Figure 50: Middle East & Africa Mobile Phone Rf Filter Volume Share (%), by Country 2025 & 2033
- Figure 51: Asia Pacific Mobile Phone Rf Filter Revenue (million), by Application 2025 & 2033
- Figure 52: Asia Pacific Mobile Phone Rf Filter Volume (K), by Application 2025 & 2033
- Figure 53: Asia Pacific Mobile Phone Rf Filter Revenue Share (%), by Application 2025 & 2033
- Figure 54: Asia Pacific Mobile Phone Rf Filter Volume Share (%), by Application 2025 & 2033
- Figure 55: Asia Pacific Mobile Phone Rf Filter Revenue (million), by Type 2025 & 2033
- Figure 56: Asia Pacific Mobile Phone Rf Filter Volume (K), by Type 2025 & 2033
- Figure 57: Asia Pacific Mobile Phone Rf Filter Revenue Share (%), by Type 2025 & 2033
- Figure 58: Asia Pacific Mobile Phone Rf Filter Volume Share (%), by Type 2025 & 2033
- Figure 59: Asia Pacific Mobile Phone Rf Filter Revenue (million), by Country 2025 & 2033
- Figure 60: Asia Pacific Mobile Phone Rf Filter Volume (K), by Country 2025 & 2033
- Figure 61: Asia Pacific Mobile Phone Rf Filter Revenue Share (%), by Country 2025 & 2033
- Figure 62: Asia Pacific Mobile Phone Rf Filter Volume Share (%), by Country 2025 & 2033
List of Tables
- Table 1: Global Mobile Phone Rf Filter Revenue million Forecast, by Application 2020 & 2033
- Table 2: Global Mobile Phone Rf Filter Volume K Forecast, by Application 2020 & 2033
- Table 3: Global Mobile Phone Rf Filter Revenue million Forecast, by Type 2020 & 2033
- Table 4: Global Mobile Phone Rf Filter Volume K Forecast, by Type 2020 & 2033
- Table 5: Global Mobile Phone Rf Filter Revenue million Forecast, by Region 2020 & 2033
- Table 6: Global Mobile Phone Rf Filter Volume K Forecast, by Region 2020 & 2033
- Table 7: Global Mobile Phone Rf Filter Revenue million Forecast, by Application 2020 & 2033
- Table 8: Global Mobile Phone Rf Filter Volume K Forecast, by Application 2020 & 2033
- Table 9: Global Mobile Phone Rf Filter Revenue million Forecast, by Type 2020 & 2033
- Table 10: Global Mobile Phone Rf Filter Volume K Forecast, by Type 2020 & 2033
- Table 11: Global Mobile Phone Rf Filter Revenue million Forecast, by Country 2020 & 2033
- Table 12: Global Mobile Phone Rf Filter Volume K Forecast, by Country 2020 & 2033
- Table 13: United States Mobile Phone Rf Filter Revenue (million) Forecast, by Application 2020 & 2033
- Table 14: United States Mobile Phone Rf Filter Volume (K) Forecast, by Application 2020 & 2033
- Table 15: Canada Mobile Phone Rf Filter Revenue (million) Forecast, by Application 2020 & 2033
- Table 16: Canada Mobile Phone Rf Filter Volume (K) Forecast, by Application 2020 & 2033
- Table 17: Mexico Mobile Phone Rf Filter Revenue (million) Forecast, by Application 2020 & 2033
- Table 18: Mexico Mobile Phone Rf Filter Volume (K) Forecast, by Application 2020 & 2033
- Table 19: Global Mobile Phone Rf Filter Revenue million Forecast, by Application 2020 & 2033
- Table 20: Global Mobile Phone Rf Filter Volume K Forecast, by Application 2020 & 2033
- Table 21: Global Mobile Phone Rf Filter Revenue million Forecast, by Type 2020 & 2033
- Table 22: Global Mobile Phone Rf Filter Volume K Forecast, by Type 2020 & 2033
- Table 23: Global Mobile Phone Rf Filter Revenue million Forecast, by Country 2020 & 2033
- Table 24: Global Mobile Phone Rf Filter Volume K Forecast, by Country 2020 & 2033
- Table 25: Brazil Mobile Phone Rf Filter Revenue (million) Forecast, by Application 2020 & 2033
- Table 26: Brazil Mobile Phone Rf Filter Volume (K) Forecast, by Application 2020 & 2033
- Table 27: Argentina Mobile Phone Rf Filter Revenue (million) Forecast, by Application 2020 & 2033
- Table 28: Argentina Mobile Phone Rf Filter Volume (K) Forecast, by Application 2020 & 2033
- Table 29: Rest of South America Mobile Phone Rf Filter Revenue (million) Forecast, by Application 2020 & 2033
- Table 30: Rest of South America Mobile Phone Rf Filter Volume (K) Forecast, by Application 2020 & 2033
- Table 31: Global Mobile Phone Rf Filter Revenue million Forecast, by Application 2020 & 2033
- Table 32: Global Mobile Phone Rf Filter Volume K Forecast, by Application 2020 & 2033
- Table 33: Global Mobile Phone Rf Filter Revenue million Forecast, by Type 2020 & 2033
- Table 34: Global Mobile Phone Rf Filter Volume K Forecast, by Type 2020 & 2033
- Table 35: Global Mobile Phone Rf Filter Revenue million Forecast, by Country 2020 & 2033
- Table 36: Global Mobile Phone Rf Filter Volume K Forecast, by Country 2020 & 2033
- Table 37: United Kingdom Mobile Phone Rf Filter Revenue (million) Forecast, by Application 2020 & 2033
- Table 38: United Kingdom Mobile Phone Rf Filter Volume (K) Forecast, by Application 2020 & 2033
- Table 39: Germany Mobile Phone Rf Filter Revenue (million) Forecast, by Application 2020 & 2033
- Table 40: Germany Mobile Phone Rf Filter Volume (K) Forecast, by Application 2020 & 2033
- Table 41: France Mobile Phone Rf Filter Revenue (million) Forecast, by Application 2020 & 2033
- Table 42: France Mobile Phone Rf Filter Volume (K) Forecast, by Application 2020 & 2033
- Table 43: Italy Mobile Phone Rf Filter Revenue (million) Forecast, by Application 2020 & 2033
- Table 44: Italy Mobile Phone Rf Filter Volume (K) Forecast, by Application 2020 & 2033
- Table 45: Spain Mobile Phone Rf Filter Revenue (million) Forecast, by Application 2020 & 2033
- Table 46: Spain Mobile Phone Rf Filter Volume (K) Forecast, by Application 2020 & 2033
- Table 47: Russia Mobile Phone Rf Filter Revenue (million) Forecast, by Application 2020 & 2033
- Table 48: Russia Mobile Phone Rf Filter Volume (K) Forecast, by Application 2020 & 2033
- Table 49: Benelux Mobile Phone Rf Filter Revenue (million) Forecast, by Application 2020 & 2033
- Table 50: Benelux Mobile Phone Rf Filter Volume (K) Forecast, by Application 2020 & 2033
- Table 51: Nordics Mobile Phone Rf Filter Revenue (million) Forecast, by Application 2020 & 2033
- Table 52: Nordics Mobile Phone Rf Filter Volume (K) Forecast, by Application 2020 & 2033
- Table 53: Rest of Europe Mobile Phone Rf Filter Revenue (million) Forecast, by Application 2020 & 2033
- Table 54: Rest of Europe Mobile Phone Rf Filter Volume (K) Forecast, by Application 2020 & 2033
- Table 55: Global Mobile Phone Rf Filter Revenue million Forecast, by Application 2020 & 2033
- Table 56: Global Mobile Phone Rf Filter Volume K Forecast, by Application 2020 & 2033
- Table 57: Global Mobile Phone Rf Filter Revenue million Forecast, by Type 2020 & 2033
- Table 58: Global Mobile Phone Rf Filter Volume K Forecast, by Type 2020 & 2033
- Table 59: Global Mobile Phone Rf Filter Revenue million Forecast, by Country 2020 & 2033
- Table 60: Global Mobile Phone Rf Filter Volume K Forecast, by Country 2020 & 2033
- Table 61: Turkey Mobile Phone Rf Filter Revenue (million) Forecast, by Application 2020 & 2033
- Table 62: Turkey Mobile Phone Rf Filter Volume (K) Forecast, by Application 2020 & 2033
- Table 63: Israel Mobile Phone Rf Filter Revenue (million) Forecast, by Application 2020 & 2033
- Table 64: Israel Mobile Phone Rf Filter Volume (K) Forecast, by Application 2020 & 2033
- Table 65: GCC Mobile Phone Rf Filter Revenue (million) Forecast, by Application 2020 & 2033
- Table 66: GCC Mobile Phone Rf Filter Volume (K) Forecast, by Application 2020 & 2033
- Table 67: North Africa Mobile Phone Rf Filter Revenue (million) Forecast, by Application 2020 & 2033
- Table 68: North Africa Mobile Phone Rf Filter Volume (K) Forecast, by Application 2020 & 2033
- Table 69: South Africa Mobile Phone Rf Filter Revenue (million) Forecast, by Application 2020 & 2033
- Table 70: South Africa Mobile Phone Rf Filter Volume (K) Forecast, by Application 2020 & 2033
- Table 71: Rest of Middle East & Africa Mobile Phone Rf Filter Revenue (million) Forecast, by Application 2020 & 2033
- Table 72: Rest of Middle East & Africa Mobile Phone Rf Filter Volume (K) Forecast, by Application 2020 & 2033
- Table 73: Global Mobile Phone Rf Filter Revenue million Forecast, by Application 2020 & 2033
- Table 74: Global Mobile Phone Rf Filter Volume K Forecast, by Application 2020 & 2033
- Table 75: Global Mobile Phone Rf Filter Revenue million Forecast, by Type 2020 & 2033
- Table 76: Global Mobile Phone Rf Filter Volume K Forecast, by Type 2020 & 2033
- Table 77: Global Mobile Phone Rf Filter Revenue million Forecast, by Country 2020 & 2033
- Table 78: Global Mobile Phone Rf Filter Volume K Forecast, by Country 2020 & 2033
- Table 79: China Mobile Phone Rf Filter Revenue (million) Forecast, by Application 2020 & 2033
- Table 80: China Mobile Phone Rf Filter Volume (K) Forecast, by Application 2020 & 2033
- Table 81: India Mobile Phone Rf Filter Revenue (million) Forecast, by Application 2020 & 2033
- Table 82: India Mobile Phone Rf Filter Volume (K) Forecast, by Application 2020 & 2033
- Table 83: Japan Mobile Phone Rf Filter Revenue (million) Forecast, by Application 2020 & 2033
- Table 84: Japan Mobile Phone Rf Filter Volume (K) Forecast, by Application 2020 & 2033
- Table 85: South Korea Mobile Phone Rf Filter Revenue (million) Forecast, by Application 2020 & 2033
- Table 86: South Korea Mobile Phone Rf Filter Volume (K) Forecast, by Application 2020 & 2033
- Table 87: ASEAN Mobile Phone Rf Filter Revenue (million) Forecast, by Application 2020 & 2033
- Table 88: ASEAN Mobile Phone Rf Filter Volume (K) Forecast, by Application 2020 & 2033
- Table 89: Oceania Mobile Phone Rf Filter Revenue (million) Forecast, by Application 2020 & 2033
- Table 90: Oceania Mobile Phone Rf Filter Volume (K) Forecast, by Application 2020 & 2033
- Table 91: Rest of Asia Pacific Mobile Phone Rf Filter Revenue (million) Forecast, by Application 2020 & 2033
- Table 92: Rest of Asia Pacific Mobile Phone Rf Filter Volume (K) Forecast, by Application 2020 & 2033
Frequently Asked Questions
1. What is the projected Compound Annual Growth Rate (CAGR) of the Mobile Phone Rf Filter?
The projected CAGR is approximately 12.1%.
2. Which companies are prominent players in the Mobile Phone Rf Filter?
Key companies in the market include TDK, Murata, Taiyo Yuden, Skyworks, Qorvo, Broadcom, WISOL, Kyocera.
3. What are the main segments of the Mobile Phone Rf Filter?
The market segments include Application, Type.
4. Can you provide details about the market size?
The market size is estimated to be USD 8902 million as of 2022.
5. What are some drivers contributing to market growth?
N/A
6. What are the notable trends driving market growth?
N/A
7. Are there any restraints impacting market growth?
N/A
8. Can you provide examples of recent developments in the market?
N/A
9. What pricing options are available for accessing the report?
Pricing options include single-user, multi-user, and enterprise licenses priced at USD 3950.00, USD 5925.00, and USD 7900.00 respectively.
10. Is the market size provided in terms of value or volume?
The market size is provided in terms of value, measured in million and volume, measured in K.
11. Are there any specific market keywords associated with the report?
Yes, the market keyword associated with the report is "Mobile Phone Rf Filter," which aids in identifying and referencing the specific market segment covered.
12. How do I determine which pricing option suits my needs best?
The pricing options vary based on user requirements and access needs. Individual users may opt for single-user licenses, while businesses requiring broader access may choose multi-user or enterprise licenses for cost-effective access to the report.
13. Are there any additional resources or data provided in the Mobile Phone Rf Filter report?
While the report offers comprehensive insights, it's advisable to review the specific contents or supplementary materials provided to ascertain if additional resources or data are available.
14. How can I stay updated on further developments or reports in the Mobile Phone Rf Filter?
To stay informed about further developments, trends, and reports in the Mobile Phone Rf Filter, consider subscribing to industry newsletters, following relevant companies and organizations, or regularly checking reputable industry news sources and publications.
Methodology
Step 1 - Identification of Relevant Samples Size from Population Database


Step 2 - Approaches for Defining Global Market Size (Value, Volume* & Price*)

Note*: In applicable scenarios
Step 3 - Data Sources
Primary Research
- Web Analytics
- Survey Reports
- Research Institute
- Latest Research Reports
- Opinion Leaders
Secondary Research
- Annual Reports
- White Paper
- Latest Press Release
- Industry Association
- Paid Database
- Investor Presentations

Step 4 - Data Triangulation
Involves using different sources of information in order to increase the validity of a study
These sources are likely to be stakeholders in a program - participants, other researchers, program staff, other community members, and so on.
Then we put all data in single framework & apply various statistical tools to find out the dynamic on the market.
During the analysis stage, feedback from the stakeholder groups would be compared to determine areas of agreement as well as areas of divergence