

Key Insights
The global micro piezoelectric drivers market is experiencing significant expansion, driven by the escalating demand for precision motion control in advanced applications. Valued at $11.97 billion, this sector is projected to grow at a Compound Annual Growth Rate (CAGR) of 7.5% from the base year 2025 to 2033. This growth is primarily fueled by the widespread adoption of piezoelectric technology in sophisticated scientific instruments, such as microscopes, demanding unparalleled accuracy and miniaturization. Additionally, the expanding industrial processing equipment sector, seeking enhanced automation and precision manufacturing capabilities, is a key growth catalyst. The inherent advantages of piezoelectric drivers, including high resolution, rapid response times, and compact form factors, make them essential for applications requiring sub-nanometer positioning and swift, repeatable movements. The persistent trend of miniaturization across electronic and mechanical systems further amplifies demand for these micro-scale piezoelectric solutions.
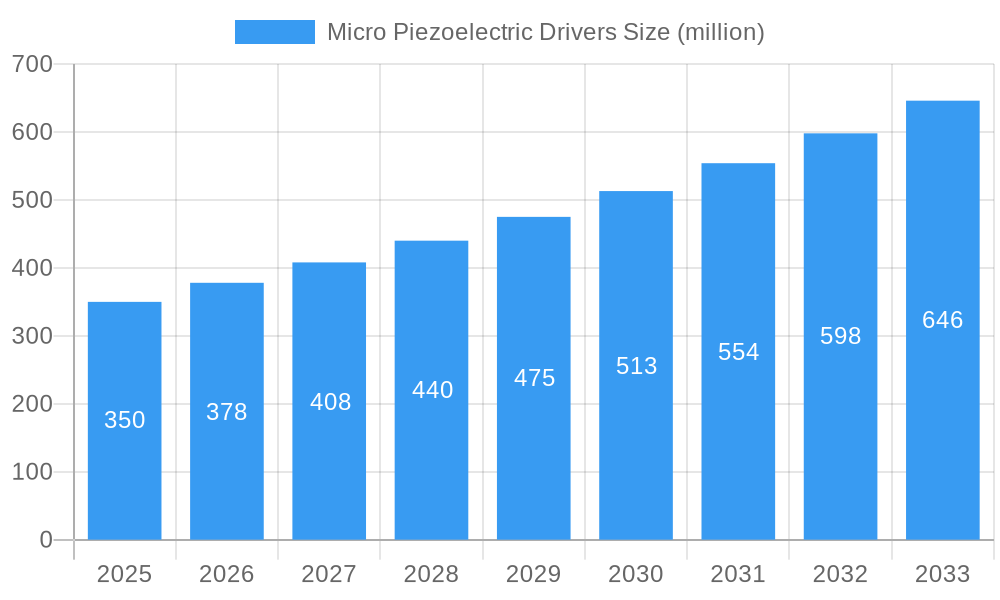
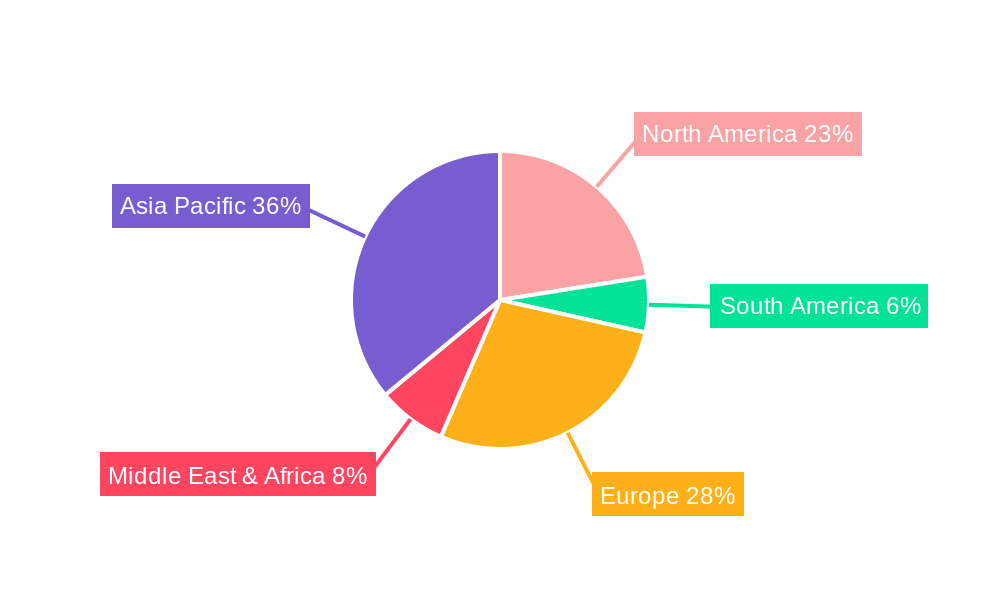
Micro Piezoelectric Drivers Market Size (In Billion)
Market innovation is characterized by a notable transition towards digital piezo drivers, offering superior control, programmability, and integration, which are gradually supplanting their analog counterparts. While significant opportunities exist, the market faces challenges such as the substantial initial investment required for advanced piezoelectric driver systems and the need for specialized integration and operational expertise. Nevertheless, ongoing research and development initiatives focused on cost reduction and user-friendliness are actively addressing these hurdles. Geographically, the Asia Pacific region, led by China and Japan, is emerging as a dominant market due to its robust manufacturing base and rapid technological adoption. North America and Europe remain crucial markets, supported by substantial R&D investments and a high concentration of advanced technology industries. Leading companies are actively pursuing strategic collaborations and product development to secure market share within this dynamic and evolving landscape.
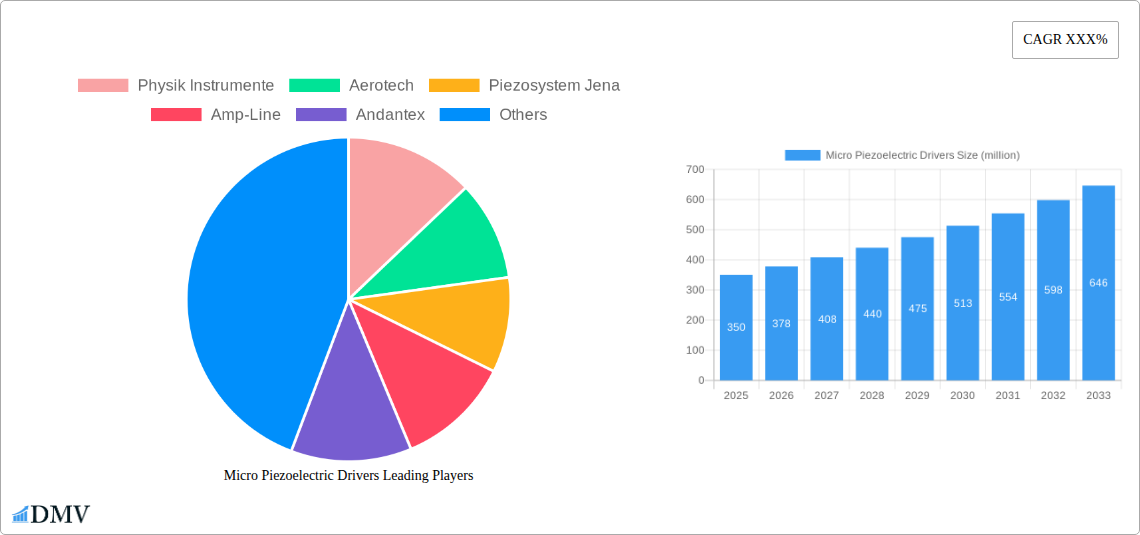
Micro Piezoelectric Drivers Company Market Share
This comprehensive report provides an in-depth analysis of the global Micro Piezoelectric Drivers market, a vital component for advanced motion control and precision actuation. Covering the period from 2019 to 2033, with 2025 designated as the base and estimated year, this report explores market dynamics, technological advancements, regional leadership, and future projections. Stakeholders seeking to understand the intricate landscape of micro piezoelectric drivers will find actionable insights, market intelligence, and strategic forecasting within this report.
Micro Piezoelectric Drivers Market Composition & Trends
The Micro Piezoelectric Drivers market exhibits a moderate concentration, with key players like Physik Instrumente, Aerotech, and Piezosystem Jena holding significant market share, estimated at over $800 million collectively in 2025. Innovation remains a primary catalyst, driven by advancements in miniaturization, higher power density, and improved control algorithms. Regulatory landscapes are gradually evolving, with a growing emphasis on safety and performance standards in sensitive applications like medical devices. Substitute products, such as solenoid actuators, exist but often lack the precision and responsiveness of piezoelectric solutions. End-user profiles span diverse sectors, including research institutions and manufacturers in high-tech industries. Mergers and acquisitions (M&A) are a notable trend, with several strategic deals anticipated to further consolidate the market, potentially reaching transaction values in the tens of millions.
- Market Concentration: Moderate, with a few dominant players.
- Innovation Drivers: Miniaturization, power density, advanced control.
- Regulatory Impact: Increasing focus on safety and performance standards.
- Substitute Products: Solenoid actuators, though with limitations.
- End-User Segmentation: Research, medical, industrial automation, optics.
- M&A Activity: Strategic consolidation expected, with deal values in the tens of millions.
Micro Piezoelectric Drivers Industry Evolution
The Micro Piezoelectric Drivers industry has witnessed substantial evolution throughout the historical period of 2019–2024, driven by relentless technological innovation and the ever-increasing demand for precision motion control across a multitude of applications. The market is projected to experience robust growth, with an estimated compound annual growth rate (CAGR) of approximately 7.5% from 2025 to 2033, reaching a market size exceeding $2,500 million by 2033. This expansion is underpinned by significant technological advancements, including the development of higher resolution drivers, improved piezoelectric materials with enhanced performance characteristics, and more sophisticated digital control interfaces. The shift towards miniaturization in electronics and automation has further fueled the adoption of micro piezoelectric drivers, enabling more compact and efficient designs. Consumer demand is increasingly leaning towards higher precision, faster response times, and lower power consumption, all areas where piezoelectric technology excels. The integration of advanced algorithms for closed-loop control and self-optimization is also becoming a standard feature, enhancing the overall utility and performance of these drivers. The increasing complexity of industrial processes, the advancements in scientific research requiring ultra-precise manipulation, and the burgeoning fields of advanced optics and printing technologies are all contributing to the sustained upward trajectory of the micro piezoelectric drivers market. For instance, adoption metrics in the optical measurement segment alone are projected to grow by over 20% annually in the coming years, reflecting the critical role of these drivers in cutting-edge instrumentation. The market's growth trajectory is clearly positive, with technological breakthroughs continuously pushing the boundaries of what is possible in precision actuation.
Leading Regions, Countries, or Segments in Micro Piezoelectric Drivers
North America and Europe are poised to lead the Micro Piezoelectric Drivers market, driven by significant investments in research and development, a strong presence of advanced manufacturing industries, and supportive government initiatives promoting technological innovation. The United States, in particular, stands out due to its robust semiconductor, aerospace, and biotechnology sectors, all of which are major consumers of high-precision motion control solutions. Germany, a hub for industrial automation and precision engineering, also plays a pivotal role in Europe. Within applications, the Microscope segment is expected to demonstrate exceptional growth, projected to account for over 30% of the market share by 2033. This surge is fueled by the increasing demand for advanced microscopy techniques in life sciences, materials science, and semiconductor inspection.
- Dominant Regions: North America (USA) and Europe (Germany).
- Key Drivers in Leading Regions:
- Investment Trends: High R&D expenditure in advanced manufacturing and scientific research.
- Regulatory Support: Government grants and policies encouraging technological adoption.
- Industry Ecosystem: Strong presence of key end-user industries (semiconductor, biotech, aerospace).
- Dominant Application Segment: Microscope.
- Market Share Projection: Over 30% by 2033.
- Growth Catalysts:
- Advancements in life sciences and materials research.
- Need for ultra-high resolution imaging in semiconductor inspection.
- Development of novel diagnostic and analytical tools.
- Dominant Type: Digital Piezo Driver.
- Market Share Projection: Expected to capture over 60% of the market by 2033.
- Growth Catalysts:
- Superior control accuracy and ease of integration with digital systems.
- Enhanced programmability and advanced motion profiling capabilities.
- Miniaturization and power efficiency advantages.
Micro Piezoelectric Drivers Product Innovations
Recent product innovations in micro piezoelectric drivers are centered on enhancing precision, speed, and miniaturization. Manufacturers are introducing digital piezo drivers with integrated closed-loop feedback systems for sub-nanometer resolution, crucial for applications like atomic force microscopy and advanced semiconductor lithography. New materials are enabling drivers with higher bandwidth and greater force output in smaller footprints, opening doors for more compact and portable optical measurement devices and high-speed industrial printers. For instance, enhanced voltage-to-displacement linearity and reduced hysteresis are key performance metrics being achieved, directly translating to improved product quality and reliability in end-user systems.
Propelling Factors for Micro Piezoelectric Drivers Growth
The growth of the micro piezoelectric drivers market is propelled by several interconnected factors. Technologically, the relentless pursuit of higher precision and faster actuation speeds in fields like semiconductor manufacturing, advanced optics, and medical diagnostics is a primary driver. Economically, the increasing automation across industries, from sophisticated robotic assembly lines to precision packaging, necessitates reliable and compact motion control. Regulatory advancements, particularly in the medical device sector, are mandating higher levels of accuracy and control, further boosting the demand for piezoelectric solutions. The continuous miniaturization trend across all electronic devices also favors the development and adoption of smaller, more powerful piezoelectric drivers.
Obstacles in the Micro Piezoelectric Drivers Market
Despite the positive growth outlook, the micro piezoelectric drivers market faces several obstacles. High manufacturing costs associated with specialized materials and precision engineering can limit widespread adoption, especially in price-sensitive applications. Supply chain disruptions for critical raw materials can lead to production delays and increased costs. Furthermore, the need for specialized knowledge in system integration and control algorithms can pose a barrier for some potential end-users. The presence of alternative actuation technologies, while often less precise, can also present competitive pressure in certain market segments, potentially impacting market share by a few percentage points.
Future Opportunities in Micro Piezoelectric Drivers
Emerging opportunities for micro piezoelectric drivers lie in the expansion of applications within the Internet of Things (IoT) ecosystem, where miniature, low-power actuators are essential for smart devices. The burgeoning field of additive manufacturing (3D printing) for complex geometries and biocompatible materials presents a significant avenue for growth, requiring high-precision material deposition. Furthermore, the development of next-generation scientific instruments for space exploration and advanced environmental monitoring will create demand for robust and highly accurate piezoelectric systems capable of operating in extreme conditions. The healthcare sector's continued innovation in minimally invasive surgery and personalized medicine also offers substantial future potential.
Major Players in the Micro Piezoelectric Drivers Ecosystem
- Physik Instrumente
- Aerotech
- Piezosystem Jena
- Amp-Line
- Andantex
- Columbia Research Labs
- ENDAQ
- Mad City Labs
- Dynamic Structures & Materials
- Kistler Group
- TRINAMIC Motion Control GmbH
- Matsusada Precision
Key Developments in Micro Piezoelectric Drivers Industry
- 2023/08: Physik Instrumente launches a new generation of high-performance digital piezo controllers, enhancing precision control for optical systems.
- 2023/05: Aerotech introduces ultra-compact linear piezo stages designed for semiconductor wafer inspection, improving throughput.
- 2022/11: Piezosystem Jena showcases advancements in piezo actuators for micro-dispensing applications in medical diagnostics.
- 2022/07: Mad City Labs releases a new family of high-speed, closed-loop piezo scanners for advanced microscopy, enabling faster data acquisition.
- 2021/12: Kistler Group acquires a specialist in piezo sensor technology, strengthening its portfolio in measurement and control solutions.
Strategic Micro Piezoelectric Drivers Market Forecast
The strategic outlook for the Micro Piezoelectric Drivers market remains exceptionally strong, driven by the escalating need for precision and miniaturization across a vast array of high-growth industries. Future opportunities will be significantly shaped by advancements in digital control technologies, the integration of artificial intelligence for optimized motion profiling, and the expansion of applications in emerging sectors like quantum computing and advanced robotics. Continued investment in R&D by major players is expected to yield innovative solutions, further solidifying the market's growth trajectory and its indispensable role in enabling next-generation technologies. The market is projected to continue its upward momentum, exceeding $2,500 million by 2033.
Micro Piezoelectric Drivers Segmentation
-
1. Application
- 1.1. Microscope
- 1.2. Industrial Processing Equipment
- 1.3. Optical Measurement
- 1.4. Printer
- 1.5. Others
-
2. Type
- 2.1. Digital Piezo Driver
- 2.2. Analog Piezo Driver
Micro Piezoelectric Drivers Segmentation By Geography
-
1. North America
- 1.1. United States
- 1.2. Canada
- 1.3. Mexico
-
2. South America
- 2.1. Brazil
- 2.2. Argentina
- 2.3. Rest of South America
-
3. Europe
- 3.1. United Kingdom
- 3.2. Germany
- 3.3. France
- 3.4. Italy
- 3.5. Spain
- 3.6. Russia
- 3.7. Benelux
- 3.8. Nordics
- 3.9. Rest of Europe
-
4. Middle East & Africa
- 4.1. Turkey
- 4.2. Israel
- 4.3. GCC
- 4.4. North Africa
- 4.5. South Africa
- 4.6. Rest of Middle East & Africa
-
5. Asia Pacific
- 5.1. China
- 5.2. India
- 5.3. Japan
- 5.4. South Korea
- 5.5. ASEAN
- 5.6. Oceania
- 5.7. Rest of Asia Pacific
Micro Piezoelectric Drivers Regional Market Share
Geographic Coverage of Micro Piezoelectric Drivers
Micro Piezoelectric Drivers REPORT HIGHLIGHTS
| Aspects | Details |
|---|---|
| Study Period | 2020-2034 |
| Base Year | 2025 |
| Estimated Year | 2026 |
| Forecast Period | 2026-2034 |
| Historical Period | 2020-2025 |
| Growth Rate | CAGR of 7.5% from 2020-2034 |
| Segmentation |
|
Table of Contents
- 1. Introduction
- 1.1. Research Scope
- 1.2. Market Segmentation
- 1.3. Research Objective
- 1.4. Definitions and Assumptions
- 2. Executive Summary
- 2.1. Market Snapshot
- 3. Market Dynamics
- 3.1. Market Drivers
- 3.2. Market Restrains
- 3.3. Market Trends
- 3.4. Market Opportunities
- 4. Market Factor Analysis
- 4.1. Porters Five Forces
- 4.1.1. Bargaining Power of Suppliers
- 4.1.2. Bargaining Power of Buyers
- 4.1.3. Threat of New Entrants
- 4.1.4. Threat of Substitutes
- 4.1.5. Competitive Rivalry
- 4.2. PESTEL analysis
- 4.3. BCG Analysis
- 4.3.1. Stars (High Growth, High Market Share)
- 4.3.2. Cash Cows (Low Growth, High Market Share)
- 4.3.3. Question Mark (High Growth, Low Market Share)
- 4.3.4. Dogs (Low Growth, Low Market Share)
- 4.4. Ansoff Matrix Analysis
- 4.5. Supply Chain Analysis
- 4.6. Regulatory Landscape
- 4.7. Current Market Potential and Opportunity Assessment (TAM–SAM–SOM Framework)
- 4.8. DMV Analyst Note
- 4.1. Porters Five Forces
- 5. Market Analysis, Insights and Forecast 2021-2033
- 5.1. Market Analysis, Insights and Forecast - by Application
- 5.1.1. Microscope
- 5.1.2. Industrial Processing Equipment
- 5.1.3. Optical Measurement
- 5.1.4. Printer
- 5.1.5. Others
- 5.2. Market Analysis, Insights and Forecast - by Type
- 5.2.1. Digital Piezo Driver
- 5.2.2. Analog Piezo Driver
- 5.3. Market Analysis, Insights and Forecast - by Region
- 5.3.1. North America
- 5.3.2. South America
- 5.3.3. Europe
- 5.3.4. Middle East & Africa
- 5.3.5. Asia Pacific
- 5.1. Market Analysis, Insights and Forecast - by Application
- 6. Global Micro Piezoelectric Drivers Analysis, Insights and Forecast, 2021-2033
- 6.1. Market Analysis, Insights and Forecast - by Application
- 6.1.1. Microscope
- 6.1.2. Industrial Processing Equipment
- 6.1.3. Optical Measurement
- 6.1.4. Printer
- 6.1.5. Others
- 6.2. Market Analysis, Insights and Forecast - by Type
- 6.2.1. Digital Piezo Driver
- 6.2.2. Analog Piezo Driver
- 6.1. Market Analysis, Insights and Forecast - by Application
- 7. North America Micro Piezoelectric Drivers Analysis, Insights and Forecast, 2020-2032
- 7.1. Market Analysis, Insights and Forecast - by Application
- 7.1.1. Microscope
- 7.1.2. Industrial Processing Equipment
- 7.1.3. Optical Measurement
- 7.1.4. Printer
- 7.1.5. Others
- 7.2. Market Analysis, Insights and Forecast - by Type
- 7.2.1. Digital Piezo Driver
- 7.2.2. Analog Piezo Driver
- 7.1. Market Analysis, Insights and Forecast - by Application
- 8. South America Micro Piezoelectric Drivers Analysis, Insights and Forecast, 2020-2032
- 8.1. Market Analysis, Insights and Forecast - by Application
- 8.1.1. Microscope
- 8.1.2. Industrial Processing Equipment
- 8.1.3. Optical Measurement
- 8.1.4. Printer
- 8.1.5. Others
- 8.2. Market Analysis, Insights and Forecast - by Type
- 8.2.1. Digital Piezo Driver
- 8.2.2. Analog Piezo Driver
- 8.1. Market Analysis, Insights and Forecast - by Application
- 9. Europe Micro Piezoelectric Drivers Analysis, Insights and Forecast, 2020-2032
- 9.1. Market Analysis, Insights and Forecast - by Application
- 9.1.1. Microscope
- 9.1.2. Industrial Processing Equipment
- 9.1.3. Optical Measurement
- 9.1.4. Printer
- 9.1.5. Others
- 9.2. Market Analysis, Insights and Forecast - by Type
- 9.2.1. Digital Piezo Driver
- 9.2.2. Analog Piezo Driver
- 9.1. Market Analysis, Insights and Forecast - by Application
- 10. Middle East & Africa Micro Piezoelectric Drivers Analysis, Insights and Forecast, 2020-2032
- 10.1. Market Analysis, Insights and Forecast - by Application
- 10.1.1. Microscope
- 10.1.2. Industrial Processing Equipment
- 10.1.3. Optical Measurement
- 10.1.4. Printer
- 10.1.5. Others
- 10.2. Market Analysis, Insights and Forecast - by Type
- 10.2.1. Digital Piezo Driver
- 10.2.2. Analog Piezo Driver
- 10.1. Market Analysis, Insights and Forecast - by Application
- 11. Asia Pacific Micro Piezoelectric Drivers Analysis, Insights and Forecast, 2020-2032
- 11.1. Market Analysis, Insights and Forecast - by Application
- 11.1.1. Microscope
- 11.1.2. Industrial Processing Equipment
- 11.1.3. Optical Measurement
- 11.1.4. Printer
- 11.1.5. Others
- 11.2. Market Analysis, Insights and Forecast - by Type
- 11.2.1. Digital Piezo Driver
- 11.2.2. Analog Piezo Driver
- 11.1. Market Analysis, Insights and Forecast - by Application
- 12. Competitive Analysis
- 12.1. Company Profiles
- 12.1.1 Physik Instrumente
- 12.1.1.1. Company Overview
- 12.1.1.2. Products
- 12.1.1.3. Company Financials
- 12.1.1.4. SWOT Analysis
- 12.1.2 Aerotech
- 12.1.2.1. Company Overview
- 12.1.2.2. Products
- 12.1.2.3. Company Financials
- 12.1.2.4. SWOT Analysis
- 12.1.3 Piezosystem Jena
- 12.1.3.1. Company Overview
- 12.1.3.2. Products
- 12.1.3.3. Company Financials
- 12.1.3.4. SWOT Analysis
- 12.1.4 Amp-Line
- 12.1.4.1. Company Overview
- 12.1.4.2. Products
- 12.1.4.3. Company Financials
- 12.1.4.4. SWOT Analysis
- 12.1.5 Andantex
- 12.1.5.1. Company Overview
- 12.1.5.2. Products
- 12.1.5.3. Company Financials
- 12.1.5.4. SWOT Analysis
- 12.1.6 Columbia Research Labs
- 12.1.6.1. Company Overview
- 12.1.6.2. Products
- 12.1.6.3. Company Financials
- 12.1.6.4. SWOT Analysis
- 12.1.7 ENDAQ
- 12.1.7.1. Company Overview
- 12.1.7.2. Products
- 12.1.7.3. Company Financials
- 12.1.7.4. SWOT Analysis
- 12.1.8 Mad City Labs
- 12.1.8.1. Company Overview
- 12.1.8.2. Products
- 12.1.8.3. Company Financials
- 12.1.8.4. SWOT Analysis
- 12.1.9 Dynamic Structures & Materials
- 12.1.9.1. Company Overview
- 12.1.9.2. Products
- 12.1.9.3. Company Financials
- 12.1.9.4. SWOT Analysis
- 12.1.10 Kistler Group
- 12.1.10.1. Company Overview
- 12.1.10.2. Products
- 12.1.10.3. Company Financials
- 12.1.10.4. SWOT Analysis
- 12.1.11 TRINAMIC Motion Control GmbH
- 12.1.11.1. Company Overview
- 12.1.11.2. Products
- 12.1.11.3. Company Financials
- 12.1.11.4. SWOT Analysis
- 12.1.12 Matsusada Precision
- 12.1.12.1. Company Overview
- 12.1.12.2. Products
- 12.1.12.3. Company Financials
- 12.1.12.4. SWOT Analysis
- 12.1.1 Physik Instrumente
- 12.2. Market Entropy
- 12.2.1 Company's Key Areas Served
- 12.2.2 Recent Developments
- 12.3. Company Market Share Analysis 2025
- 12.3.1 Top 5 Companies Market Share Analysis
- 12.3.2 Top 3 Companies Market Share Analysis
- 12.4. List of Potential Customers
- 13. Research Methodology
List of Figures
- Figure 1: Global Micro Piezoelectric Drivers Revenue Breakdown (billion, %) by Region 2025 & 2033
- Figure 2: Global Micro Piezoelectric Drivers Volume Breakdown (K, %) by Region 2025 & 2033
- Figure 3: North America Micro Piezoelectric Drivers Revenue (billion), by Application 2025 & 2033
- Figure 4: North America Micro Piezoelectric Drivers Volume (K), by Application 2025 & 2033
- Figure 5: North America Micro Piezoelectric Drivers Revenue Share (%), by Application 2025 & 2033
- Figure 6: North America Micro Piezoelectric Drivers Volume Share (%), by Application 2025 & 2033
- Figure 7: North America Micro Piezoelectric Drivers Revenue (billion), by Type 2025 & 2033
- Figure 8: North America Micro Piezoelectric Drivers Volume (K), by Type 2025 & 2033
- Figure 9: North America Micro Piezoelectric Drivers Revenue Share (%), by Type 2025 & 2033
- Figure 10: North America Micro Piezoelectric Drivers Volume Share (%), by Type 2025 & 2033
- Figure 11: North America Micro Piezoelectric Drivers Revenue (billion), by Country 2025 & 2033
- Figure 12: North America Micro Piezoelectric Drivers Volume (K), by Country 2025 & 2033
- Figure 13: North America Micro Piezoelectric Drivers Revenue Share (%), by Country 2025 & 2033
- Figure 14: North America Micro Piezoelectric Drivers Volume Share (%), by Country 2025 & 2033
- Figure 15: South America Micro Piezoelectric Drivers Revenue (billion), by Application 2025 & 2033
- Figure 16: South America Micro Piezoelectric Drivers Volume (K), by Application 2025 & 2033
- Figure 17: South America Micro Piezoelectric Drivers Revenue Share (%), by Application 2025 & 2033
- Figure 18: South America Micro Piezoelectric Drivers Volume Share (%), by Application 2025 & 2033
- Figure 19: South America Micro Piezoelectric Drivers Revenue (billion), by Type 2025 & 2033
- Figure 20: South America Micro Piezoelectric Drivers Volume (K), by Type 2025 & 2033
- Figure 21: South America Micro Piezoelectric Drivers Revenue Share (%), by Type 2025 & 2033
- Figure 22: South America Micro Piezoelectric Drivers Volume Share (%), by Type 2025 & 2033
- Figure 23: South America Micro Piezoelectric Drivers Revenue (billion), by Country 2025 & 2033
- Figure 24: South America Micro Piezoelectric Drivers Volume (K), by Country 2025 & 2033
- Figure 25: South America Micro Piezoelectric Drivers Revenue Share (%), by Country 2025 & 2033
- Figure 26: South America Micro Piezoelectric Drivers Volume Share (%), by Country 2025 & 2033
- Figure 27: Europe Micro Piezoelectric Drivers Revenue (billion), by Application 2025 & 2033
- Figure 28: Europe Micro Piezoelectric Drivers Volume (K), by Application 2025 & 2033
- Figure 29: Europe Micro Piezoelectric Drivers Revenue Share (%), by Application 2025 & 2033
- Figure 30: Europe Micro Piezoelectric Drivers Volume Share (%), by Application 2025 & 2033
- Figure 31: Europe Micro Piezoelectric Drivers Revenue (billion), by Type 2025 & 2033
- Figure 32: Europe Micro Piezoelectric Drivers Volume (K), by Type 2025 & 2033
- Figure 33: Europe Micro Piezoelectric Drivers Revenue Share (%), by Type 2025 & 2033
- Figure 34: Europe Micro Piezoelectric Drivers Volume Share (%), by Type 2025 & 2033
- Figure 35: Europe Micro Piezoelectric Drivers Revenue (billion), by Country 2025 & 2033
- Figure 36: Europe Micro Piezoelectric Drivers Volume (K), by Country 2025 & 2033
- Figure 37: Europe Micro Piezoelectric Drivers Revenue Share (%), by Country 2025 & 2033
- Figure 38: Europe Micro Piezoelectric Drivers Volume Share (%), by Country 2025 & 2033
- Figure 39: Middle East & Africa Micro Piezoelectric Drivers Revenue (billion), by Application 2025 & 2033
- Figure 40: Middle East & Africa Micro Piezoelectric Drivers Volume (K), by Application 2025 & 2033
- Figure 41: Middle East & Africa Micro Piezoelectric Drivers Revenue Share (%), by Application 2025 & 2033
- Figure 42: Middle East & Africa Micro Piezoelectric Drivers Volume Share (%), by Application 2025 & 2033
- Figure 43: Middle East & Africa Micro Piezoelectric Drivers Revenue (billion), by Type 2025 & 2033
- Figure 44: Middle East & Africa Micro Piezoelectric Drivers Volume (K), by Type 2025 & 2033
- Figure 45: Middle East & Africa Micro Piezoelectric Drivers Revenue Share (%), by Type 2025 & 2033
- Figure 46: Middle East & Africa Micro Piezoelectric Drivers Volume Share (%), by Type 2025 & 2033
- Figure 47: Middle East & Africa Micro Piezoelectric Drivers Revenue (billion), by Country 2025 & 2033
- Figure 48: Middle East & Africa Micro Piezoelectric Drivers Volume (K), by Country 2025 & 2033
- Figure 49: Middle East & Africa Micro Piezoelectric Drivers Revenue Share (%), by Country 2025 & 2033
- Figure 50: Middle East & Africa Micro Piezoelectric Drivers Volume Share (%), by Country 2025 & 2033
- Figure 51: Asia Pacific Micro Piezoelectric Drivers Revenue (billion), by Application 2025 & 2033
- Figure 52: Asia Pacific Micro Piezoelectric Drivers Volume (K), by Application 2025 & 2033
- Figure 53: Asia Pacific Micro Piezoelectric Drivers Revenue Share (%), by Application 2025 & 2033
- Figure 54: Asia Pacific Micro Piezoelectric Drivers Volume Share (%), by Application 2025 & 2033
- Figure 55: Asia Pacific Micro Piezoelectric Drivers Revenue (billion), by Type 2025 & 2033
- Figure 56: Asia Pacific Micro Piezoelectric Drivers Volume (K), by Type 2025 & 2033
- Figure 57: Asia Pacific Micro Piezoelectric Drivers Revenue Share (%), by Type 2025 & 2033
- Figure 58: Asia Pacific Micro Piezoelectric Drivers Volume Share (%), by Type 2025 & 2033
- Figure 59: Asia Pacific Micro Piezoelectric Drivers Revenue (billion), by Country 2025 & 2033
- Figure 60: Asia Pacific Micro Piezoelectric Drivers Volume (K), by Country 2025 & 2033
- Figure 61: Asia Pacific Micro Piezoelectric Drivers Revenue Share (%), by Country 2025 & 2033
- Figure 62: Asia Pacific Micro Piezoelectric Drivers Volume Share (%), by Country 2025 & 2033
List of Tables
- Table 1: Global Micro Piezoelectric Drivers Revenue billion Forecast, by Application 2020 & 2033
- Table 2: Global Micro Piezoelectric Drivers Volume K Forecast, by Application 2020 & 2033
- Table 3: Global Micro Piezoelectric Drivers Revenue billion Forecast, by Type 2020 & 2033
- Table 4: Global Micro Piezoelectric Drivers Volume K Forecast, by Type 2020 & 2033
- Table 5: Global Micro Piezoelectric Drivers Revenue billion Forecast, by Region 2020 & 2033
- Table 6: Global Micro Piezoelectric Drivers Volume K Forecast, by Region 2020 & 2033
- Table 7: Global Micro Piezoelectric Drivers Revenue billion Forecast, by Application 2020 & 2033
- Table 8: Global Micro Piezoelectric Drivers Volume K Forecast, by Application 2020 & 2033
- Table 9: Global Micro Piezoelectric Drivers Revenue billion Forecast, by Type 2020 & 2033
- Table 10: Global Micro Piezoelectric Drivers Volume K Forecast, by Type 2020 & 2033
- Table 11: Global Micro Piezoelectric Drivers Revenue billion Forecast, by Country 2020 & 2033
- Table 12: Global Micro Piezoelectric Drivers Volume K Forecast, by Country 2020 & 2033
- Table 13: United States Micro Piezoelectric Drivers Revenue (billion) Forecast, by Application 2020 & 2033
- Table 14: United States Micro Piezoelectric Drivers Volume (K) Forecast, by Application 2020 & 2033
- Table 15: Canada Micro Piezoelectric Drivers Revenue (billion) Forecast, by Application 2020 & 2033
- Table 16: Canada Micro Piezoelectric Drivers Volume (K) Forecast, by Application 2020 & 2033
- Table 17: Mexico Micro Piezoelectric Drivers Revenue (billion) Forecast, by Application 2020 & 2033
- Table 18: Mexico Micro Piezoelectric Drivers Volume (K) Forecast, by Application 2020 & 2033
- Table 19: Global Micro Piezoelectric Drivers Revenue billion Forecast, by Application 2020 & 2033
- Table 20: Global Micro Piezoelectric Drivers Volume K Forecast, by Application 2020 & 2033
- Table 21: Global Micro Piezoelectric Drivers Revenue billion Forecast, by Type 2020 & 2033
- Table 22: Global Micro Piezoelectric Drivers Volume K Forecast, by Type 2020 & 2033
- Table 23: Global Micro Piezoelectric Drivers Revenue billion Forecast, by Country 2020 & 2033
- Table 24: Global Micro Piezoelectric Drivers Volume K Forecast, by Country 2020 & 2033
- Table 25: Brazil Micro Piezoelectric Drivers Revenue (billion) Forecast, by Application 2020 & 2033
- Table 26: Brazil Micro Piezoelectric Drivers Volume (K) Forecast, by Application 2020 & 2033
- Table 27: Argentina Micro Piezoelectric Drivers Revenue (billion) Forecast, by Application 2020 & 2033
- Table 28: Argentina Micro Piezoelectric Drivers Volume (K) Forecast, by Application 2020 & 2033
- Table 29: Rest of South America Micro Piezoelectric Drivers Revenue (billion) Forecast, by Application 2020 & 2033
- Table 30: Rest of South America Micro Piezoelectric Drivers Volume (K) Forecast, by Application 2020 & 2033
- Table 31: Global Micro Piezoelectric Drivers Revenue billion Forecast, by Application 2020 & 2033
- Table 32: Global Micro Piezoelectric Drivers Volume K Forecast, by Application 2020 & 2033
- Table 33: Global Micro Piezoelectric Drivers Revenue billion Forecast, by Type 2020 & 2033
- Table 34: Global Micro Piezoelectric Drivers Volume K Forecast, by Type 2020 & 2033
- Table 35: Global Micro Piezoelectric Drivers Revenue billion Forecast, by Country 2020 & 2033
- Table 36: Global Micro Piezoelectric Drivers Volume K Forecast, by Country 2020 & 2033
- Table 37: United Kingdom Micro Piezoelectric Drivers Revenue (billion) Forecast, by Application 2020 & 2033
- Table 38: United Kingdom Micro Piezoelectric Drivers Volume (K) Forecast, by Application 2020 & 2033
- Table 39: Germany Micro Piezoelectric Drivers Revenue (billion) Forecast, by Application 2020 & 2033
- Table 40: Germany Micro Piezoelectric Drivers Volume (K) Forecast, by Application 2020 & 2033
- Table 41: France Micro Piezoelectric Drivers Revenue (billion) Forecast, by Application 2020 & 2033
- Table 42: France Micro Piezoelectric Drivers Volume (K) Forecast, by Application 2020 & 2033
- Table 43: Italy Micro Piezoelectric Drivers Revenue (billion) Forecast, by Application 2020 & 2033
- Table 44: Italy Micro Piezoelectric Drivers Volume (K) Forecast, by Application 2020 & 2033
- Table 45: Spain Micro Piezoelectric Drivers Revenue (billion) Forecast, by Application 2020 & 2033
- Table 46: Spain Micro Piezoelectric Drivers Volume (K) Forecast, by Application 2020 & 2033
- Table 47: Russia Micro Piezoelectric Drivers Revenue (billion) Forecast, by Application 2020 & 2033
- Table 48: Russia Micro Piezoelectric Drivers Volume (K) Forecast, by Application 2020 & 2033
- Table 49: Benelux Micro Piezoelectric Drivers Revenue (billion) Forecast, by Application 2020 & 2033
- Table 50: Benelux Micro Piezoelectric Drivers Volume (K) Forecast, by Application 2020 & 2033
- Table 51: Nordics Micro Piezoelectric Drivers Revenue (billion) Forecast, by Application 2020 & 2033
- Table 52: Nordics Micro Piezoelectric Drivers Volume (K) Forecast, by Application 2020 & 2033
- Table 53: Rest of Europe Micro Piezoelectric Drivers Revenue (billion) Forecast, by Application 2020 & 2033
- Table 54: Rest of Europe Micro Piezoelectric Drivers Volume (K) Forecast, by Application 2020 & 2033
- Table 55: Global Micro Piezoelectric Drivers Revenue billion Forecast, by Application 2020 & 2033
- Table 56: Global Micro Piezoelectric Drivers Volume K Forecast, by Application 2020 & 2033
- Table 57: Global Micro Piezoelectric Drivers Revenue billion Forecast, by Type 2020 & 2033
- Table 58: Global Micro Piezoelectric Drivers Volume K Forecast, by Type 2020 & 2033
- Table 59: Global Micro Piezoelectric Drivers Revenue billion Forecast, by Country 2020 & 2033
- Table 60: Global Micro Piezoelectric Drivers Volume K Forecast, by Country 2020 & 2033
- Table 61: Turkey Micro Piezoelectric Drivers Revenue (billion) Forecast, by Application 2020 & 2033
- Table 62: Turkey Micro Piezoelectric Drivers Volume (K) Forecast, by Application 2020 & 2033
- Table 63: Israel Micro Piezoelectric Drivers Revenue (billion) Forecast, by Application 2020 & 2033
- Table 64: Israel Micro Piezoelectric Drivers Volume (K) Forecast, by Application 2020 & 2033
- Table 65: GCC Micro Piezoelectric Drivers Revenue (billion) Forecast, by Application 2020 & 2033
- Table 66: GCC Micro Piezoelectric Drivers Volume (K) Forecast, by Application 2020 & 2033
- Table 67: North Africa Micro Piezoelectric Drivers Revenue (billion) Forecast, by Application 2020 & 2033
- Table 68: North Africa Micro Piezoelectric Drivers Volume (K) Forecast, by Application 2020 & 2033
- Table 69: South Africa Micro Piezoelectric Drivers Revenue (billion) Forecast, by Application 2020 & 2033
- Table 70: South Africa Micro Piezoelectric Drivers Volume (K) Forecast, by Application 2020 & 2033
- Table 71: Rest of Middle East & Africa Micro Piezoelectric Drivers Revenue (billion) Forecast, by Application 2020 & 2033
- Table 72: Rest of Middle East & Africa Micro Piezoelectric Drivers Volume (K) Forecast, by Application 2020 & 2033
- Table 73: Global Micro Piezoelectric Drivers Revenue billion Forecast, by Application 2020 & 2033
- Table 74: Global Micro Piezoelectric Drivers Volume K Forecast, by Application 2020 & 2033
- Table 75: Global Micro Piezoelectric Drivers Revenue billion Forecast, by Type 2020 & 2033
- Table 76: Global Micro Piezoelectric Drivers Volume K Forecast, by Type 2020 & 2033
- Table 77: Global Micro Piezoelectric Drivers Revenue billion Forecast, by Country 2020 & 2033
- Table 78: Global Micro Piezoelectric Drivers Volume K Forecast, by Country 2020 & 2033
- Table 79: China Micro Piezoelectric Drivers Revenue (billion) Forecast, by Application 2020 & 2033
- Table 80: China Micro Piezoelectric Drivers Volume (K) Forecast, by Application 2020 & 2033
- Table 81: India Micro Piezoelectric Drivers Revenue (billion) Forecast, by Application 2020 & 2033
- Table 82: India Micro Piezoelectric Drivers Volume (K) Forecast, by Application 2020 & 2033
- Table 83: Japan Micro Piezoelectric Drivers Revenue (billion) Forecast, by Application 2020 & 2033
- Table 84: Japan Micro Piezoelectric Drivers Volume (K) Forecast, by Application 2020 & 2033
- Table 85: South Korea Micro Piezoelectric Drivers Revenue (billion) Forecast, by Application 2020 & 2033
- Table 86: South Korea Micro Piezoelectric Drivers Volume (K) Forecast, by Application 2020 & 2033
- Table 87: ASEAN Micro Piezoelectric Drivers Revenue (billion) Forecast, by Application 2020 & 2033
- Table 88: ASEAN Micro Piezoelectric Drivers Volume (K) Forecast, by Application 2020 & 2033
- Table 89: Oceania Micro Piezoelectric Drivers Revenue (billion) Forecast, by Application 2020 & 2033
- Table 90: Oceania Micro Piezoelectric Drivers Volume (K) Forecast, by Application 2020 & 2033
- Table 91: Rest of Asia Pacific Micro Piezoelectric Drivers Revenue (billion) Forecast, by Application 2020 & 2033
- Table 92: Rest of Asia Pacific Micro Piezoelectric Drivers Volume (K) Forecast, by Application 2020 & 2033
Frequently Asked Questions
1. What is the projected Compound Annual Growth Rate (CAGR) of the Micro Piezoelectric Drivers?
The projected CAGR is approximately 7.5%.
2. Which companies are prominent players in the Micro Piezoelectric Drivers?
Key companies in the market include Physik Instrumente, Aerotech, Piezosystem Jena, Amp-Line, Andantex, Columbia Research Labs, ENDAQ, Mad City Labs, Dynamic Structures & Materials, Kistler Group, TRINAMIC Motion Control GmbH, Matsusada Precision.
3. What are the main segments of the Micro Piezoelectric Drivers?
The market segments include Application, Type.
4. Can you provide details about the market size?
The market size is estimated to be USD 11.97 billion as of 2022.
5. What are some drivers contributing to market growth?
N/A
6. What are the notable trends driving market growth?
N/A
7. Are there any restraints impacting market growth?
N/A
8. Can you provide examples of recent developments in the market?
N/A
9. What pricing options are available for accessing the report?
Pricing options include single-user, multi-user, and enterprise licenses priced at USD 3950.00, USD 5925.00, and USD 7900.00 respectively.
10. Is the market size provided in terms of value or volume?
The market size is provided in terms of value, measured in billion and volume, measured in K.
11. Are there any specific market keywords associated with the report?
Yes, the market keyword associated with the report is "Micro Piezoelectric Drivers," which aids in identifying and referencing the specific market segment covered.
12. How do I determine which pricing option suits my needs best?
The pricing options vary based on user requirements and access needs. Individual users may opt for single-user licenses, while businesses requiring broader access may choose multi-user or enterprise licenses for cost-effective access to the report.
13. Are there any additional resources or data provided in the Micro Piezoelectric Drivers report?
While the report offers comprehensive insights, it's advisable to review the specific contents or supplementary materials provided to ascertain if additional resources or data are available.
14. How can I stay updated on further developments or reports in the Micro Piezoelectric Drivers?
To stay informed about further developments, trends, and reports in the Micro Piezoelectric Drivers, consider subscribing to industry newsletters, following relevant companies and organizations, or regularly checking reputable industry news sources and publications.
Methodology
Step 1 - Identification of Relevant Samples Size from Population Database


Step 2 - Approaches for Defining Global Market Size (Value, Volume* & Price*)

Note*: In applicable scenarios
Step 3 - Data Sources
Primary Research
- Web Analytics
- Survey Reports
- Research Institute
- Latest Research Reports
- Opinion Leaders
Secondary Research
- Annual Reports
- White Paper
- Latest Press Release
- Industry Association
- Paid Database
- Investor Presentations

Step 4 - Data Triangulation
Involves using different sources of information in order to increase the validity of a study
These sources are likely to be stakeholders in a program - participants, other researchers, program staff, other community members, and so on.
Then we put all data in single framework & apply various statistical tools to find out the dynamic on the market.
During the analysis stage, feedback from the stakeholder groups would be compared to determine areas of agreement as well as areas of divergence