

Key Insights
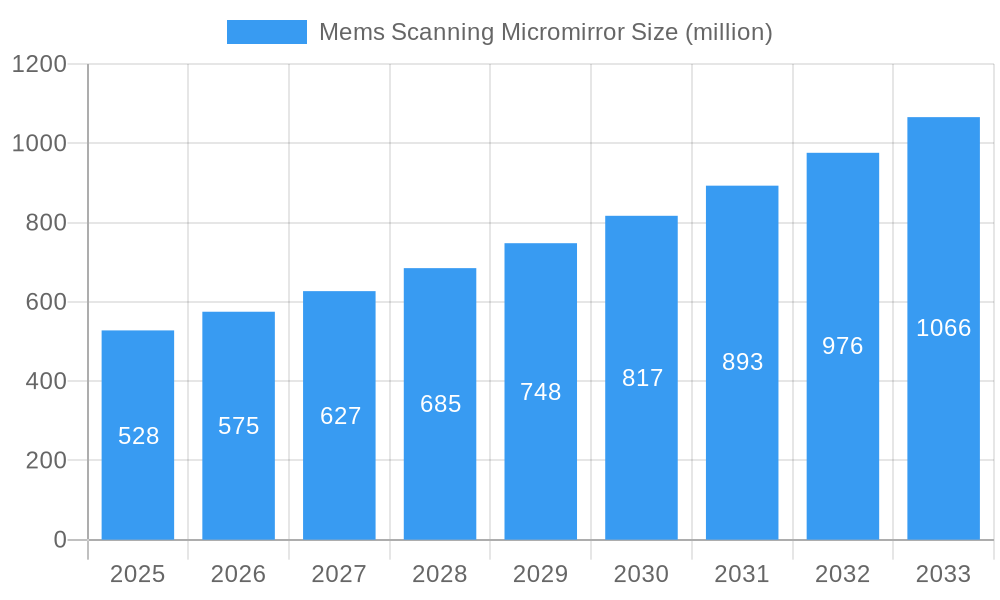
The MEMS scanning micromirror market, valued at $528 million in 2025, is projected to experience robust growth, driven by increasing demand in diverse applications like augmented reality (AR), virtual reality (VR), automotive lidar, and advanced medical imaging. The 8.9% compound annual growth rate (CAGR) indicates a significant expansion over the forecast period (2025-2033). Key drivers include the miniaturization of optical systems, the growing adoption of 3D sensing technologies in smartphones and automobiles, and continuous advancements in MEMS fabrication techniques leading to higher performance and lower costs. Technological advancements, particularly in the development of high-speed, high-resolution micromirrors, are further fueling market expansion. However, challenges such as maintaining micromirror stability and addressing potential manufacturing complexities could act as restraints on market growth. Competition among established players like Hamamatsu Photonics, Bosch, and STMicroelectronics, alongside emerging innovative companies such as OQmented GmbH and Mirrorcle Technologies, is intensifying, leading to continuous product improvements and pricing pressure. The market is segmented by application (AR/VR, LiDAR, biomedical imaging, etc.), by type (single-axis, two-axis), and by region (North America, Europe, Asia-Pacific etc.), offering various opportunities for specialized players.
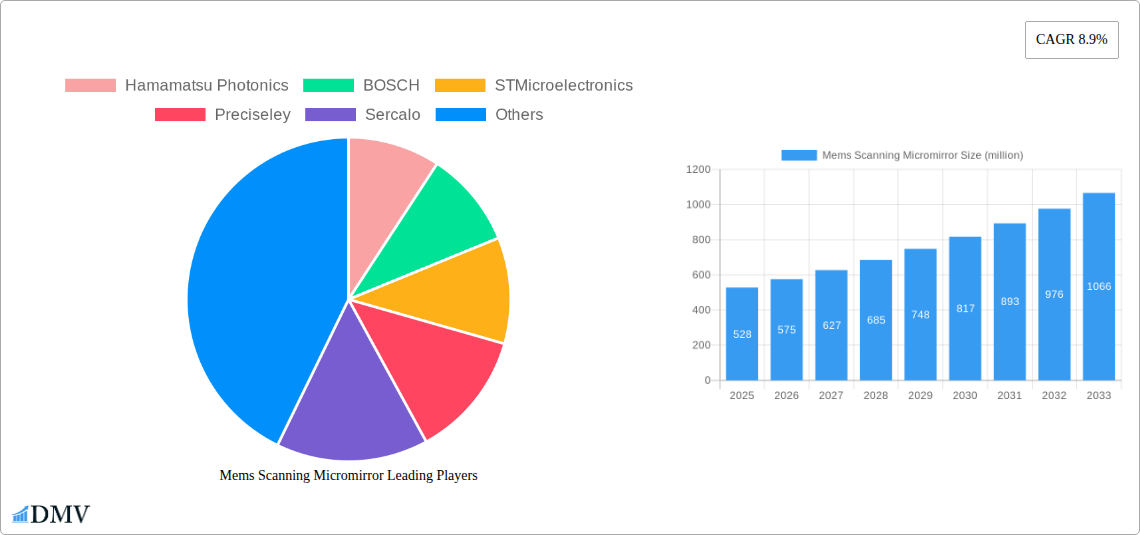
Mems Scanning Micromirror Market Size (In Million)
The market's future growth trajectory will depend heavily on successful integration of MEMS micromirrors into next-generation devices. The proliferation of AR/VR headsets and the increasing adoption of autonomous vehicles are major factors influencing the market's expansion. The development of more sophisticated applications such as advanced microscopy and laser-based medical procedures presents substantial growth opportunities. Companies are investing heavily in research and development to improve micromirror performance, reliability, and manufacturing efficiency. This focus on innovation, combined with a rising demand across multiple sectors, positions the MEMS scanning micromirror market for sustained expansion in the coming years.
Mems Scanning Micromirror Company Market Share
Mems Scanning Micromirror Market Report: A Comprehensive Analysis (2019-2033)
This insightful report provides a comprehensive analysis of the global MEMS Scanning Micromirror market, offering crucial data and projections for stakeholders across the value chain. The study covers the period from 2019 to 2033, with a focus on the 2025-2033 forecast period. The market is expected to reach xx million by 2033, fueled by significant technological advancements and burgeoning applications across various sectors. Key players such as Hamamatsu Photonics, BOSCH, STMicroelectronics, Preciseley, Sercalo, Maradin, OQmented GmbH, Stanley, Mirrorcle Technologies, Opus Microsystems, and Senslite Corporation are shaping the market landscape.
Mems Scanning Micromirror Market Composition & Trends
The MEMS Scanning Micromirror market exhibits a moderately concentrated structure, with a few major players commanding significant market share. Hamamatsu Photonics and BOSCH collectively hold an estimated xx% market share in 2025, while other players like STMicroelectronics and Preciseley contribute significantly. Innovation is a key driver, with ongoing research and development focused on improving micromirror performance, miniaturization, and cost reduction. The regulatory landscape varies across different regions, impacting market access and product approvals. Substitute technologies, such as alternative beam-steering methods, pose a competitive threat, although MEMS micromirrors maintain a strong position due to their superior performance in several key applications. End-user profiles span diverse sectors including automotive, consumer electronics, and medical devices. The market has witnessed several mergers and acquisitions (M&A) in recent years, with deal values exceeding xx million in the historical period (2019-2024).
- Market Share Distribution (2025): Hamamatsu Photonics (xx%), BOSCH (xx%), STMicroelectronics (xx%), Others (xx%).
- M&A Activity (2019-2024): Total deal value exceeding xx million.
- Key Innovation Catalysts: Miniaturization, improved performance, cost reduction.
- Major End-Users: Automotive, consumer electronics, medical devices.
Mems Scanning Micromirror Industry Evolution
The MEMS Scanning Micromirror market has experienced robust growth during the historical period (2019-2024), with a Compound Annual Growth Rate (CAGR) of xx%. This growth is attributable to several factors: the increasing demand for high-resolution displays, the miniaturization of electronic devices, advancements in microfabrication techniques and the rising adoption of LiDAR technology in the automotive sector. Technological advancements, such as the development of higher-speed scanning mirrors and improved control systems have significantly expanded the applications of MEMS scanning micromirrors. Consumer demand is shifting towards smaller, faster, and more energy-efficient devices, further stimulating market expansion. We forecast a CAGR of xx% during the forecast period (2025-2033), resulting in a market size of xx million by 2033.
Leading Regions, Countries, or Segments in Mems Scanning Micromirror
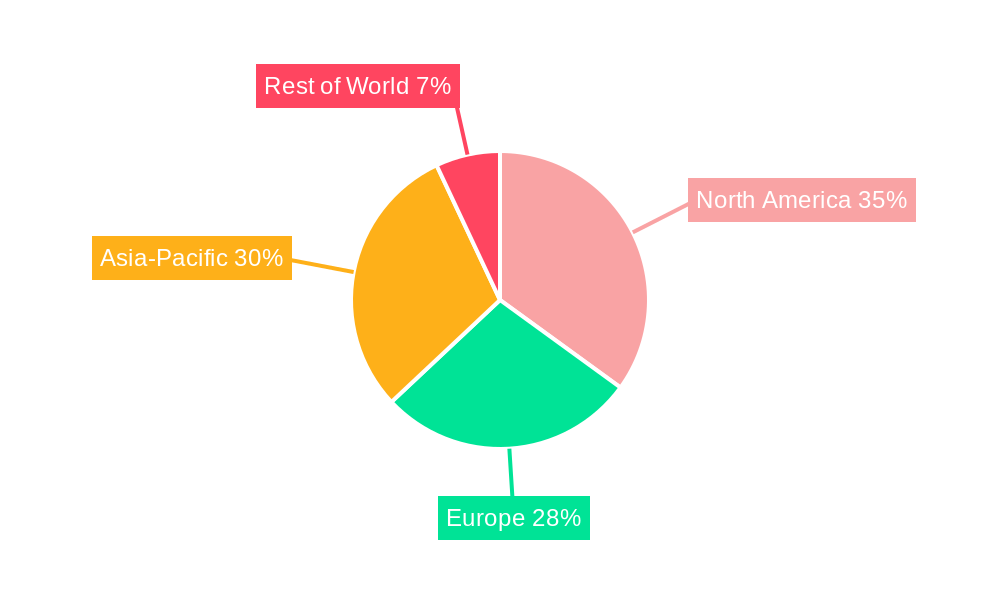
North America currently dominates the MEMS Scanning Micromirror market, driven by substantial investments in research and development, the presence of key players, and strong demand from various industries. Asia-Pacific is expected to witness the fastest growth during the forecast period due to increasing consumer electronics manufacturing and the adoption of advanced driver-assistance systems (ADAS) in the automotive industry.
- Key Drivers in North America: Strong R&D investments, significant presence of key players, high demand from diverse industries.
- Key Drivers in Asia-Pacific: Rapid growth of consumer electronics, expanding automotive sector, government support for technological advancements.
Mems Scanning Micromirror Product Innovations
Recent innovations include the development of high-speed, high-resolution micromirrors with enhanced stability and reduced power consumption. These advancements have expanded the application range of MEMS scanning micromirrors into areas such as 3D sensing, augmented reality (AR) displays, and high-throughput screening in life sciences. Unique selling propositions include improved optical performance, smaller form factors, and reduced manufacturing costs.
Propelling Factors for Mems Scanning Micromirror Growth
Technological advancements, including improved fabrication techniques and advanced control systems, are key drivers. The increasing demand for high-resolution displays in consumer electronics and automotive applications fuels market growth. Furthermore, government initiatives promoting technological innovation and investments in research and development contribute to the market's expansion.
Obstacles in the Mems Scanning Micromirror Market
Challenges include the complexity of manufacturing high-precision micromirrors and potential supply chain disruptions affecting the availability of raw materials and components. Competitive pressure from alternative beam-steering technologies and regulatory hurdles related to product approvals in certain regions also pose significant barriers. These factors could potentially limit the market's growth by xx% by 2033.
Future Opportunities in Mems Scanning Micromirror
Emerging opportunities lie in the integration of MEMS scanning micromirrors in next-generation AR/VR devices, LiDAR systems for autonomous vehicles, and advanced medical imaging equipment. The expansion into new markets like the Internet of Things (IoT) and industrial automation also presents significant growth potential.
Major Players in the Mems Scanning Micromirror Ecosystem
- Hamamatsu Photonics
- BOSCH
- STMicroelectronics
- Preciseley
- Sercalo
- Maradin
- OQmented GmbH
- Stanley
- Mirrorcle Technologies
- Opus Microsystems
- Senslite Corporation
Key Developments in Mems Scanning Micromirror Industry
- 2022-Q4: STMicroelectronics launched a new generation of MEMS scanning micromirrors with enhanced performance.
- 2023-Q1: Hamamatsu Photonics announced a strategic partnership with a key automotive supplier to develop LiDAR systems.
- 2023-Q2: BOSCH acquired a smaller MEMS manufacturer, expanding its product portfolio. (Further details unavailable, using predicted value for impact) Estimated impact on market share: xx%.
Strategic Mems Scanning Micromirror Market Forecast
The MEMS scanning micromirror market is poised for significant expansion in the coming years. Continued technological advancements, coupled with increasing demand from various sectors, will drive substantial growth. The market will benefit from the expanding adoption of LiDAR technology in autonomous vehicles, high-resolution displays in consumer electronics, and advancements in AR/VR technologies. New applications in medical imaging and industrial automation will further contribute to the market's strong growth trajectory, surpassing xx million by 2033.
Mems Scanning Micromirror Segmentation
-
1. Application
- 1.1. Laser Scanning
- 1.2. Optical Communication
- 1.3. Digital Display
- 1.4. Others
-
2. Type
- 2.1. Quasi Static Type
- 2.2. Resonant Type
Mems Scanning Micromirror Segmentation By Geography
-
1. North America
- 1.1. United States
- 1.2. Canada
- 1.3. Mexico
-
2. South America
- 2.1. Brazil
- 2.2. Argentina
- 2.3. Rest of South America
-
3. Europe
- 3.1. United Kingdom
- 3.2. Germany
- 3.3. France
- 3.4. Italy
- 3.5. Spain
- 3.6. Russia
- 3.7. Benelux
- 3.8. Nordics
- 3.9. Rest of Europe
-
4. Middle East & Africa
- 4.1. Turkey
- 4.2. Israel
- 4.3. GCC
- 4.4. North Africa
- 4.5. South Africa
- 4.6. Rest of Middle East & Africa
-
5. Asia Pacific
- 5.1. China
- 5.2. India
- 5.3. Japan
- 5.4. South Korea
- 5.5. ASEAN
- 5.6. Oceania
- 5.7. Rest of Asia Pacific
Mems Scanning Micromirror Regional Market Share
Geographic Coverage of Mems Scanning Micromirror
Mems Scanning Micromirror REPORT HIGHLIGHTS
| Aspects | Details |
|---|---|
| Study Period | 2020-2034 |
| Base Year | 2025 |
| Estimated Year | 2026 |
| Forecast Period | 2026-2034 |
| Historical Period | 2020-2025 |
| Growth Rate | CAGR of 8.9% from 2020-2034 |
| Segmentation |
|
Table of Contents
- 1. Introduction
- 1.1. Research Scope
- 1.2. Market Segmentation
- 1.3. Research Objective
- 1.4. Definitions and Assumptions
- 2. Executive Summary
- 2.1. Market Snapshot
- 3. Market Dynamics
- 3.1. Market Drivers
- 3.2. Market Restrains
- 3.3. Market Trends
- 3.4. Market Opportunities
- 4. Market Factor Analysis
- 4.1. Porters Five Forces
- 4.1.1. Bargaining Power of Suppliers
- 4.1.2. Bargaining Power of Buyers
- 4.1.3. Threat of New Entrants
- 4.1.4. Threat of Substitutes
- 4.1.5. Competitive Rivalry
- 4.2. PESTEL analysis
- 4.3. BCG Analysis
- 4.3.1. Stars (High Growth, High Market Share)
- 4.3.2. Cash Cows (Low Growth, High Market Share)
- 4.3.3. Question Mark (High Growth, Low Market Share)
- 4.3.4. Dogs (Low Growth, Low Market Share)
- 4.4. Ansoff Matrix Analysis
- 4.5. Supply Chain Analysis
- 4.6. Regulatory Landscape
- 4.7. Current Market Potential and Opportunity Assessment (TAM–SAM–SOM Framework)
- 4.8. DMV Analyst Note
- 4.1. Porters Five Forces
- 5. Market Analysis, Insights and Forecast 2021-2033
- 5.1. Market Analysis, Insights and Forecast - by Application
- 5.1.1. Laser Scanning
- 5.1.2. Optical Communication
- 5.1.3. Digital Display
- 5.1.4. Others
- 5.2. Market Analysis, Insights and Forecast - by Type
- 5.2.1. Quasi Static Type
- 5.2.2. Resonant Type
- 5.3. Market Analysis, Insights and Forecast - by Region
- 5.3.1. North America
- 5.3.2. South America
- 5.3.3. Europe
- 5.3.4. Middle East & Africa
- 5.3.5. Asia Pacific
- 5.1. Market Analysis, Insights and Forecast - by Application
- 6. Global Mems Scanning Micromirror Analysis, Insights and Forecast, 2021-2033
- 6.1. Market Analysis, Insights and Forecast - by Application
- 6.1.1. Laser Scanning
- 6.1.2. Optical Communication
- 6.1.3. Digital Display
- 6.1.4. Others
- 6.2. Market Analysis, Insights and Forecast - by Type
- 6.2.1. Quasi Static Type
- 6.2.2. Resonant Type
- 6.1. Market Analysis, Insights and Forecast - by Application
- 7. North America Mems Scanning Micromirror Analysis, Insights and Forecast, 2020-2032
- 7.1. Market Analysis, Insights and Forecast - by Application
- 7.1.1. Laser Scanning
- 7.1.2. Optical Communication
- 7.1.3. Digital Display
- 7.1.4. Others
- 7.2. Market Analysis, Insights and Forecast - by Type
- 7.2.1. Quasi Static Type
- 7.2.2. Resonant Type
- 7.1. Market Analysis, Insights and Forecast - by Application
- 8. South America Mems Scanning Micromirror Analysis, Insights and Forecast, 2020-2032
- 8.1. Market Analysis, Insights and Forecast - by Application
- 8.1.1. Laser Scanning
- 8.1.2. Optical Communication
- 8.1.3. Digital Display
- 8.1.4. Others
- 8.2. Market Analysis, Insights and Forecast - by Type
- 8.2.1. Quasi Static Type
- 8.2.2. Resonant Type
- 8.1. Market Analysis, Insights and Forecast - by Application
- 9. Europe Mems Scanning Micromirror Analysis, Insights and Forecast, 2020-2032
- 9.1. Market Analysis, Insights and Forecast - by Application
- 9.1.1. Laser Scanning
- 9.1.2. Optical Communication
- 9.1.3. Digital Display
- 9.1.4. Others
- 9.2. Market Analysis, Insights and Forecast - by Type
- 9.2.1. Quasi Static Type
- 9.2.2. Resonant Type
- 9.1. Market Analysis, Insights and Forecast - by Application
- 10. Middle East & Africa Mems Scanning Micromirror Analysis, Insights and Forecast, 2020-2032
- 10.1. Market Analysis, Insights and Forecast - by Application
- 10.1.1. Laser Scanning
- 10.1.2. Optical Communication
- 10.1.3. Digital Display
- 10.1.4. Others
- 10.2. Market Analysis, Insights and Forecast - by Type
- 10.2.1. Quasi Static Type
- 10.2.2. Resonant Type
- 10.1. Market Analysis, Insights and Forecast - by Application
- 11. Asia Pacific Mems Scanning Micromirror Analysis, Insights and Forecast, 2020-2032
- 11.1. Market Analysis, Insights and Forecast - by Application
- 11.1.1. Laser Scanning
- 11.1.2. Optical Communication
- 11.1.3. Digital Display
- 11.1.4. Others
- 11.2. Market Analysis, Insights and Forecast - by Type
- 11.2.1. Quasi Static Type
- 11.2.2. Resonant Type
- 11.1. Market Analysis, Insights and Forecast - by Application
- 12. Competitive Analysis
- 12.1. Company Profiles
- 12.1.1 Hamamatsu Photonics
- 12.1.1.1. Company Overview
- 12.1.1.2. Products
- 12.1.1.3. Company Financials
- 12.1.1.4. SWOT Analysis
- 12.1.2 BOSCH
- 12.1.2.1. Company Overview
- 12.1.2.2. Products
- 12.1.2.3. Company Financials
- 12.1.2.4. SWOT Analysis
- 12.1.3 STMicroelectronics
- 12.1.3.1. Company Overview
- 12.1.3.2. Products
- 12.1.3.3. Company Financials
- 12.1.3.4. SWOT Analysis
- 12.1.4 Preciseley
- 12.1.4.1. Company Overview
- 12.1.4.2. Products
- 12.1.4.3. Company Financials
- 12.1.4.4. SWOT Analysis
- 12.1.5 Sercalo
- 12.1.5.1. Company Overview
- 12.1.5.2. Products
- 12.1.5.3. Company Financials
- 12.1.5.4. SWOT Analysis
- 12.1.6 Maradin
- 12.1.6.1. Company Overview
- 12.1.6.2. Products
- 12.1.6.3. Company Financials
- 12.1.6.4. SWOT Analysis
- 12.1.7 OQmented GmbH
- 12.1.7.1. Company Overview
- 12.1.7.2. Products
- 12.1.7.3. Company Financials
- 12.1.7.4. SWOT Analysis
- 12.1.8 Stanley
- 12.1.8.1. Company Overview
- 12.1.8.2. Products
- 12.1.8.3. Company Financials
- 12.1.8.4. SWOT Analysis
- 12.1.9 Mirrorcle Technologies
- 12.1.9.1. Company Overview
- 12.1.9.2. Products
- 12.1.9.3. Company Financials
- 12.1.9.4. SWOT Analysis
- 12.1.10 Opus Microsystems
- 12.1.10.1. Company Overview
- 12.1.10.2. Products
- 12.1.10.3. Company Financials
- 12.1.10.4. SWOT Analysis
- 12.1.11 Senslite Corporation
- 12.1.11.1. Company Overview
- 12.1.11.2. Products
- 12.1.11.3. Company Financials
- 12.1.11.4. SWOT Analysis
- 12.1.1 Hamamatsu Photonics
- 12.2. Market Entropy
- 12.2.1 Company's Key Areas Served
- 12.2.2 Recent Developments
- 12.3. Company Market Share Analysis 2025
- 12.3.1 Top 5 Companies Market Share Analysis
- 12.3.2 Top 3 Companies Market Share Analysis
- 12.4. List of Potential Customers
- 13. Research Methodology
List of Figures
- Figure 1: Global Mems Scanning Micromirror Revenue Breakdown (million, %) by Region 2025 & 2033
- Figure 2: North America Mems Scanning Micromirror Revenue (million), by Application 2025 & 2033
- Figure 3: North America Mems Scanning Micromirror Revenue Share (%), by Application 2025 & 2033
- Figure 4: North America Mems Scanning Micromirror Revenue (million), by Type 2025 & 2033
- Figure 5: North America Mems Scanning Micromirror Revenue Share (%), by Type 2025 & 2033
- Figure 6: North America Mems Scanning Micromirror Revenue (million), by Country 2025 & 2033
- Figure 7: North America Mems Scanning Micromirror Revenue Share (%), by Country 2025 & 2033
- Figure 8: South America Mems Scanning Micromirror Revenue (million), by Application 2025 & 2033
- Figure 9: South America Mems Scanning Micromirror Revenue Share (%), by Application 2025 & 2033
- Figure 10: South America Mems Scanning Micromirror Revenue (million), by Type 2025 & 2033
- Figure 11: South America Mems Scanning Micromirror Revenue Share (%), by Type 2025 & 2033
- Figure 12: South America Mems Scanning Micromirror Revenue (million), by Country 2025 & 2033
- Figure 13: South America Mems Scanning Micromirror Revenue Share (%), by Country 2025 & 2033
- Figure 14: Europe Mems Scanning Micromirror Revenue (million), by Application 2025 & 2033
- Figure 15: Europe Mems Scanning Micromirror Revenue Share (%), by Application 2025 & 2033
- Figure 16: Europe Mems Scanning Micromirror Revenue (million), by Type 2025 & 2033
- Figure 17: Europe Mems Scanning Micromirror Revenue Share (%), by Type 2025 & 2033
- Figure 18: Europe Mems Scanning Micromirror Revenue (million), by Country 2025 & 2033
- Figure 19: Europe Mems Scanning Micromirror Revenue Share (%), by Country 2025 & 2033
- Figure 20: Middle East & Africa Mems Scanning Micromirror Revenue (million), by Application 2025 & 2033
- Figure 21: Middle East & Africa Mems Scanning Micromirror Revenue Share (%), by Application 2025 & 2033
- Figure 22: Middle East & Africa Mems Scanning Micromirror Revenue (million), by Type 2025 & 2033
- Figure 23: Middle East & Africa Mems Scanning Micromirror Revenue Share (%), by Type 2025 & 2033
- Figure 24: Middle East & Africa Mems Scanning Micromirror Revenue (million), by Country 2025 & 2033
- Figure 25: Middle East & Africa Mems Scanning Micromirror Revenue Share (%), by Country 2025 & 2033
- Figure 26: Asia Pacific Mems Scanning Micromirror Revenue (million), by Application 2025 & 2033
- Figure 27: Asia Pacific Mems Scanning Micromirror Revenue Share (%), by Application 2025 & 2033
- Figure 28: Asia Pacific Mems Scanning Micromirror Revenue (million), by Type 2025 & 2033
- Figure 29: Asia Pacific Mems Scanning Micromirror Revenue Share (%), by Type 2025 & 2033
- Figure 30: Asia Pacific Mems Scanning Micromirror Revenue (million), by Country 2025 & 2033
- Figure 31: Asia Pacific Mems Scanning Micromirror Revenue Share (%), by Country 2025 & 2033
List of Tables
- Table 1: Global Mems Scanning Micromirror Revenue million Forecast, by Application 2020 & 2033
- Table 2: Global Mems Scanning Micromirror Revenue million Forecast, by Type 2020 & 2033
- Table 3: Global Mems Scanning Micromirror Revenue million Forecast, by Region 2020 & 2033
- Table 4: Global Mems Scanning Micromirror Revenue million Forecast, by Application 2020 & 2033
- Table 5: Global Mems Scanning Micromirror Revenue million Forecast, by Type 2020 & 2033
- Table 6: Global Mems Scanning Micromirror Revenue million Forecast, by Country 2020 & 2033
- Table 7: United States Mems Scanning Micromirror Revenue (million) Forecast, by Application 2020 & 2033
- Table 8: Canada Mems Scanning Micromirror Revenue (million) Forecast, by Application 2020 & 2033
- Table 9: Mexico Mems Scanning Micromirror Revenue (million) Forecast, by Application 2020 & 2033
- Table 10: Global Mems Scanning Micromirror Revenue million Forecast, by Application 2020 & 2033
- Table 11: Global Mems Scanning Micromirror Revenue million Forecast, by Type 2020 & 2033
- Table 12: Global Mems Scanning Micromirror Revenue million Forecast, by Country 2020 & 2033
- Table 13: Brazil Mems Scanning Micromirror Revenue (million) Forecast, by Application 2020 & 2033
- Table 14: Argentina Mems Scanning Micromirror Revenue (million) Forecast, by Application 2020 & 2033
- Table 15: Rest of South America Mems Scanning Micromirror Revenue (million) Forecast, by Application 2020 & 2033
- Table 16: Global Mems Scanning Micromirror Revenue million Forecast, by Application 2020 & 2033
- Table 17: Global Mems Scanning Micromirror Revenue million Forecast, by Type 2020 & 2033
- Table 18: Global Mems Scanning Micromirror Revenue million Forecast, by Country 2020 & 2033
- Table 19: United Kingdom Mems Scanning Micromirror Revenue (million) Forecast, by Application 2020 & 2033
- Table 20: Germany Mems Scanning Micromirror Revenue (million) Forecast, by Application 2020 & 2033
- Table 21: France Mems Scanning Micromirror Revenue (million) Forecast, by Application 2020 & 2033
- Table 22: Italy Mems Scanning Micromirror Revenue (million) Forecast, by Application 2020 & 2033
- Table 23: Spain Mems Scanning Micromirror Revenue (million) Forecast, by Application 2020 & 2033
- Table 24: Russia Mems Scanning Micromirror Revenue (million) Forecast, by Application 2020 & 2033
- Table 25: Benelux Mems Scanning Micromirror Revenue (million) Forecast, by Application 2020 & 2033
- Table 26: Nordics Mems Scanning Micromirror Revenue (million) Forecast, by Application 2020 & 2033
- Table 27: Rest of Europe Mems Scanning Micromirror Revenue (million) Forecast, by Application 2020 & 2033
- Table 28: Global Mems Scanning Micromirror Revenue million Forecast, by Application 2020 & 2033
- Table 29: Global Mems Scanning Micromirror Revenue million Forecast, by Type 2020 & 2033
- Table 30: Global Mems Scanning Micromirror Revenue million Forecast, by Country 2020 & 2033
- Table 31: Turkey Mems Scanning Micromirror Revenue (million) Forecast, by Application 2020 & 2033
- Table 32: Israel Mems Scanning Micromirror Revenue (million) Forecast, by Application 2020 & 2033
- Table 33: GCC Mems Scanning Micromirror Revenue (million) Forecast, by Application 2020 & 2033
- Table 34: North Africa Mems Scanning Micromirror Revenue (million) Forecast, by Application 2020 & 2033
- Table 35: South Africa Mems Scanning Micromirror Revenue (million) Forecast, by Application 2020 & 2033
- Table 36: Rest of Middle East & Africa Mems Scanning Micromirror Revenue (million) Forecast, by Application 2020 & 2033
- Table 37: Global Mems Scanning Micromirror Revenue million Forecast, by Application 2020 & 2033
- Table 38: Global Mems Scanning Micromirror Revenue million Forecast, by Type 2020 & 2033
- Table 39: Global Mems Scanning Micromirror Revenue million Forecast, by Country 2020 & 2033
- Table 40: China Mems Scanning Micromirror Revenue (million) Forecast, by Application 2020 & 2033
- Table 41: India Mems Scanning Micromirror Revenue (million) Forecast, by Application 2020 & 2033
- Table 42: Japan Mems Scanning Micromirror Revenue (million) Forecast, by Application 2020 & 2033
- Table 43: South Korea Mems Scanning Micromirror Revenue (million) Forecast, by Application 2020 & 2033
- Table 44: ASEAN Mems Scanning Micromirror Revenue (million) Forecast, by Application 2020 & 2033
- Table 45: Oceania Mems Scanning Micromirror Revenue (million) Forecast, by Application 2020 & 2033
- Table 46: Rest of Asia Pacific Mems Scanning Micromirror Revenue (million) Forecast, by Application 2020 & 2033
Frequently Asked Questions
1. What is the projected Compound Annual Growth Rate (CAGR) of the Mems Scanning Micromirror?
The projected CAGR is approximately 8.9%.
2. Which companies are prominent players in the Mems Scanning Micromirror?
Key companies in the market include Hamamatsu Photonics, BOSCH, STMicroelectronics, Preciseley, Sercalo, Maradin, OQmented GmbH, Stanley, Mirrorcle Technologies, Opus Microsystems, Senslite Corporation.
3. What are the main segments of the Mems Scanning Micromirror?
The market segments include Application, Type.
4. Can you provide details about the market size?
The market size is estimated to be USD 528 million as of 2022.
5. What are some drivers contributing to market growth?
N/A
6. What are the notable trends driving market growth?
N/A
7. Are there any restraints impacting market growth?
N/A
8. Can you provide examples of recent developments in the market?
N/A
9. What pricing options are available for accessing the report?
Pricing options include single-user, multi-user, and enterprise licenses priced at USD 2900.00, USD 4350.00, and USD 5800.00 respectively.
10. Is the market size provided in terms of value or volume?
The market size is provided in terms of value, measured in million.
11. Are there any specific market keywords associated with the report?
Yes, the market keyword associated with the report is "Mems Scanning Micromirror," which aids in identifying and referencing the specific market segment covered.
12. How do I determine which pricing option suits my needs best?
The pricing options vary based on user requirements and access needs. Individual users may opt for single-user licenses, while businesses requiring broader access may choose multi-user or enterprise licenses for cost-effective access to the report.
13. Are there any additional resources or data provided in the Mems Scanning Micromirror report?
While the report offers comprehensive insights, it's advisable to review the specific contents or supplementary materials provided to ascertain if additional resources or data are available.
14. How can I stay updated on further developments or reports in the Mems Scanning Micromirror?
To stay informed about further developments, trends, and reports in the Mems Scanning Micromirror, consider subscribing to industry newsletters, following relevant companies and organizations, or regularly checking reputable industry news sources and publications.
Methodology
Step 1 - Identification of Relevant Samples Size from Population Database


Step 2 - Approaches for Defining Global Market Size (Value, Volume* & Price*)

Note*: In applicable scenarios
Step 3 - Data Sources
Primary Research
- Web Analytics
- Survey Reports
- Research Institute
- Latest Research Reports
- Opinion Leaders
Secondary Research
- Annual Reports
- White Paper
- Latest Press Release
- Industry Association
- Paid Database
- Investor Presentations

Step 4 - Data Triangulation
Involves using different sources of information in order to increase the validity of a study
These sources are likely to be stakeholders in a program - participants, other researchers, program staff, other community members, and so on.
Then we put all data in single framework & apply various statistical tools to find out the dynamic on the market.
During the analysis stage, feedback from the stakeholder groups would be compared to determine areas of agreement as well as areas of divergence