

Key Insights
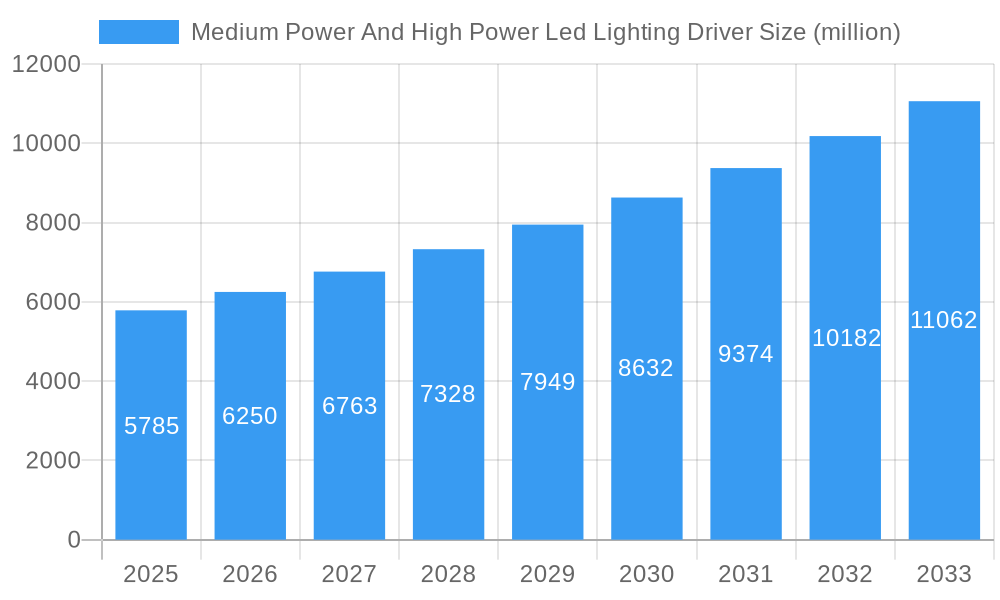
The global market for medium and high-power LED lighting drivers is experiencing robust growth, projected to reach a substantial size. The 8% CAGR from 2019 to 2025 indicates a significant expansion, driven primarily by the increasing adoption of energy-efficient LED lighting across various sectors. Key drivers include stringent government regulations promoting energy conservation, rising consumer awareness of environmental sustainability, and the decreasing cost of LED technology. Furthermore, advancements in driver technology, such as improved efficiency, smaller form factors, and enhanced dimming capabilities, are fueling market expansion. The market is segmented by power rating (medium vs. high power), application (commercial, industrial, residential), and geography. Major players such as Mean Well, Philips, Inventronics, and others are aggressively competing through innovation and strategic partnerships to capture market share. The forecast period (2025-2033) anticipates continued strong growth, propelled by increasing demand from emerging economies and ongoing technological advancements. Challenges such as potential supply chain disruptions and the need for robust quality control measures could influence growth trajectories in the coming years.
Medium Power And High Power Led Lighting Driver Market Size (In Billion)
The competitive landscape is characterized by a mix of established players and emerging companies. Established brands leverage their strong brand reputation and extensive distribution networks to maintain their market positions. Meanwhile, newer entrants are focusing on niche applications and innovative technologies to differentiate themselves. The market is expected to witness strategic mergers and acquisitions as companies seek to consolidate their market presence and expand their product portfolios. The focus on integrating smart features and IoT capabilities into LED drivers is expected to further drive market growth and create new opportunities for innovative companies. The shift towards sustainable and eco-friendly solutions will remain a key factor influencing the adoption of high-efficiency LED lighting drivers.
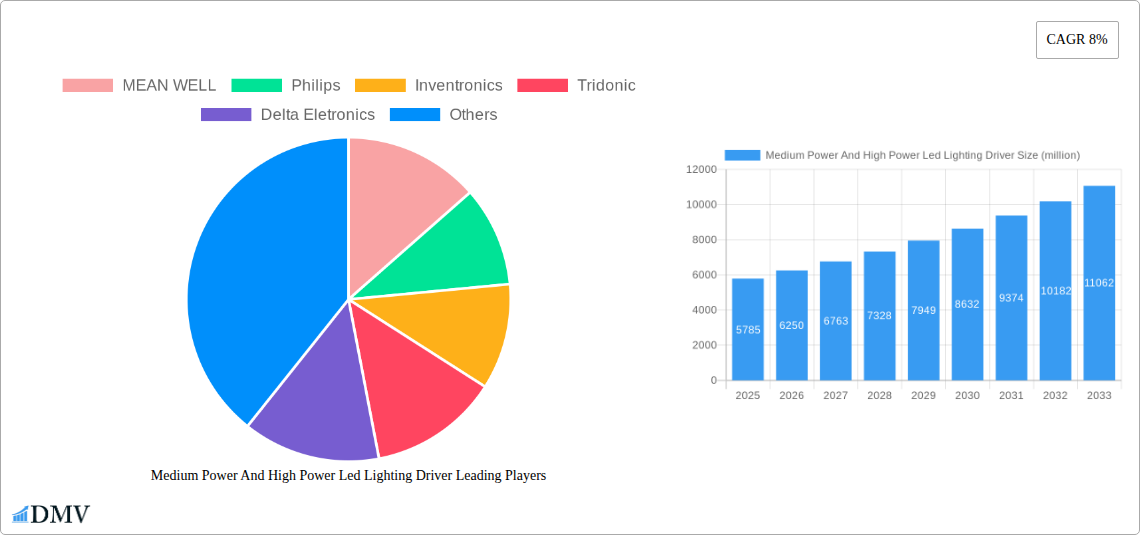
Medium Power And High Power Led Lighting Driver Company Market Share
Medium Power and High Power LED Lighting Driver Market Report: 2019-2033
This comprehensive report provides an in-depth analysis of the global Medium Power and High Power LED Lighting Driver market, encompassing historical data (2019-2024), current estimations (2025), and future projections (2025-2033). It offers invaluable insights for stakeholders, including manufacturers, investors, and industry professionals seeking to navigate this dynamic market landscape. The market is projected to reach xx million USD by 2033, exhibiting a CAGR of xx% during the forecast period. Key players analyzed include MEAN WELL, Philips, Inventronics, Tridonic, Delta Electronics, MOSO Power, Eaglerise, SOSEN Electronics, TCI, Osram, LIFUD, and HEP.
Medium Power And High Power LED Lighting Driver Market Composition & Trends
This section dissects the competitive landscape of the medium and high-power LED lighting driver market, examining market concentration, innovation drivers, and regulatory impacts. The global market shows a moderately concentrated structure, with the top 5 players holding approximately xx% of the market share in 2025. MEAN WELL and Philips are estimated to be the leading players, each commanding a significant portion, while Inventronics, Tridonic, and Delta Electronics collectively account for a substantial share.
Market Dynamics:
- Market Share Distribution (2025): MEAN WELL (xx%), Philips (xx%), Inventronics (xx%), Tridonic (xx%), Delta Electronics (xx%), Others (xx%).
- Innovation Catalysts: Miniaturization, higher efficiency, smart features (e.g., dimming, connectivity), and cost reduction through advancements in power electronics.
- Regulatory Landscape: Stringent energy efficiency standards (e.g., EU's Ecodesign Directive) are driving the adoption of higher-efficiency drivers. Safety regulations also play a significant role.
- Substitute Products: Traditional lighting technologies (e.g., fluorescent lamps) are being gradually replaced; however, alternative LED driver technologies and competing solutions from emerging markets exist.
- End-User Profiles: The market is driven by diverse end-users including commercial buildings, industrial facilities, residential sectors, and outdoor lighting applications.
- M&A Activities: The market has witnessed xx million USD worth of M&A activities in the historical period (2019-2024), with a focus on consolidation and expansion into new geographic markets.
Medium Power And High Power Led Lighting Driver Industry Evolution
The global medium and high-power LED lighting driver market has experienced significant growth over the past five years, driven by increasing demand for energy-efficient lighting solutions across various sectors. Technological advancements, including the adoption of GaN technology and improved control algorithms, have led to a surge in driver efficiency and performance. Consumer demand for smart lighting solutions is also fueling market expansion, boosting the demand for connected drivers with features like dimming and wireless control. The market witnessed a xx% CAGR during 2019-2024, and is projected to grow at a xx% CAGR from 2025-2033, reaching an estimated market value of xx million USD. This growth is further propelled by the ongoing shift from traditional lighting to LEDs in both new installations and retrofit projects. Adoption of advanced LED drivers with improved efficiency, reduced size, and enhanced functionality is rapidly increasing in developed regions. The penetration rate of smart LED drivers is expected to reach xx% by 2033.
Leading Regions, Countries, or Segments in Medium Power And High Power Led Lighting Driver
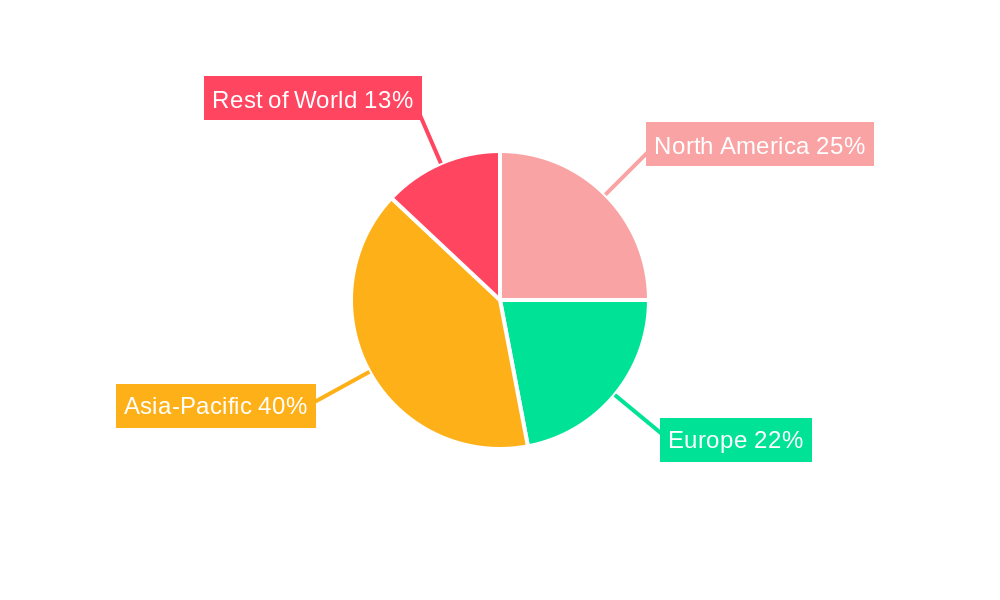
- Dominant Region: Asia-Pacific currently holds the largest market share, owing to its massive construction activity, rising disposable income, and supportive government policies that are promoting energy efficiency. North America and Europe also contribute significantly.
- Key Drivers (Asia-Pacific):
- Massive investments in infrastructure development.
- Government initiatives for energy conservation and smart city projects.
- Rapid growth in the commercial and industrial sectors.
- Increasing adoption of LED lighting in residential areas.
The dominance of Asia-Pacific is primarily attributed to robust economic growth, substantial government support, increased adoption in the construction and manufacturing sectors, and a growing preference for energy-efficient lighting. Europe and North America follow closely, driven by strong environmental regulations and high consumer awareness of energy efficiency.
Medium Power And High Power Led Lighting Driver Product Innovations
Recent innovations in medium and high-power LED lighting drivers focus on enhancing efficiency, miniaturization, and smart capabilities. The introduction of GaN-based drivers has enabled significant improvements in efficiency, power density, and thermal management. Advanced control algorithms optimize driver performance, leading to reduced energy consumption and extended lifespan. Smart drivers with integrated communication protocols enable seamless integration with building management systems and remote control functionalities. These technological advancements are driving adoption in diverse applications, including smart homes, commercial buildings, and industrial settings.
Propelling Factors for Medium Power And High Power Led Lighting Driver Growth
The growth of the LED lighting driver market is fueled by several key factors. Firstly, stringent government regulations promoting energy efficiency globally incentivize the adoption of LED lighting. Secondly, the ever-decreasing cost of LEDs and drivers makes them an economically viable alternative to traditional lighting. Technological advancements, such as improved efficiency and integrated smart features, further enhance market appeal.
Obstacles in the Medium Power And High Power Led Lighting Driver Market
Several obstacles hinder market growth. Fluctuations in raw material prices, especially those of rare earth elements, impact manufacturing costs. Stringent safety and compliance standards can increase product development and certification expenses. Intense competition, particularly from Chinese manufacturers, exerts downward pressure on prices. Supply chain disruptions, as evidenced during recent global events, have led to production delays and increased costs.
Future Opportunities in Medium Power And High Power Led Lighting Driver
Emerging opportunities lie in expanding into new markets, such as developing economies, and in leveraging technological advancements, such as integration with IoT and AI technologies. The demand for smart lighting solutions with energy management capabilities, coupled with the growing adoption of LEDs in various sectors, is expected to drive significant growth in the forecast period. Moreover, the increasing focus on sustainable solutions and improved energy efficiency will further accelerate market expansion.
Major Players in the Medium Power And High Power Led Lighting Driver Ecosystem
- MEAN WELL
- Philips
- Inventronics
- Tridonic
- Delta Electronics
- MOSO Power
- Eaglerise
- SOSEN Electronics
- TCI
- Osram
- LIFUD
- HEP
Key Developments in Medium Power And High Power Led Lighting Driver Industry
- 2022 Q4: MEAN WELL launched a new series of high-efficiency LED drivers with integrated dimming capabilities.
- 2023 Q1: Philips announced a strategic partnership to expand its presence in the smart lighting market.
- 2023 Q3: Inventronics acquired a smaller competitor, consolidating its market share. (Further specific details on the year and impact are needed for accurate reporting.)
Strategic Medium Power And High Power Led Lighting Driver Market Forecast
The medium and high-power LED lighting driver market is poised for significant growth driven by the continued adoption of LEDs and the increasing demand for energy-efficient and smart lighting solutions. Government initiatives promoting energy conservation and technological advancements will further accelerate market expansion. The market's robust growth trajectory, fueled by these factors, is expected to continue throughout the forecast period, presenting substantial opportunities for key players and new entrants alike.
Medium Power And High Power Led Lighting Driver Segmentation
-
1. Application
- 1.1. Street
- 1.2. Park
- 1.3. Others
-
2. Type
- 2.1. High Power
- 2.2. Medium Power
Medium Power And High Power Led Lighting Driver Segmentation By Geography
-
1. North America
- 1.1. United States
- 1.2. Canada
- 1.3. Mexico
-
2. South America
- 2.1. Brazil
- 2.2. Argentina
- 2.3. Rest of South America
-
3. Europe
- 3.1. United Kingdom
- 3.2. Germany
- 3.3. France
- 3.4. Italy
- 3.5. Spain
- 3.6. Russia
- 3.7. Benelux
- 3.8. Nordics
- 3.9. Rest of Europe
-
4. Middle East & Africa
- 4.1. Turkey
- 4.2. Israel
- 4.3. GCC
- 4.4. North Africa
- 4.5. South Africa
- 4.6. Rest of Middle East & Africa
-
5. Asia Pacific
- 5.1. China
- 5.2. India
- 5.3. Japan
- 5.4. South Korea
- 5.5. ASEAN
- 5.6. Oceania
- 5.7. Rest of Asia Pacific
Medium Power And High Power Led Lighting Driver Regional Market Share
Geographic Coverage of Medium Power And High Power Led Lighting Driver
Medium Power And High Power Led Lighting Driver REPORT HIGHLIGHTS
| Aspects | Details |
|---|---|
| Study Period | 2020-2034 |
| Base Year | 2025 |
| Estimated Year | 2026 |
| Forecast Period | 2026-2034 |
| Historical Period | 2020-2025 |
| Growth Rate | CAGR of 8% from 2020-2034 |
| Segmentation |
|
Table of Contents
- 1. Introduction
- 1.1. Research Scope
- 1.2. Market Segmentation
- 1.3. Research Objective
- 1.4. Definitions and Assumptions
- 2. Executive Summary
- 2.1. Market Snapshot
- 3. Market Dynamics
- 3.1. Market Drivers
- 3.2. Market Restrains
- 3.3. Market Trends
- 3.4. Market Opportunities
- 4. Market Factor Analysis
- 4.1. Porters Five Forces
- 4.1.1. Bargaining Power of Suppliers
- 4.1.2. Bargaining Power of Buyers
- 4.1.3. Threat of New Entrants
- 4.1.4. Threat of Substitutes
- 4.1.5. Competitive Rivalry
- 4.2. PESTEL analysis
- 4.3. BCG Analysis
- 4.3.1. Stars (High Growth, High Market Share)
- 4.3.2. Cash Cows (Low Growth, High Market Share)
- 4.3.3. Question Mark (High Growth, Low Market Share)
- 4.3.4. Dogs (Low Growth, Low Market Share)
- 4.4. Ansoff Matrix Analysis
- 4.5. Supply Chain Analysis
- 4.6. Regulatory Landscape
- 4.7. Current Market Potential and Opportunity Assessment (TAM–SAM–SOM Framework)
- 4.8. DMV Analyst Note
- 4.1. Porters Five Forces
- 5. Market Analysis, Insights and Forecast 2021-2033
- 5.1. Market Analysis, Insights and Forecast - by Application
- 5.1.1. Street
- 5.1.2. Park
- 5.1.3. Others
- 5.2. Market Analysis, Insights and Forecast - by Type
- 5.2.1. High Power
- 5.2.2. Medium Power
- 5.3. Market Analysis, Insights and Forecast - by Region
- 5.3.1. North America
- 5.3.2. South America
- 5.3.3. Europe
- 5.3.4. Middle East & Africa
- 5.3.5. Asia Pacific
- 5.1. Market Analysis, Insights and Forecast - by Application
- 6. Global Medium Power And High Power Led Lighting Driver Analysis, Insights and Forecast, 2021-2033
- 6.1. Market Analysis, Insights and Forecast - by Application
- 6.1.1. Street
- 6.1.2. Park
- 6.1.3. Others
- 6.2. Market Analysis, Insights and Forecast - by Type
- 6.2.1. High Power
- 6.2.2. Medium Power
- 6.1. Market Analysis, Insights and Forecast - by Application
- 7. North America Medium Power And High Power Led Lighting Driver Analysis, Insights and Forecast, 2020-2032
- 7.1. Market Analysis, Insights and Forecast - by Application
- 7.1.1. Street
- 7.1.2. Park
- 7.1.3. Others
- 7.2. Market Analysis, Insights and Forecast - by Type
- 7.2.1. High Power
- 7.2.2. Medium Power
- 7.1. Market Analysis, Insights and Forecast - by Application
- 8. South America Medium Power And High Power Led Lighting Driver Analysis, Insights and Forecast, 2020-2032
- 8.1. Market Analysis, Insights and Forecast - by Application
- 8.1.1. Street
- 8.1.2. Park
- 8.1.3. Others
- 8.2. Market Analysis, Insights and Forecast - by Type
- 8.2.1. High Power
- 8.2.2. Medium Power
- 8.1. Market Analysis, Insights and Forecast - by Application
- 9. Europe Medium Power And High Power Led Lighting Driver Analysis, Insights and Forecast, 2020-2032
- 9.1. Market Analysis, Insights and Forecast - by Application
- 9.1.1. Street
- 9.1.2. Park
- 9.1.3. Others
- 9.2. Market Analysis, Insights and Forecast - by Type
- 9.2.1. High Power
- 9.2.2. Medium Power
- 9.1. Market Analysis, Insights and Forecast - by Application
- 10. Middle East & Africa Medium Power And High Power Led Lighting Driver Analysis, Insights and Forecast, 2020-2032
- 10.1. Market Analysis, Insights and Forecast - by Application
- 10.1.1. Street
- 10.1.2. Park
- 10.1.3. Others
- 10.2. Market Analysis, Insights and Forecast - by Type
- 10.2.1. High Power
- 10.2.2. Medium Power
- 10.1. Market Analysis, Insights and Forecast - by Application
- 11. Asia Pacific Medium Power And High Power Led Lighting Driver Analysis, Insights and Forecast, 2020-2032
- 11.1. Market Analysis, Insights and Forecast - by Application
- 11.1.1. Street
- 11.1.2. Park
- 11.1.3. Others
- 11.2. Market Analysis, Insights and Forecast - by Type
- 11.2.1. High Power
- 11.2.2. Medium Power
- 11.1. Market Analysis, Insights and Forecast - by Application
- 12. Competitive Analysis
- 12.1. Company Profiles
- 12.1.1 MEAN WELL
- 12.1.1.1. Company Overview
- 12.1.1.2. Products
- 12.1.1.3. Company Financials
- 12.1.1.4. SWOT Analysis
- 12.1.2 Philips
- 12.1.2.1. Company Overview
- 12.1.2.2. Products
- 12.1.2.3. Company Financials
- 12.1.2.4. SWOT Analysis
- 12.1.3 Inventronics
- 12.1.3.1. Company Overview
- 12.1.3.2. Products
- 12.1.3.3. Company Financials
- 12.1.3.4. SWOT Analysis
- 12.1.4 Tridonic
- 12.1.4.1. Company Overview
- 12.1.4.2. Products
- 12.1.4.3. Company Financials
- 12.1.4.4. SWOT Analysis
- 12.1.5 Delta Eletronics
- 12.1.5.1. Company Overview
- 12.1.5.2. Products
- 12.1.5.3. Company Financials
- 12.1.5.4. SWOT Analysis
- 12.1.6 MOSO Power
- 12.1.6.1. Company Overview
- 12.1.6.2. Products
- 12.1.6.3. Company Financials
- 12.1.6.4. SWOT Analysis
- 12.1.7 Eaglerise
- 12.1.7.1. Company Overview
- 12.1.7.2. Products
- 12.1.7.3. Company Financials
- 12.1.7.4. SWOT Analysis
- 12.1.8 SOSEN Electronics
- 12.1.8.1. Company Overview
- 12.1.8.2. Products
- 12.1.8.3. Company Financials
- 12.1.8.4. SWOT Analysis
- 12.1.9 TCI
- 12.1.9.1. Company Overview
- 12.1.9.2. Products
- 12.1.9.3. Company Financials
- 12.1.9.4. SWOT Analysis
- 12.1.10 Osram
- 12.1.10.1. Company Overview
- 12.1.10.2. Products
- 12.1.10.3. Company Financials
- 12.1.10.4. SWOT Analysis
- 12.1.11 LIFUD
- 12.1.11.1. Company Overview
- 12.1.11.2. Products
- 12.1.11.3. Company Financials
- 12.1.11.4. SWOT Analysis
- 12.1.12 HEP
- 12.1.12.1. Company Overview
- 12.1.12.2. Products
- 12.1.12.3. Company Financials
- 12.1.12.4. SWOT Analysis
- 12.1.1 MEAN WELL
- 12.2. Market Entropy
- 12.2.1 Company's Key Areas Served
- 12.2.2 Recent Developments
- 12.3. Company Market Share Analysis 2025
- 12.3.1 Top 5 Companies Market Share Analysis
- 12.3.2 Top 3 Companies Market Share Analysis
- 12.4. List of Potential Customers
- 13. Research Methodology
List of Figures
- Figure 1: Global Medium Power And High Power Led Lighting Driver Revenue Breakdown (million, %) by Region 2025 & 2033
- Figure 2: North America Medium Power And High Power Led Lighting Driver Revenue (million), by Application 2025 & 2033
- Figure 3: North America Medium Power And High Power Led Lighting Driver Revenue Share (%), by Application 2025 & 2033
- Figure 4: North America Medium Power And High Power Led Lighting Driver Revenue (million), by Type 2025 & 2033
- Figure 5: North America Medium Power And High Power Led Lighting Driver Revenue Share (%), by Type 2025 & 2033
- Figure 6: North America Medium Power And High Power Led Lighting Driver Revenue (million), by Country 2025 & 2033
- Figure 7: North America Medium Power And High Power Led Lighting Driver Revenue Share (%), by Country 2025 & 2033
- Figure 8: South America Medium Power And High Power Led Lighting Driver Revenue (million), by Application 2025 & 2033
- Figure 9: South America Medium Power And High Power Led Lighting Driver Revenue Share (%), by Application 2025 & 2033
- Figure 10: South America Medium Power And High Power Led Lighting Driver Revenue (million), by Type 2025 & 2033
- Figure 11: South America Medium Power And High Power Led Lighting Driver Revenue Share (%), by Type 2025 & 2033
- Figure 12: South America Medium Power And High Power Led Lighting Driver Revenue (million), by Country 2025 & 2033
- Figure 13: South America Medium Power And High Power Led Lighting Driver Revenue Share (%), by Country 2025 & 2033
- Figure 14: Europe Medium Power And High Power Led Lighting Driver Revenue (million), by Application 2025 & 2033
- Figure 15: Europe Medium Power And High Power Led Lighting Driver Revenue Share (%), by Application 2025 & 2033
- Figure 16: Europe Medium Power And High Power Led Lighting Driver Revenue (million), by Type 2025 & 2033
- Figure 17: Europe Medium Power And High Power Led Lighting Driver Revenue Share (%), by Type 2025 & 2033
- Figure 18: Europe Medium Power And High Power Led Lighting Driver Revenue (million), by Country 2025 & 2033
- Figure 19: Europe Medium Power And High Power Led Lighting Driver Revenue Share (%), by Country 2025 & 2033
- Figure 20: Middle East & Africa Medium Power And High Power Led Lighting Driver Revenue (million), by Application 2025 & 2033
- Figure 21: Middle East & Africa Medium Power And High Power Led Lighting Driver Revenue Share (%), by Application 2025 & 2033
- Figure 22: Middle East & Africa Medium Power And High Power Led Lighting Driver Revenue (million), by Type 2025 & 2033
- Figure 23: Middle East & Africa Medium Power And High Power Led Lighting Driver Revenue Share (%), by Type 2025 & 2033
- Figure 24: Middle East & Africa Medium Power And High Power Led Lighting Driver Revenue (million), by Country 2025 & 2033
- Figure 25: Middle East & Africa Medium Power And High Power Led Lighting Driver Revenue Share (%), by Country 2025 & 2033
- Figure 26: Asia Pacific Medium Power And High Power Led Lighting Driver Revenue (million), by Application 2025 & 2033
- Figure 27: Asia Pacific Medium Power And High Power Led Lighting Driver Revenue Share (%), by Application 2025 & 2033
- Figure 28: Asia Pacific Medium Power And High Power Led Lighting Driver Revenue (million), by Type 2025 & 2033
- Figure 29: Asia Pacific Medium Power And High Power Led Lighting Driver Revenue Share (%), by Type 2025 & 2033
- Figure 30: Asia Pacific Medium Power And High Power Led Lighting Driver Revenue (million), by Country 2025 & 2033
- Figure 31: Asia Pacific Medium Power And High Power Led Lighting Driver Revenue Share (%), by Country 2025 & 2033
List of Tables
- Table 1: Global Medium Power And High Power Led Lighting Driver Revenue million Forecast, by Application 2020 & 2033
- Table 2: Global Medium Power And High Power Led Lighting Driver Revenue million Forecast, by Type 2020 & 2033
- Table 3: Global Medium Power And High Power Led Lighting Driver Revenue million Forecast, by Region 2020 & 2033
- Table 4: Global Medium Power And High Power Led Lighting Driver Revenue million Forecast, by Application 2020 & 2033
- Table 5: Global Medium Power And High Power Led Lighting Driver Revenue million Forecast, by Type 2020 & 2033
- Table 6: Global Medium Power And High Power Led Lighting Driver Revenue million Forecast, by Country 2020 & 2033
- Table 7: United States Medium Power And High Power Led Lighting Driver Revenue (million) Forecast, by Application 2020 & 2033
- Table 8: Canada Medium Power And High Power Led Lighting Driver Revenue (million) Forecast, by Application 2020 & 2033
- Table 9: Mexico Medium Power And High Power Led Lighting Driver Revenue (million) Forecast, by Application 2020 & 2033
- Table 10: Global Medium Power And High Power Led Lighting Driver Revenue million Forecast, by Application 2020 & 2033
- Table 11: Global Medium Power And High Power Led Lighting Driver Revenue million Forecast, by Type 2020 & 2033
- Table 12: Global Medium Power And High Power Led Lighting Driver Revenue million Forecast, by Country 2020 & 2033
- Table 13: Brazil Medium Power And High Power Led Lighting Driver Revenue (million) Forecast, by Application 2020 & 2033
- Table 14: Argentina Medium Power And High Power Led Lighting Driver Revenue (million) Forecast, by Application 2020 & 2033
- Table 15: Rest of South America Medium Power And High Power Led Lighting Driver Revenue (million) Forecast, by Application 2020 & 2033
- Table 16: Global Medium Power And High Power Led Lighting Driver Revenue million Forecast, by Application 2020 & 2033
- Table 17: Global Medium Power And High Power Led Lighting Driver Revenue million Forecast, by Type 2020 & 2033
- Table 18: Global Medium Power And High Power Led Lighting Driver Revenue million Forecast, by Country 2020 & 2033
- Table 19: United Kingdom Medium Power And High Power Led Lighting Driver Revenue (million) Forecast, by Application 2020 & 2033
- Table 20: Germany Medium Power And High Power Led Lighting Driver Revenue (million) Forecast, by Application 2020 & 2033
- Table 21: France Medium Power And High Power Led Lighting Driver Revenue (million) Forecast, by Application 2020 & 2033
- Table 22: Italy Medium Power And High Power Led Lighting Driver Revenue (million) Forecast, by Application 2020 & 2033
- Table 23: Spain Medium Power And High Power Led Lighting Driver Revenue (million) Forecast, by Application 2020 & 2033
- Table 24: Russia Medium Power And High Power Led Lighting Driver Revenue (million) Forecast, by Application 2020 & 2033
- Table 25: Benelux Medium Power And High Power Led Lighting Driver Revenue (million) Forecast, by Application 2020 & 2033
- Table 26: Nordics Medium Power And High Power Led Lighting Driver Revenue (million) Forecast, by Application 2020 & 2033
- Table 27: Rest of Europe Medium Power And High Power Led Lighting Driver Revenue (million) Forecast, by Application 2020 & 2033
- Table 28: Global Medium Power And High Power Led Lighting Driver Revenue million Forecast, by Application 2020 & 2033
- Table 29: Global Medium Power And High Power Led Lighting Driver Revenue million Forecast, by Type 2020 & 2033
- Table 30: Global Medium Power And High Power Led Lighting Driver Revenue million Forecast, by Country 2020 & 2033
- Table 31: Turkey Medium Power And High Power Led Lighting Driver Revenue (million) Forecast, by Application 2020 & 2033
- Table 32: Israel Medium Power And High Power Led Lighting Driver Revenue (million) Forecast, by Application 2020 & 2033
- Table 33: GCC Medium Power And High Power Led Lighting Driver Revenue (million) Forecast, by Application 2020 & 2033
- Table 34: North Africa Medium Power And High Power Led Lighting Driver Revenue (million) Forecast, by Application 2020 & 2033
- Table 35: South Africa Medium Power And High Power Led Lighting Driver Revenue (million) Forecast, by Application 2020 & 2033
- Table 36: Rest of Middle East & Africa Medium Power And High Power Led Lighting Driver Revenue (million) Forecast, by Application 2020 & 2033
- Table 37: Global Medium Power And High Power Led Lighting Driver Revenue million Forecast, by Application 2020 & 2033
- Table 38: Global Medium Power And High Power Led Lighting Driver Revenue million Forecast, by Type 2020 & 2033
- Table 39: Global Medium Power And High Power Led Lighting Driver Revenue million Forecast, by Country 2020 & 2033
- Table 40: China Medium Power And High Power Led Lighting Driver Revenue (million) Forecast, by Application 2020 & 2033
- Table 41: India Medium Power And High Power Led Lighting Driver Revenue (million) Forecast, by Application 2020 & 2033
- Table 42: Japan Medium Power And High Power Led Lighting Driver Revenue (million) Forecast, by Application 2020 & 2033
- Table 43: South Korea Medium Power And High Power Led Lighting Driver Revenue (million) Forecast, by Application 2020 & 2033
- Table 44: ASEAN Medium Power And High Power Led Lighting Driver Revenue (million) Forecast, by Application 2020 & 2033
- Table 45: Oceania Medium Power And High Power Led Lighting Driver Revenue (million) Forecast, by Application 2020 & 2033
- Table 46: Rest of Asia Pacific Medium Power And High Power Led Lighting Driver Revenue (million) Forecast, by Application 2020 & 2033
Frequently Asked Questions
1. What is the projected Compound Annual Growth Rate (CAGR) of the Medium Power And High Power Led Lighting Driver?
The projected CAGR is approximately 8%.
2. Which companies are prominent players in the Medium Power And High Power Led Lighting Driver?
Key companies in the market include MEAN WELL, Philips, Inventronics, Tridonic, Delta Eletronics, MOSO Power, Eaglerise, SOSEN Electronics, TCI, Osram, LIFUD, HEP.
3. What are the main segments of the Medium Power And High Power Led Lighting Driver?
The market segments include Application, Type.
4. Can you provide details about the market size?
The market size is estimated to be USD 5785 million as of 2022.
5. What are some drivers contributing to market growth?
N/A
6. What are the notable trends driving market growth?
N/A
7. Are there any restraints impacting market growth?
N/A
8. Can you provide examples of recent developments in the market?
N/A
9. What pricing options are available for accessing the report?
Pricing options include single-user, multi-user, and enterprise licenses priced at USD 2900.00, USD 4350.00, and USD 5800.00 respectively.
10. Is the market size provided in terms of value or volume?
The market size is provided in terms of value, measured in million.
11. Are there any specific market keywords associated with the report?
Yes, the market keyword associated with the report is "Medium Power And High Power Led Lighting Driver," which aids in identifying and referencing the specific market segment covered.
12. How do I determine which pricing option suits my needs best?
The pricing options vary based on user requirements and access needs. Individual users may opt for single-user licenses, while businesses requiring broader access may choose multi-user or enterprise licenses for cost-effective access to the report.
13. Are there any additional resources or data provided in the Medium Power And High Power Led Lighting Driver report?
While the report offers comprehensive insights, it's advisable to review the specific contents or supplementary materials provided to ascertain if additional resources or data are available.
14. How can I stay updated on further developments or reports in the Medium Power And High Power Led Lighting Driver?
To stay informed about further developments, trends, and reports in the Medium Power And High Power Led Lighting Driver, consider subscribing to industry newsletters, following relevant companies and organizations, or regularly checking reputable industry news sources and publications.
Methodology
Step 1 - Identification of Relevant Samples Size from Population Database


Step 2 - Approaches for Defining Global Market Size (Value, Volume* & Price*)

Note*: In applicable scenarios
Step 3 - Data Sources
Primary Research
- Web Analytics
- Survey Reports
- Research Institute
- Latest Research Reports
- Opinion Leaders
Secondary Research
- Annual Reports
- White Paper
- Latest Press Release
- Industry Association
- Paid Database
- Investor Presentations

Step 4 - Data Triangulation
Involves using different sources of information in order to increase the validity of a study
These sources are likely to be stakeholders in a program - participants, other researchers, program staff, other community members, and so on.
Then we put all data in single framework & apply various statistical tools to find out the dynamic on the market.
During the analysis stage, feedback from the stakeholder groups would be compared to determine areas of agreement as well as areas of divergence