

Key Insights
The Magnetic Optical Current Transformer (MOCT) market is poised for significant expansion, driven by the escalating adoption of Advanced Metering Infrastructure (AMI) and sophisticated smart grid technologies. This growth is underpinned by the critical need for highly accurate and dependable current measurement within power systems, especially in applications demanding superior precision and broad bandwidth. Key catalysts include the increasing integration of renewable energy, the imperative for enhanced grid stability and efficiency, and stringent regulatory mandates for advanced metering solutions. MOCTs offer distinct advantages such as immunity to electromagnetic interference, a compact form factor, and reduced weight over traditional current transformers, further bolstering market demand. With a projected Compound Annual Growth Rate (CAGR) of 8.4%, the market is estimated to reach $185.2 million by 2025. Continued smart grid deployments and the expanding scope of energy management systems are expected to sustain this growth trajectory through 2033.
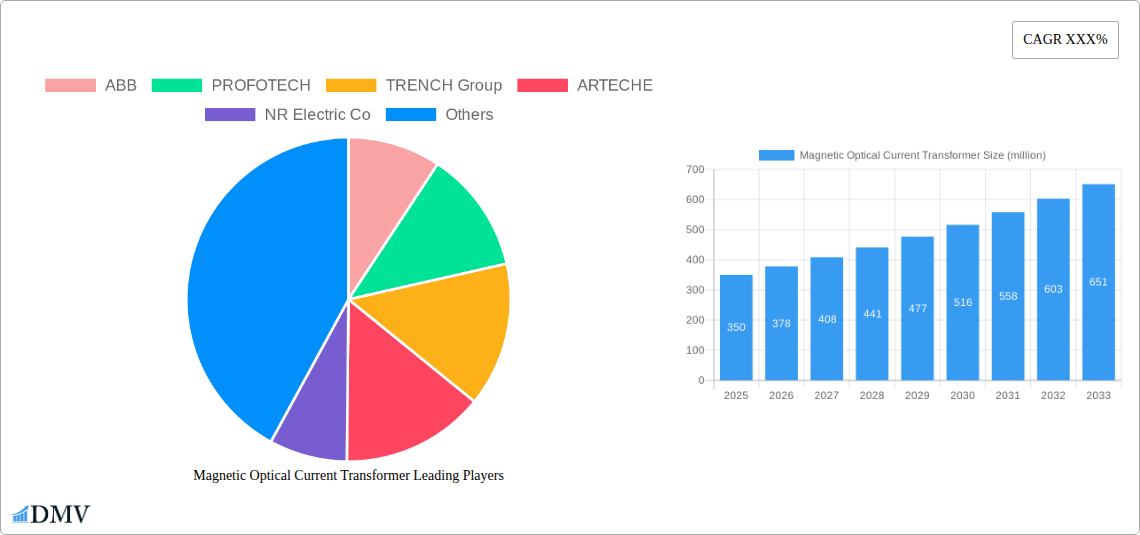
Magnetic Optical Current Transformer Market Size (In Million)
Potential market restraints include substantial initial investment requirements for MOCT installation and the risk of technological obsolescence, which may temper adoption in specific segments. Competition from alternative current measurement technologies, such as Electronic Current Transformers (ECTs), also presents a challenge. Nevertheless, the long-term outlook for the MOCT market remains optimistic, with considerable opportunities arising from the evolving energy sector landscape and an intensified focus on grid modernization and smart city initiatives. Utility applications represent the dominant market segment, followed by industrial and commercial applications. Leading companies including ABB, Profotech, Trench Group, Arteche, and NR Electric Co. are actively driving innovation and expanding their market footprint through product development and strategic alliances. Regions with substantial power infrastructure development and smart grid investments are anticipated to experience accelerated market growth.
Magnetic Optical Current Transformer Company Market Share
Magnetic Optical Current Transformer Market Report: A Comprehensive Analysis (2019-2033)
This insightful report provides a comprehensive analysis of the Magnetic Optical Current Transformer (MOCT) market, offering a detailed forecast from 2025 to 2033, based on historical data from 2019 to 2024. The report delves into market size, growth drivers, challenges, and key players, equipping stakeholders with critical insights to navigate this dynamic sector. With a market valuation exceeding $XX million in 2025, and projected to reach $XX million by 2033, the MOCT market presents significant opportunities and challenges. This report meticulously examines these aspects, offering a clear roadmap for future investments and strategic planning.
Magnetic Optical Current Transformer Market Composition & Trends
This section analyzes the market concentration, innovation landscape, regulatory environment, substitute products, end-user profiles, and merger & acquisition (M&A) activity within the MOCT market. The market is moderately concentrated, with several key players holding significant shares. ABB, PROFOTECH, TRENCH Group, ARTECHE, and NR Electric Co. are prominent examples. The combined market share of the top five players is estimated at xx%.
Market Share Distribution (2025):
- ABB: xx%
- PROFOTECH: xx%
- TRENCH Group: xx%
- ARTECHE: xx%
- NR Electric Co.: xx%
- Others: xx%
Innovation Catalysts & Regulatory Landscape:
Ongoing advancements in optical sensing technology and the increasing demand for precise and reliable current measurement solutions are major drivers of innovation. Stringent safety regulations in the power industry drive the adoption of MOCTs, replacing traditional current transformers.
Substitute Products & End-User Profiles:
Traditional current transformers remain a primary substitute, but MOCTs are rapidly gaining traction due to their superior performance in high-voltage applications and enhanced safety features. Major end-users include power utilities, industrial automation sectors, and renewable energy installations.
M&A Activities:
The MOCT market has witnessed several M&A activities in the past five years, with total deal values exceeding $XX million. These activities are primarily driven by companies' strategies to expand their market share and enhance their product portfolio.
Magnetic Optical Current Transformer Industry Evolution
The MOCT market has experienced significant growth over the historical period (2019-2024), with a Compound Annual Growth Rate (CAGR) of xx%. This growth is primarily attributed to the increasing demand for smart grids, the adoption of renewable energy sources, and improvements in MOCT technology. The forecast period (2025-2033) is expected to witness continued growth, driven by factors such as the increasing integration of IoT devices, smart city initiatives, and the rising adoption of advanced grid management systems. Technological advancements, such as the development of higher-bandwidth optical fibers and improved signal processing techniques, are further fueling market expansion. Consumer demand is shifting towards high-accuracy, reliable, and safer current measurement solutions, driving the adoption of MOCTs over traditional counterparts. The market is projected to grow at a CAGR of xx% during the forecast period, reaching an estimated value of $XX million by 2033.
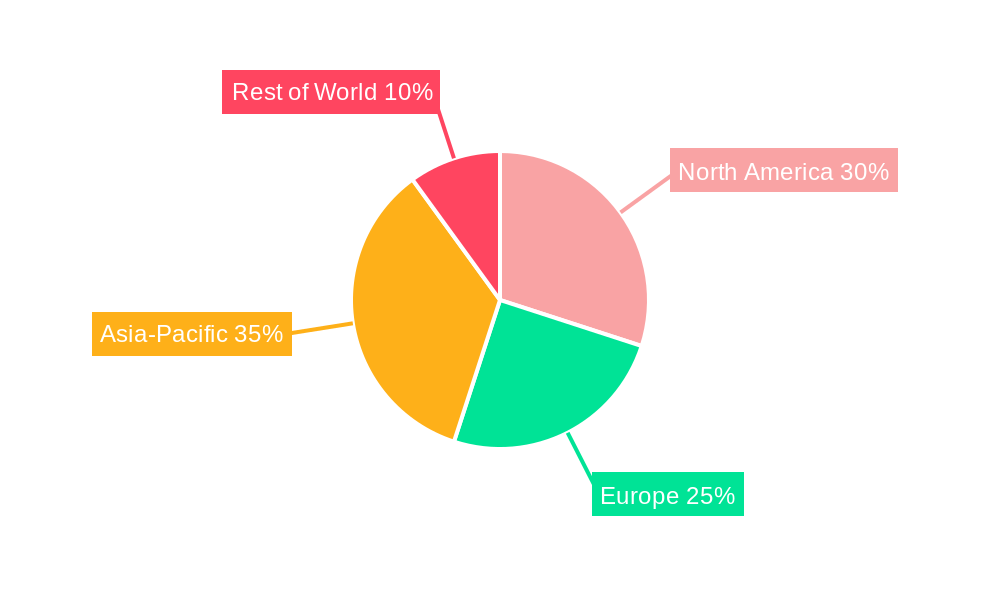
Leading Regions, Countries, or Segments in Magnetic Optical Current Transformer
The Asia-Pacific region is currently the leading market for MOCTs, driven by substantial investments in renewable energy infrastructure and rapid urbanization. This is followed by North America and Europe, both of which are experiencing steady growth.
Key Drivers in the Asia-Pacific Region:
- Significant Investments in Renewable Energy: Governments in several Asian countries are heavily investing in solar and wind power projects, driving the demand for reliable current measurement solutions.
- Rapid Urbanization and Industrialization: The rapid growth of cities and industries necessitates robust and efficient power grids, fueling the adoption of MOCTs.
- Supportive Government Policies: Various government initiatives and policies are promoting the adoption of advanced grid technologies, including MOCTs.
Factors Contributing to Regional Dominance:
The dominance of the Asia-Pacific region stems from a combination of factors, including high economic growth, increasing energy demands, supportive government policies promoting renewable energy, and a favorable regulatory environment. Furthermore, the region's large manufacturing base and the presence of key MOCT manufacturers significantly contribute to its leading position in the global market.
Magnetic Optical Current Transformer Product Innovations
Recent innovations in MOCT technology include the development of miniaturized sensors, improved optical fiber designs, and advanced signal processing algorithms. These advancements have led to enhanced accuracy, increased bandwidth, and improved immunity to electromagnetic interference. The improved performance metrics, along with compact designs and enhanced safety features, are key selling propositions attracting a broader range of customers. These innovations are broadening the application range of MOCTs into areas such as smart grids, microgrids, and industrial automation, significantly contributing to the market's growth trajectory.
Propelling Factors for Magnetic Optical Current Transformer Growth
Several factors are propelling the growth of the MOCT market. The increasing demand for smart grids, which requires precise and reliable current measurement, is a major driver. Furthermore, stringent safety regulations in the power industry are pushing the adoption of MOCTs as a safer alternative to traditional current transformers. The global push towards renewable energy sources and the expansion of industrial automation further stimulate market expansion. Economic growth and investments in infrastructure projects also contribute significantly to market growth.
Obstacles in the Magnetic Optical Current Transformer Market
Despite its growth potential, the MOCT market faces several challenges. The high initial cost of MOCTs compared to traditional current transformers can be a barrier to entry for some customers. Supply chain disruptions, particularly in the procurement of specialized optical components, can also impact market growth. Moreover, intense competition from established players and the emergence of new entrants can create pressure on pricing and margins. These obstacles, though substantial, are not insurmountable and can be mitigated through technological advancements and strategic partnerships.
Future Opportunities in Magnetic Optical Current Transformer
The future of the MOCT market is bright, with several emerging opportunities. The integration of MOCTs into next-generation smart grids and the expansion into new applications, such as electric vehicle charging infrastructure and microgrids, present significant potential. The development of more cost-effective manufacturing processes and the exploration of new materials for improved performance will further unlock market opportunities. Furthermore, the increasing adoption of digital technologies in the power industry opens up avenues for innovative data analytics and predictive maintenance solutions based on MOCT data.
Major Players in the Magnetic Optical Current Transformer Ecosystem
- ABB
- PROFOTECH
- TRENCH Group
- ARTECHE
- NR Electric Co
Key Developments in Magnetic Optical Current Transformer Industry
- 2022 Q3: ABB launched a new generation of MOCT with improved accuracy and bandwidth.
- 2021 Q4: PROFOTECH announced a strategic partnership to expand its global reach.
- 2020 Q2: ARTECHE acquired a smaller MOCT manufacturer, enhancing its product portfolio.
- 2019 Q1: NR Electric Co. secured a major contract for MOCT supply for a large-scale renewable energy project.
Strategic Magnetic Optical Current Transformer Market Forecast
The MOCT market is poised for substantial growth in the coming years, driven by technological advancements, increasing demand for smart grids, and the global push towards renewable energy. The continued innovation in optical sensing technology and the development of more cost-effective solutions will unlock further market potential. The ongoing regulatory push for safer and more reliable current measurement solutions will further solidify the position of MOCTs as the preferred choice in various applications. The market is expected to witness strong growth throughout the forecast period, presenting significant opportunities for established players and new entrants alike.
Magnetic Optical Current Transformer Segmentation
-
1. Application
- 1.1. Transformer
- 1.2. Electronic Measurement Devices
- 1.3. Networking Devices
- 1.4. Power Systems & Instrumentations
- 1.5. Transmission Line-bus
- 1.6. Electrical High Voltage (EHV) Substations
-
2. Type
- 2.1. Fiber Type
- 2.2. Non-fiber Type
Magnetic Optical Current Transformer Segmentation By Geography
-
1. North America
- 1.1. United States
- 1.2. Canada
- 1.3. Mexico
-
2. South America
- 2.1. Brazil
- 2.2. Argentina
- 2.3. Rest of South America
-
3. Europe
- 3.1. United Kingdom
- 3.2. Germany
- 3.3. France
- 3.4. Italy
- 3.5. Spain
- 3.6. Russia
- 3.7. Benelux
- 3.8. Nordics
- 3.9. Rest of Europe
-
4. Middle East & Africa
- 4.1. Turkey
- 4.2. Israel
- 4.3. GCC
- 4.4. North Africa
- 4.5. South Africa
- 4.6. Rest of Middle East & Africa
-
5. Asia Pacific
- 5.1. China
- 5.2. India
- 5.3. Japan
- 5.4. South Korea
- 5.5. ASEAN
- 5.6. Oceania
- 5.7. Rest of Asia Pacific
Magnetic Optical Current Transformer Regional Market Share
Geographic Coverage of Magnetic Optical Current Transformer
Magnetic Optical Current Transformer REPORT HIGHLIGHTS
| Aspects | Details |
|---|---|
| Study Period | 2020-2034 |
| Base Year | 2025 |
| Estimated Year | 2026 |
| Forecast Period | 2026-2034 |
| Historical Period | 2020-2025 |
| Growth Rate | CAGR of 8.4% from 2020-2034 |
| Segmentation |
|
Table of Contents
- 1. Introduction
- 1.1. Research Scope
- 1.2. Market Segmentation
- 1.3. Research Objective
- 1.4. Definitions and Assumptions
- 2. Executive Summary
- 2.1. Market Snapshot
- 3. Market Dynamics
- 3.1. Market Drivers
- 3.2. Market Restrains
- 3.3. Market Trends
- 3.4. Market Opportunities
- 4. Market Factor Analysis
- 4.1. Porters Five Forces
- 4.1.1. Bargaining Power of Suppliers
- 4.1.2. Bargaining Power of Buyers
- 4.1.3. Threat of New Entrants
- 4.1.4. Threat of Substitutes
- 4.1.5. Competitive Rivalry
- 4.2. PESTEL analysis
- 4.3. BCG Analysis
- 4.3.1. Stars (High Growth, High Market Share)
- 4.3.2. Cash Cows (Low Growth, High Market Share)
- 4.3.3. Question Mark (High Growth, Low Market Share)
- 4.3.4. Dogs (Low Growth, Low Market Share)
- 4.4. Ansoff Matrix Analysis
- 4.5. Supply Chain Analysis
- 4.6. Regulatory Landscape
- 4.7. Current Market Potential and Opportunity Assessment (TAM–SAM–SOM Framework)
- 4.8. DMV Analyst Note
- 4.1. Porters Five Forces
- 5. Market Analysis, Insights and Forecast 2021-2033
- 5.1. Market Analysis, Insights and Forecast - by Application
- 5.1.1. Transformer
- 5.1.2. Electronic Measurement Devices
- 5.1.3. Networking Devices
- 5.1.4. Power Systems & Instrumentations
- 5.1.5. Transmission Line-bus
- 5.1.6. Electrical High Voltage (EHV) Substations
- 5.2. Market Analysis, Insights and Forecast - by Type
- 5.2.1. Fiber Type
- 5.2.2. Non-fiber Type
- 5.3. Market Analysis, Insights and Forecast - by Region
- 5.3.1. North America
- 5.3.2. South America
- 5.3.3. Europe
- 5.3.4. Middle East & Africa
- 5.3.5. Asia Pacific
- 5.1. Market Analysis, Insights and Forecast - by Application
- 6. Global Magnetic Optical Current Transformer Analysis, Insights and Forecast, 2021-2033
- 6.1. Market Analysis, Insights and Forecast - by Application
- 6.1.1. Transformer
- 6.1.2. Electronic Measurement Devices
- 6.1.3. Networking Devices
- 6.1.4. Power Systems & Instrumentations
- 6.1.5. Transmission Line-bus
- 6.1.6. Electrical High Voltage (EHV) Substations
- 6.2. Market Analysis, Insights and Forecast - by Type
- 6.2.1. Fiber Type
- 6.2.2. Non-fiber Type
- 6.1. Market Analysis, Insights and Forecast - by Application
- 7. North America Magnetic Optical Current Transformer Analysis, Insights and Forecast, 2020-2032
- 7.1. Market Analysis, Insights and Forecast - by Application
- 7.1.1. Transformer
- 7.1.2. Electronic Measurement Devices
- 7.1.3. Networking Devices
- 7.1.4. Power Systems & Instrumentations
- 7.1.5. Transmission Line-bus
- 7.1.6. Electrical High Voltage (EHV) Substations
- 7.2. Market Analysis, Insights and Forecast - by Type
- 7.2.1. Fiber Type
- 7.2.2. Non-fiber Type
- 7.1. Market Analysis, Insights and Forecast - by Application
- 8. South America Magnetic Optical Current Transformer Analysis, Insights and Forecast, 2020-2032
- 8.1. Market Analysis, Insights and Forecast - by Application
- 8.1.1. Transformer
- 8.1.2. Electronic Measurement Devices
- 8.1.3. Networking Devices
- 8.1.4. Power Systems & Instrumentations
- 8.1.5. Transmission Line-bus
- 8.1.6. Electrical High Voltage (EHV) Substations
- 8.2. Market Analysis, Insights and Forecast - by Type
- 8.2.1. Fiber Type
- 8.2.2. Non-fiber Type
- 8.1. Market Analysis, Insights and Forecast - by Application
- 9. Europe Magnetic Optical Current Transformer Analysis, Insights and Forecast, 2020-2032
- 9.1. Market Analysis, Insights and Forecast - by Application
- 9.1.1. Transformer
- 9.1.2. Electronic Measurement Devices
- 9.1.3. Networking Devices
- 9.1.4. Power Systems & Instrumentations
- 9.1.5. Transmission Line-bus
- 9.1.6. Electrical High Voltage (EHV) Substations
- 9.2. Market Analysis, Insights and Forecast - by Type
- 9.2.1. Fiber Type
- 9.2.2. Non-fiber Type
- 9.1. Market Analysis, Insights and Forecast - by Application
- 10. Middle East & Africa Magnetic Optical Current Transformer Analysis, Insights and Forecast, 2020-2032
- 10.1. Market Analysis, Insights and Forecast - by Application
- 10.1.1. Transformer
- 10.1.2. Electronic Measurement Devices
- 10.1.3. Networking Devices
- 10.1.4. Power Systems & Instrumentations
- 10.1.5. Transmission Line-bus
- 10.1.6. Electrical High Voltage (EHV) Substations
- 10.2. Market Analysis, Insights and Forecast - by Type
- 10.2.1. Fiber Type
- 10.2.2. Non-fiber Type
- 10.1. Market Analysis, Insights and Forecast - by Application
- 11. Asia Pacific Magnetic Optical Current Transformer Analysis, Insights and Forecast, 2020-2032
- 11.1. Market Analysis, Insights and Forecast - by Application
- 11.1.1. Transformer
- 11.1.2. Electronic Measurement Devices
- 11.1.3. Networking Devices
- 11.1.4. Power Systems & Instrumentations
- 11.1.5. Transmission Line-bus
- 11.1.6. Electrical High Voltage (EHV) Substations
- 11.2. Market Analysis, Insights and Forecast - by Type
- 11.2.1. Fiber Type
- 11.2.2. Non-fiber Type
- 11.1. Market Analysis, Insights and Forecast - by Application
- 12. Competitive Analysis
- 12.1. Company Profiles
- 12.1.1 ABB
- 12.1.1.1. Company Overview
- 12.1.1.2. Products
- 12.1.1.3. Company Financials
- 12.1.1.4. SWOT Analysis
- 12.1.2 PROFOTECH
- 12.1.2.1. Company Overview
- 12.1.2.2. Products
- 12.1.2.3. Company Financials
- 12.1.2.4. SWOT Analysis
- 12.1.3 TRENCH Group
- 12.1.3.1. Company Overview
- 12.1.3.2. Products
- 12.1.3.3. Company Financials
- 12.1.3.4. SWOT Analysis
- 12.1.4 ARTECHE
- 12.1.4.1. Company Overview
- 12.1.4.2. Products
- 12.1.4.3. Company Financials
- 12.1.4.4. SWOT Analysis
- 12.1.5 NR Electric Co
- 12.1.5.1. Company Overview
- 12.1.5.2. Products
- 12.1.5.3. Company Financials
- 12.1.5.4. SWOT Analysis
- 12.1.1 ABB
- 12.2. Market Entropy
- 12.2.1 Company's Key Areas Served
- 12.2.2 Recent Developments
- 12.3. Company Market Share Analysis 2025
- 12.3.1 Top 5 Companies Market Share Analysis
- 12.3.2 Top 3 Companies Market Share Analysis
- 12.4. List of Potential Customers
- 13. Research Methodology
List of Figures
- Figure 1: Global Magnetic Optical Current Transformer Revenue Breakdown (million, %) by Region 2025 & 2033
- Figure 2: North America Magnetic Optical Current Transformer Revenue (million), by Application 2025 & 2033
- Figure 3: North America Magnetic Optical Current Transformer Revenue Share (%), by Application 2025 & 2033
- Figure 4: North America Magnetic Optical Current Transformer Revenue (million), by Type 2025 & 2033
- Figure 5: North America Magnetic Optical Current Transformer Revenue Share (%), by Type 2025 & 2033
- Figure 6: North America Magnetic Optical Current Transformer Revenue (million), by Country 2025 & 2033
- Figure 7: North America Magnetic Optical Current Transformer Revenue Share (%), by Country 2025 & 2033
- Figure 8: South America Magnetic Optical Current Transformer Revenue (million), by Application 2025 & 2033
- Figure 9: South America Magnetic Optical Current Transformer Revenue Share (%), by Application 2025 & 2033
- Figure 10: South America Magnetic Optical Current Transformer Revenue (million), by Type 2025 & 2033
- Figure 11: South America Magnetic Optical Current Transformer Revenue Share (%), by Type 2025 & 2033
- Figure 12: South America Magnetic Optical Current Transformer Revenue (million), by Country 2025 & 2033
- Figure 13: South America Magnetic Optical Current Transformer Revenue Share (%), by Country 2025 & 2033
- Figure 14: Europe Magnetic Optical Current Transformer Revenue (million), by Application 2025 & 2033
- Figure 15: Europe Magnetic Optical Current Transformer Revenue Share (%), by Application 2025 & 2033
- Figure 16: Europe Magnetic Optical Current Transformer Revenue (million), by Type 2025 & 2033
- Figure 17: Europe Magnetic Optical Current Transformer Revenue Share (%), by Type 2025 & 2033
- Figure 18: Europe Magnetic Optical Current Transformer Revenue (million), by Country 2025 & 2033
- Figure 19: Europe Magnetic Optical Current Transformer Revenue Share (%), by Country 2025 & 2033
- Figure 20: Middle East & Africa Magnetic Optical Current Transformer Revenue (million), by Application 2025 & 2033
- Figure 21: Middle East & Africa Magnetic Optical Current Transformer Revenue Share (%), by Application 2025 & 2033
- Figure 22: Middle East & Africa Magnetic Optical Current Transformer Revenue (million), by Type 2025 & 2033
- Figure 23: Middle East & Africa Magnetic Optical Current Transformer Revenue Share (%), by Type 2025 & 2033
- Figure 24: Middle East & Africa Magnetic Optical Current Transformer Revenue (million), by Country 2025 & 2033
- Figure 25: Middle East & Africa Magnetic Optical Current Transformer Revenue Share (%), by Country 2025 & 2033
- Figure 26: Asia Pacific Magnetic Optical Current Transformer Revenue (million), by Application 2025 & 2033
- Figure 27: Asia Pacific Magnetic Optical Current Transformer Revenue Share (%), by Application 2025 & 2033
- Figure 28: Asia Pacific Magnetic Optical Current Transformer Revenue (million), by Type 2025 & 2033
- Figure 29: Asia Pacific Magnetic Optical Current Transformer Revenue Share (%), by Type 2025 & 2033
- Figure 30: Asia Pacific Magnetic Optical Current Transformer Revenue (million), by Country 2025 & 2033
- Figure 31: Asia Pacific Magnetic Optical Current Transformer Revenue Share (%), by Country 2025 & 2033
List of Tables
- Table 1: Global Magnetic Optical Current Transformer Revenue million Forecast, by Application 2020 & 2033
- Table 2: Global Magnetic Optical Current Transformer Revenue million Forecast, by Type 2020 & 2033
- Table 3: Global Magnetic Optical Current Transformer Revenue million Forecast, by Region 2020 & 2033
- Table 4: Global Magnetic Optical Current Transformer Revenue million Forecast, by Application 2020 & 2033
- Table 5: Global Magnetic Optical Current Transformer Revenue million Forecast, by Type 2020 & 2033
- Table 6: Global Magnetic Optical Current Transformer Revenue million Forecast, by Country 2020 & 2033
- Table 7: United States Magnetic Optical Current Transformer Revenue (million) Forecast, by Application 2020 & 2033
- Table 8: Canada Magnetic Optical Current Transformer Revenue (million) Forecast, by Application 2020 & 2033
- Table 9: Mexico Magnetic Optical Current Transformer Revenue (million) Forecast, by Application 2020 & 2033
- Table 10: Global Magnetic Optical Current Transformer Revenue million Forecast, by Application 2020 & 2033
- Table 11: Global Magnetic Optical Current Transformer Revenue million Forecast, by Type 2020 & 2033
- Table 12: Global Magnetic Optical Current Transformer Revenue million Forecast, by Country 2020 & 2033
- Table 13: Brazil Magnetic Optical Current Transformer Revenue (million) Forecast, by Application 2020 & 2033
- Table 14: Argentina Magnetic Optical Current Transformer Revenue (million) Forecast, by Application 2020 & 2033
- Table 15: Rest of South America Magnetic Optical Current Transformer Revenue (million) Forecast, by Application 2020 & 2033
- Table 16: Global Magnetic Optical Current Transformer Revenue million Forecast, by Application 2020 & 2033
- Table 17: Global Magnetic Optical Current Transformer Revenue million Forecast, by Type 2020 & 2033
- Table 18: Global Magnetic Optical Current Transformer Revenue million Forecast, by Country 2020 & 2033
- Table 19: United Kingdom Magnetic Optical Current Transformer Revenue (million) Forecast, by Application 2020 & 2033
- Table 20: Germany Magnetic Optical Current Transformer Revenue (million) Forecast, by Application 2020 & 2033
- Table 21: France Magnetic Optical Current Transformer Revenue (million) Forecast, by Application 2020 & 2033
- Table 22: Italy Magnetic Optical Current Transformer Revenue (million) Forecast, by Application 2020 & 2033
- Table 23: Spain Magnetic Optical Current Transformer Revenue (million) Forecast, by Application 2020 & 2033
- Table 24: Russia Magnetic Optical Current Transformer Revenue (million) Forecast, by Application 2020 & 2033
- Table 25: Benelux Magnetic Optical Current Transformer Revenue (million) Forecast, by Application 2020 & 2033
- Table 26: Nordics Magnetic Optical Current Transformer Revenue (million) Forecast, by Application 2020 & 2033
- Table 27: Rest of Europe Magnetic Optical Current Transformer Revenue (million) Forecast, by Application 2020 & 2033
- Table 28: Global Magnetic Optical Current Transformer Revenue million Forecast, by Application 2020 & 2033
- Table 29: Global Magnetic Optical Current Transformer Revenue million Forecast, by Type 2020 & 2033
- Table 30: Global Magnetic Optical Current Transformer Revenue million Forecast, by Country 2020 & 2033
- Table 31: Turkey Magnetic Optical Current Transformer Revenue (million) Forecast, by Application 2020 & 2033
- Table 32: Israel Magnetic Optical Current Transformer Revenue (million) Forecast, by Application 2020 & 2033
- Table 33: GCC Magnetic Optical Current Transformer Revenue (million) Forecast, by Application 2020 & 2033
- Table 34: North Africa Magnetic Optical Current Transformer Revenue (million) Forecast, by Application 2020 & 2033
- Table 35: South Africa Magnetic Optical Current Transformer Revenue (million) Forecast, by Application 2020 & 2033
- Table 36: Rest of Middle East & Africa Magnetic Optical Current Transformer Revenue (million) Forecast, by Application 2020 & 2033
- Table 37: Global Magnetic Optical Current Transformer Revenue million Forecast, by Application 2020 & 2033
- Table 38: Global Magnetic Optical Current Transformer Revenue million Forecast, by Type 2020 & 2033
- Table 39: Global Magnetic Optical Current Transformer Revenue million Forecast, by Country 2020 & 2033
- Table 40: China Magnetic Optical Current Transformer Revenue (million) Forecast, by Application 2020 & 2033
- Table 41: India Magnetic Optical Current Transformer Revenue (million) Forecast, by Application 2020 & 2033
- Table 42: Japan Magnetic Optical Current Transformer Revenue (million) Forecast, by Application 2020 & 2033
- Table 43: South Korea Magnetic Optical Current Transformer Revenue (million) Forecast, by Application 2020 & 2033
- Table 44: ASEAN Magnetic Optical Current Transformer Revenue (million) Forecast, by Application 2020 & 2033
- Table 45: Oceania Magnetic Optical Current Transformer Revenue (million) Forecast, by Application 2020 & 2033
- Table 46: Rest of Asia Pacific Magnetic Optical Current Transformer Revenue (million) Forecast, by Application 2020 & 2033
Frequently Asked Questions
1. What is the projected Compound Annual Growth Rate (CAGR) of the Magnetic Optical Current Transformer?
The projected CAGR is approximately 8.4%.
2. Which companies are prominent players in the Magnetic Optical Current Transformer?
Key companies in the market include ABB, PROFOTECH, TRENCH Group, ARTECHE, NR Electric Co.
3. What are the main segments of the Magnetic Optical Current Transformer?
The market segments include Application, Type.
4. Can you provide details about the market size?
The market size is estimated to be USD 185.2 million as of 2022.
5. What are some drivers contributing to market growth?
N/A
6. What are the notable trends driving market growth?
N/A
7. Are there any restraints impacting market growth?
N/A
8. Can you provide examples of recent developments in the market?
N/A
9. What pricing options are available for accessing the report?
Pricing options include single-user, multi-user, and enterprise licenses priced at USD 2900.00, USD 4350.00, and USD 5800.00 respectively.
10. Is the market size provided in terms of value or volume?
The market size is provided in terms of value, measured in million.
11. Are there any specific market keywords associated with the report?
Yes, the market keyword associated with the report is "Magnetic Optical Current Transformer," which aids in identifying and referencing the specific market segment covered.
12. How do I determine which pricing option suits my needs best?
The pricing options vary based on user requirements and access needs. Individual users may opt for single-user licenses, while businesses requiring broader access may choose multi-user or enterprise licenses for cost-effective access to the report.
13. Are there any additional resources or data provided in the Magnetic Optical Current Transformer report?
While the report offers comprehensive insights, it's advisable to review the specific contents or supplementary materials provided to ascertain if additional resources or data are available.
14. How can I stay updated on further developments or reports in the Magnetic Optical Current Transformer?
To stay informed about further developments, trends, and reports in the Magnetic Optical Current Transformer, consider subscribing to industry newsletters, following relevant companies and organizations, or regularly checking reputable industry news sources and publications.
Methodology
Step 1 - Identification of Relevant Samples Size from Population Database


Step 2 - Approaches for Defining Global Market Size (Value, Volume* & Price*)

Note*: In applicable scenarios
Step 3 - Data Sources
Primary Research
- Web Analytics
- Survey Reports
- Research Institute
- Latest Research Reports
- Opinion Leaders
Secondary Research
- Annual Reports
- White Paper
- Latest Press Release
- Industry Association
- Paid Database
- Investor Presentations

Step 4 - Data Triangulation
Involves using different sources of information in order to increase the validity of a study
These sources are likely to be stakeholders in a program - participants, other researchers, program staff, other community members, and so on.
Then we put all data in single framework & apply various statistical tools to find out the dynamic on the market.
During the analysis stage, feedback from the stakeholder groups would be compared to determine areas of agreement as well as areas of divergence