

Key Insights
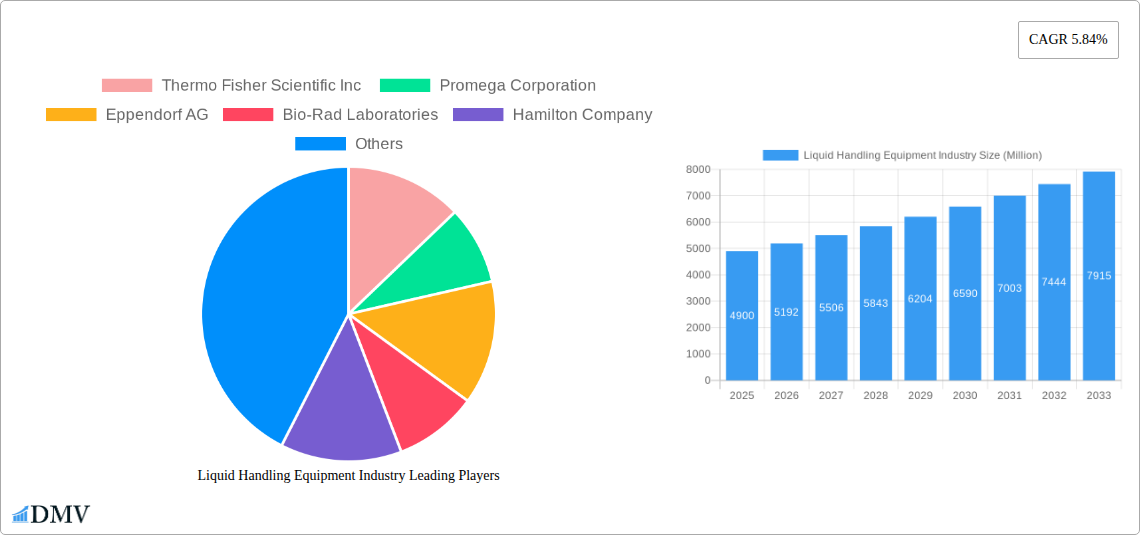
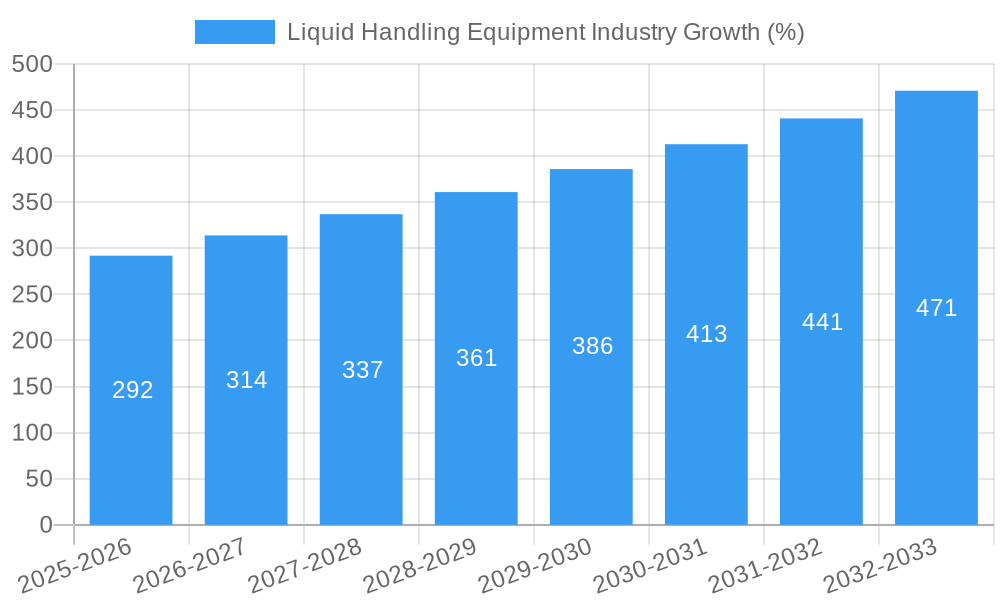
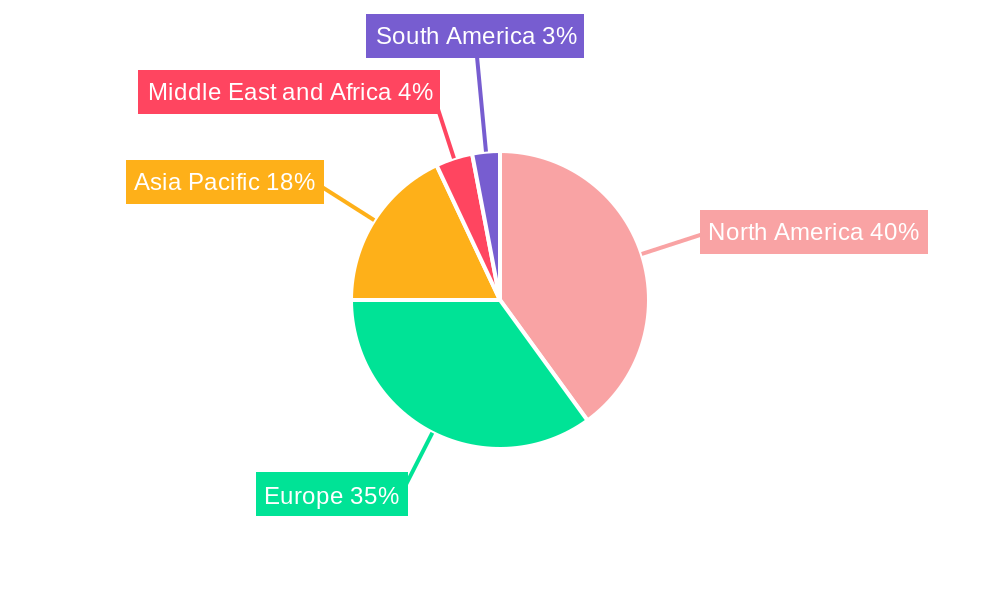
The global liquid handling equipment market, valued at $4.90 billion in 2025, is projected to experience robust growth, driven by the expanding pharmaceutical and biotechnology industries, increasing research activities in genomics and cancer research, and a rising demand for automation in laboratories. The market's Compound Annual Growth Rate (CAGR) of 5.84% from 2025 to 2033 indicates substantial growth potential. Key drivers include the increasing need for high-throughput screening in drug discovery, the growing adoption of automated liquid handling systems for improved efficiency and accuracy, and the rising prevalence of chronic diseases fueling demand for advanced diagnostic tools. The market is segmented by end-user (pharmaceutical and biotechnology companies leading the way), type of equipment (automated liquid handling systems gaining significant traction), product (pipettes and automated workstations holding substantial market share), and application (drug discovery and cancer research being prominent). Growth is anticipated across all segments, with automated liquid handling systems witnessing particularly strong growth due to their ability to enhance throughput and reduce human error. Geographic distribution reveals North America and Europe as currently dominant regions, but the Asia-Pacific market is expected to show significant growth, driven by expanding research infrastructure and economic development in countries like China and India.
While the pharmaceutical and biotechnology industry forms a core segment, the contract research organization (CRO) sector is also experiencing accelerated growth, contributing significantly to the market expansion. This is largely due to the outsourcing of research activities by pharmaceutical companies and a consequent rise in CRO demand for efficient and accurate liquid handling solutions. Furthermore, the increasing adoption of advanced liquid handling techniques in academic institutions and clinical diagnostics further fuels market growth. However, factors like the high initial investment cost for automated systems and the need for skilled personnel for operation and maintenance could present some restraint on market growth in certain segments. Nevertheless, the overall market outlook remains positive, reflecting the continuing need for efficient and precise liquid handling solutions across various scientific and medical disciplines.
Liquid Handling Equipment Industry: A Comprehensive Market Report (2019-2033)
This insightful report provides a comprehensive analysis of the global Liquid Handling Equipment market, projecting a robust growth trajectory over the forecast period (2025-2033). The study meticulously examines market dynamics, encompassing historical data (2019-2024), a base year (2025), and detailed forecasts. We delve deep into various segments, including key players like Thermo Fisher Scientific Inc, Promega Corporation, Eppendorf AG, Bio-Rad Laboratories, Hamilton Company, PerkinElmer Inc, Labcyte Inc, Agilent Technologies, and Corning Incorporated, to offer a complete understanding of this vital sector. The report's value is further enhanced by incorporating detailed financial projections reaching into the billions.
Liquid Handling Equipment Industry Market Composition & Trends
This section provides a granular analysis of the Liquid Handling Equipment market's current state. We evaluate market concentration, revealing a moderately consolidated landscape with the top five players holding an estimated xx% market share in 2025. Innovation is a key driver, fueled by the rising demand for automation and high-throughput solutions in drug discovery and diagnostics. The regulatory landscape, particularly regarding GMP compliance and safety standards, significantly influences market dynamics. Substitute products, while limited, pose a minor competitive threat. End-user profiles highlight a strong reliance on pharmaceutical and biotechnology companies, contract research organizations (CROs), and academic institutions, each with specific technological needs and budgetary constraints. M&A activity in the sector has been significant, with approximately $xx Billion in deals recorded between 2019 and 2024, mainly focused on consolidating technological expertise and expanding market reach.
- Market Share Distribution (2025): Top 5 players: xx%
- M&A Deal Value (2019-2024): ~$xx Billion
- Key Innovation Catalysts: Automation, miniaturization, high-throughput screening.
- Major Regulatory Influences: GMP, ISO 13485.
Liquid Handling Equipment Industry Evolution
The Liquid Handling Equipment market exhibits a consistently upward growth trajectory, projected to reach ~$xx Billion by 2033, registering a CAGR of xx% during the forecast period. Technological advancements, such as the integration of AI and machine learning in automated systems, have significantly enhanced efficiency and accuracy. The demand for sophisticated liquid handling solutions is escalating, driven by the burgeoning pharmaceutical and biotechnology industries, the growing prevalence of personalized medicine, and the increased focus on high-throughput screening for drug discovery. This has resulted in a shift towards automated and semi-automated systems, impacting the adoption rates of manual liquid handling equipment. The adoption of automated liquid handling systems is expected to increase by xx% by 2033, driven by increased demand for speed and precision in high throughput environments. Consumer demands increasingly favor user-friendly interfaces, integrated data management, and reduced operational costs.
Leading Regions, Countries, or Segments in Liquid Handling Equipment Industry
North America currently dominates the Liquid Handling Equipment market, driven by a large pharmaceutical and biotechnology sector, significant R&D investments, and robust regulatory frameworks supporting technological advancements. Europe and Asia Pacific are also experiencing substantial growth, fueled by increasing healthcare spending and a burgeoning CRO industry.
Key Drivers:
- North America: High R&D spending, strong presence of major players, robust regulatory support.
- Europe: Growing pharmaceutical industry, favorable government policies promoting innovation.
- Asia Pacific: Rapid economic growth, increasing healthcare investments, rising demand from emerging markets.
Segment Dominance:
- End User: Pharmaceutical and Biotechnology Industry holds the largest market share, followed by CROs.
- Type: Automated Liquid Handling is the fastest-growing segment, driven by efficiency and accuracy.
- Product: Automated workstations are witnessing the highest demand, due to their versatility and high throughput capabilities.
- Application: Drug discovery and cancer research are major application areas.
Liquid Handling Equipment Industry Product Innovations
Recent product innovations include the development of more precise and versatile pipettes incorporating advanced microfluidics, automated workstations with improved error detection and sample tracking, and miniaturized systems enabling high-throughput screening with reduced reagent consumption. These improvements significantly reduce assay times, enhance accuracy and precision, and improve overall efficiency within laboratories. Companies are focusing on developing user-friendly software interfaces and integrating cloud-based data management capabilities.
Propelling Factors for Liquid Handling Equipment Industry Growth
Several factors are driving the growth of the liquid handling equipment market. Increased investments in life sciences R&D, coupled with government funding for research projects, are significantly contributing to market expansion. The rising prevalence of chronic diseases is boosting demand for advanced diagnostics, thereby increasing the need for high-throughput liquid handling solutions. Stringent regulatory frameworks promoting quality control and data integrity further propel adoption of automated systems.
Obstacles in the Liquid Handling Equipment Industry Market
The market faces challenges including high initial investment costs associated with advanced automated systems, potential supply chain disruptions affecting component availability, and intense competition among established players. Regulatory compliance demands can also represent significant hurdles for manufacturers and end-users alike. These challenges translate to varying levels of market penetration, especially in emerging markets.
Future Opportunities in Liquid Handling Equipment Industry
The future holds immense opportunities for growth, notably in personalized medicine, point-of-care diagnostics, and the development of integrated lab automation systems. Emerging markets in Asia and Africa present vast untapped potential. Furthermore, the integration of advanced technologies, including AI and IoT, will continue to shape market innovation and demand.
Major Players in the Liquid Handling Equipment Industry Ecosystem
- Thermo Fisher Scientific Inc
- Promega Corporation
- Eppendorf AG
- Bio-Rad Laboratories
- Hamilton Company
- PerkinElmer Inc
- Labcyte Inc
- Agilent Technologies
- Corning Incorporated
Key Developments in Liquid Handling Equipment Industry Industry
- 2023-03: Launch of a new automated liquid handling system by Thermo Fisher Scientific Inc, featuring enhanced precision and speed.
- 2022-11: Acquisition of a smaller liquid handling company by Bio-Rad Laboratories, expanding its product portfolio.
- 2021-09: Introduction of a novel microfluidic pipette by Eppendorf AG, improving sample handling efficiency.
- (Add further entries as needed)
Strategic Liquid Handling Equipment Industry Market Forecast
The global Liquid Handling Equipment market is poised for substantial growth, propelled by technological advancements, increasing demand from various end-user segments, and substantial investments in R&D. The market's future outlook remains positive, with continued expansion in both developed and emerging economies. Strategic partnerships and technological innovation will be crucial in maintaining market leadership and capturing emerging opportunities.
Liquid Handling Equipment Industry Segmentation
-
1. Type
- 1.1. Manual Liquid Handling
- 1.2. Automated Liquid Handling
- 1.3. Semi-Automated Liquid Handling
-
2. Product
- 2.1. Automated Workstations
- 2.2. Pipettes
- 2.3. Dispensers
- 2.4. Burettes
- 2.5. Others
-
3. Application
- 3.1. Drug Discovery
- 3.2. Cancer and Genomics Research
- 3.3. Clinical Diagnostics
- 3.4. Other Applications
-
4. End User
- 4.1. Pharmaceutical and Biotechnology Industry
- 4.2. Contract Research Organization
- 4.3. Academic Institutes
- 4.4. Others
Liquid Handling Equipment Industry Segmentation By Geography
-
1. North America
- 1.1. United States
- 1.2. Canada
- 1.3. Mexico
-
2. Europe
- 2.1. Germany
- 2.2. United Kingdom
- 2.3. France
- 2.4. Italy
- 2.5. Spain
- 2.6. Rest of Europe
-
3. Asia Pacific
- 3.1. China
- 3.2. Japan
- 3.3. India
- 3.4. Australia
- 3.5. South Korea
- 3.6. Rest of Asia Pacific
-
4. Middle East and Africa
- 4.1. GCC
- 4.2. South Africa
- 4.3. Rest of Middle East and Africa
-
5. South America
- 5.1. Brazil
- 5.2. Argentina
- 5.3. Rest of South America
Liquid Handling Equipment Industry REPORT HIGHLIGHTS
| Aspects | Details |
|---|---|
| Study Period | 2019-2033 |
| Base Year | 2024 |
| Estimated Year | 2025 |
| Forecast Period | 2025-2033 |
| Historical Period | 2019-2024 |
| Growth Rate | CAGR of 5.84% from 2019-2033 |
| Segmentation |
|
Table of Contents
- 1. Introduction
- 1.1. Research Scope
- 1.2. Market Segmentation
- 1.3. Research Methodology
- 1.4. Definitions and Assumptions
- 2. Executive Summary
- 2.1. Introduction
- 3. Market Dynamics
- 3.1. Introduction
- 3.2. Market Drivers
- 3.2.1. ; Rising Investment in Drug Development and Research; Increasing Demand for High-Throughput Screening; Technological Advancements in Automated Liquid Handling Systems
- 3.3. Market Restrains
- 3.3.1. ; Lack of Skilled Labor in Developing Countries; High Cost and Complexity
- 3.4. Market Trends
- 3.4.1. Contract Research Organisation in the End User Segment are Expected to Witness Healthy Growth in Future
- 4. Market Factor Analysis
- 4.1. Porters Five Forces
- 4.2. Supply/Value Chain
- 4.3. PESTEL analysis
- 4.4. Market Entropy
- 4.5. Patent/Trademark Analysis
- 5. Global Liquid Handling Equipment Industry Analysis, Insights and Forecast, 2019-2031
- 5.1. Market Analysis, Insights and Forecast - by Type
- 5.1.1. Manual Liquid Handling
- 5.1.2. Automated Liquid Handling
- 5.1.3. Semi-Automated Liquid Handling
- 5.2. Market Analysis, Insights and Forecast - by Product
- 5.2.1. Automated Workstations
- 5.2.2. Pipettes
- 5.2.3. Dispensers
- 5.2.4. Burettes
- 5.2.5. Others
- 5.3. Market Analysis, Insights and Forecast - by Application
- 5.3.1. Drug Discovery
- 5.3.2. Cancer and Genomics Research
- 5.3.3. Clinical Diagnostics
- 5.3.4. Other Applications
- 5.4. Market Analysis, Insights and Forecast - by End User
- 5.4.1. Pharmaceutical and Biotechnology Industry
- 5.4.2. Contract Research Organization
- 5.4.3. Academic Institutes
- 5.4.4. Others
- 5.5. Market Analysis, Insights and Forecast - by Region
- 5.5.1. North America
- 5.5.2. Europe
- 5.5.3. Asia Pacific
- 5.5.4. Middle East and Africa
- 5.5.5. South America
- 5.1. Market Analysis, Insights and Forecast - by Type
- 6. North America Liquid Handling Equipment Industry Analysis, Insights and Forecast, 2019-2031
- 6.1. Market Analysis, Insights and Forecast - by Type
- 6.1.1. Manual Liquid Handling
- 6.1.2. Automated Liquid Handling
- 6.1.3. Semi-Automated Liquid Handling
- 6.2. Market Analysis, Insights and Forecast - by Product
- 6.2.1. Automated Workstations
- 6.2.2. Pipettes
- 6.2.3. Dispensers
- 6.2.4. Burettes
- 6.2.5. Others
- 6.3. Market Analysis, Insights and Forecast - by Application
- 6.3.1. Drug Discovery
- 6.3.2. Cancer and Genomics Research
- 6.3.3. Clinical Diagnostics
- 6.3.4. Other Applications
- 6.4. Market Analysis, Insights and Forecast - by End User
- 6.4.1. Pharmaceutical and Biotechnology Industry
- 6.4.2. Contract Research Organization
- 6.4.3. Academic Institutes
- 6.4.4. Others
- 6.1. Market Analysis, Insights and Forecast - by Type
- 7. Europe Liquid Handling Equipment Industry Analysis, Insights and Forecast, 2019-2031
- 7.1. Market Analysis, Insights and Forecast - by Type
- 7.1.1. Manual Liquid Handling
- 7.1.2. Automated Liquid Handling
- 7.1.3. Semi-Automated Liquid Handling
- 7.2. Market Analysis, Insights and Forecast - by Product
- 7.2.1. Automated Workstations
- 7.2.2. Pipettes
- 7.2.3. Dispensers
- 7.2.4. Burettes
- 7.2.5. Others
- 7.3. Market Analysis, Insights and Forecast - by Application
- 7.3.1. Drug Discovery
- 7.3.2. Cancer and Genomics Research
- 7.3.3. Clinical Diagnostics
- 7.3.4. Other Applications
- 7.4. Market Analysis, Insights and Forecast - by End User
- 7.4.1. Pharmaceutical and Biotechnology Industry
- 7.4.2. Contract Research Organization
- 7.4.3. Academic Institutes
- 7.4.4. Others
- 7.1. Market Analysis, Insights and Forecast - by Type
- 8. Asia Pacific Liquid Handling Equipment Industry Analysis, Insights and Forecast, 2019-2031
- 8.1. Market Analysis, Insights and Forecast - by Type
- 8.1.1. Manual Liquid Handling
- 8.1.2. Automated Liquid Handling
- 8.1.3. Semi-Automated Liquid Handling
- 8.2. Market Analysis, Insights and Forecast - by Product
- 8.2.1. Automated Workstations
- 8.2.2. Pipettes
- 8.2.3. Dispensers
- 8.2.4. Burettes
- 8.2.5. Others
- 8.3. Market Analysis, Insights and Forecast - by Application
- 8.3.1. Drug Discovery
- 8.3.2. Cancer and Genomics Research
- 8.3.3. Clinical Diagnostics
- 8.3.4. Other Applications
- 8.4. Market Analysis, Insights and Forecast - by End User
- 8.4.1. Pharmaceutical and Biotechnology Industry
- 8.4.2. Contract Research Organization
- 8.4.3. Academic Institutes
- 8.4.4. Others
- 8.1. Market Analysis, Insights and Forecast - by Type
- 9. Middle East and Africa Liquid Handling Equipment Industry Analysis, Insights and Forecast, 2019-2031
- 9.1. Market Analysis, Insights and Forecast - by Type
- 9.1.1. Manual Liquid Handling
- 9.1.2. Automated Liquid Handling
- 9.1.3. Semi-Automated Liquid Handling
- 9.2. Market Analysis, Insights and Forecast - by Product
- 9.2.1. Automated Workstations
- 9.2.2. Pipettes
- 9.2.3. Dispensers
- 9.2.4. Burettes
- 9.2.5. Others
- 9.3. Market Analysis, Insights and Forecast - by Application
- 9.3.1. Drug Discovery
- 9.3.2. Cancer and Genomics Research
- 9.3.3. Clinical Diagnostics
- 9.3.4. Other Applications
- 9.4. Market Analysis, Insights and Forecast - by End User
- 9.4.1. Pharmaceutical and Biotechnology Industry
- 9.4.2. Contract Research Organization
- 9.4.3. Academic Institutes
- 9.4.4. Others
- 9.1. Market Analysis, Insights and Forecast - by Type
- 10. South America Liquid Handling Equipment Industry Analysis, Insights and Forecast, 2019-2031
- 10.1. Market Analysis, Insights and Forecast - by Type
- 10.1.1. Manual Liquid Handling
- 10.1.2. Automated Liquid Handling
- 10.1.3. Semi-Automated Liquid Handling
- 10.2. Market Analysis, Insights and Forecast - by Product
- 10.2.1. Automated Workstations
- 10.2.2. Pipettes
- 10.2.3. Dispensers
- 10.2.4. Burettes
- 10.2.5. Others
- 10.3. Market Analysis, Insights and Forecast - by Application
- 10.3.1. Drug Discovery
- 10.3.2. Cancer and Genomics Research
- 10.3.3. Clinical Diagnostics
- 10.3.4. Other Applications
- 10.4. Market Analysis, Insights and Forecast - by End User
- 10.4.1. Pharmaceutical and Biotechnology Industry
- 10.4.2. Contract Research Organization
- 10.4.3. Academic Institutes
- 10.4.4. Others
- 10.1. Market Analysis, Insights and Forecast - by Type
- 11. North America Liquid Handling Equipment Industry Analysis, Insights and Forecast, 2019-2031
- 11.1. Market Analysis, Insights and Forecast - By Country/Sub-region
- 11.1.1 United States
- 11.1.2 Canada
- 11.1.3 Mexico
- 12. Europe Liquid Handling Equipment Industry Analysis, Insights and Forecast, 2019-2031
- 12.1. Market Analysis, Insights and Forecast - By Country/Sub-region
- 12.1.1 Germany
- 12.1.2 United Kingdom
- 12.1.3 France
- 12.1.4 Italy
- 12.1.5 Spain
- 12.1.6 Rest of Europe
- 13. Asia Pacific Liquid Handling Equipment Industry Analysis, Insights and Forecast, 2019-2031
- 13.1. Market Analysis, Insights and Forecast - By Country/Sub-region
- 13.1.1 China
- 13.1.2 Japan
- 13.1.3 India
- 13.1.4 Australia
- 13.1.5 South Korea
- 13.1.6 Rest of Asia Pacific
- 14. Middle East and Africa Liquid Handling Equipment Industry Analysis, Insights and Forecast, 2019-2031
- 14.1. Market Analysis, Insights and Forecast - By Country/Sub-region
- 14.1.1 GCC
- 14.1.2 South Africa
- 14.1.3 Rest of Middle East and Africa
- 15. South America Liquid Handling Equipment Industry Analysis, Insights and Forecast, 2019-2031
- 15.1. Market Analysis, Insights and Forecast - By Country/Sub-region
- 15.1.1 Brazil
- 15.1.2 Argentina
- 15.1.3 Rest of South America
- 16. Competitive Analysis
- 16.1. Global Market Share Analysis 2024
- 16.2. Company Profiles
- 16.2.1 Thermo Fisher Scientific Inc
- 16.2.1.1. Overview
- 16.2.1.2. Products
- 16.2.1.3. SWOT Analysis
- 16.2.1.4. Recent Developments
- 16.2.1.5. Financials (Based on Availability)
- 16.2.2 Promega Corporation
- 16.2.2.1. Overview
- 16.2.2.2. Products
- 16.2.2.3. SWOT Analysis
- 16.2.2.4. Recent Developments
- 16.2.2.5. Financials (Based on Availability)
- 16.2.3 Eppendorf AG
- 16.2.3.1. Overview
- 16.2.3.2. Products
- 16.2.3.3. SWOT Analysis
- 16.2.3.4. Recent Developments
- 16.2.3.5. Financials (Based on Availability)
- 16.2.4 Bio-Rad Laboratories
- 16.2.4.1. Overview
- 16.2.4.2. Products
- 16.2.4.3. SWOT Analysis
- 16.2.4.4. Recent Developments
- 16.2.4.5. Financials (Based on Availability)
- 16.2.5 Hamilton Company
- 16.2.5.1. Overview
- 16.2.5.2. Products
- 16.2.5.3. SWOT Analysis
- 16.2.5.4. Recent Developments
- 16.2.5.5. Financials (Based on Availability)
- 16.2.6 PerkinElmer Inc
- 16.2.6.1. Overview
- 16.2.6.2. Products
- 16.2.6.3. SWOT Analysis
- 16.2.6.4. Recent Developments
- 16.2.6.5. Financials (Based on Availability)
- 16.2.7 Labcyte Inc
- 16.2.7.1. Overview
- 16.2.7.2. Products
- 16.2.7.3. SWOT Analysis
- 16.2.7.4. Recent Developments
- 16.2.7.5. Financials (Based on Availability)
- 16.2.8 Agilent Technologies
- 16.2.8.1. Overview
- 16.2.8.2. Products
- 16.2.8.3. SWOT Analysis
- 16.2.8.4. Recent Developments
- 16.2.8.5. Financials (Based on Availability)
- 16.2.9 Corning Incorporated
- 16.2.9.1. Overview
- 16.2.9.2. Products
- 16.2.9.3. SWOT Analysis
- 16.2.9.4. Recent Developments
- 16.2.9.5. Financials (Based on Availability)
- 16.2.1 Thermo Fisher Scientific Inc
List of Figures
- Figure 1: Global Liquid Handling Equipment Industry Revenue Breakdown (Million, %) by Region 2024 & 2032
- Figure 2: Global Liquid Handling Equipment Industry Volume Breakdown (K Unit, %) by Region 2024 & 2032
- Figure 3: North America Liquid Handling Equipment Industry Revenue (Million), by Country 2024 & 2032
- Figure 4: North America Liquid Handling Equipment Industry Volume (K Unit), by Country 2024 & 2032
- Figure 5: North America Liquid Handling Equipment Industry Revenue Share (%), by Country 2024 & 2032
- Figure 6: North America Liquid Handling Equipment Industry Volume Share (%), by Country 2024 & 2032
- Figure 7: Europe Liquid Handling Equipment Industry Revenue (Million), by Country 2024 & 2032
- Figure 8: Europe Liquid Handling Equipment Industry Volume (K Unit), by Country 2024 & 2032
- Figure 9: Europe Liquid Handling Equipment Industry Revenue Share (%), by Country 2024 & 2032
- Figure 10: Europe Liquid Handling Equipment Industry Volume Share (%), by Country 2024 & 2032
- Figure 11: Asia Pacific Liquid Handling Equipment Industry Revenue (Million), by Country 2024 & 2032
- Figure 12: Asia Pacific Liquid Handling Equipment Industry Volume (K Unit), by Country 2024 & 2032
- Figure 13: Asia Pacific Liquid Handling Equipment Industry Revenue Share (%), by Country 2024 & 2032
- Figure 14: Asia Pacific Liquid Handling Equipment Industry Volume Share (%), by Country 2024 & 2032
- Figure 15: Middle East and Africa Liquid Handling Equipment Industry Revenue (Million), by Country 2024 & 2032
- Figure 16: Middle East and Africa Liquid Handling Equipment Industry Volume (K Unit), by Country 2024 & 2032
- Figure 17: Middle East and Africa Liquid Handling Equipment Industry Revenue Share (%), by Country 2024 & 2032
- Figure 18: Middle East and Africa Liquid Handling Equipment Industry Volume Share (%), by Country 2024 & 2032
- Figure 19: South America Liquid Handling Equipment Industry Revenue (Million), by Country 2024 & 2032
- Figure 20: South America Liquid Handling Equipment Industry Volume (K Unit), by Country 2024 & 2032
- Figure 21: South America Liquid Handling Equipment Industry Revenue Share (%), by Country 2024 & 2032
- Figure 22: South America Liquid Handling Equipment Industry Volume Share (%), by Country 2024 & 2032
- Figure 23: North America Liquid Handling Equipment Industry Revenue (Million), by Type 2024 & 2032
- Figure 24: North America Liquid Handling Equipment Industry Volume (K Unit), by Type 2024 & 2032
- Figure 25: North America Liquid Handling Equipment Industry Revenue Share (%), by Type 2024 & 2032
- Figure 26: North America Liquid Handling Equipment Industry Volume Share (%), by Type 2024 & 2032
- Figure 27: North America Liquid Handling Equipment Industry Revenue (Million), by Product 2024 & 2032
- Figure 28: North America Liquid Handling Equipment Industry Volume (K Unit), by Product 2024 & 2032
- Figure 29: North America Liquid Handling Equipment Industry Revenue Share (%), by Product 2024 & 2032
- Figure 30: North America Liquid Handling Equipment Industry Volume Share (%), by Product 2024 & 2032
- Figure 31: North America Liquid Handling Equipment Industry Revenue (Million), by Application 2024 & 2032
- Figure 32: North America Liquid Handling Equipment Industry Volume (K Unit), by Application 2024 & 2032
- Figure 33: North America Liquid Handling Equipment Industry Revenue Share (%), by Application 2024 & 2032
- Figure 34: North America Liquid Handling Equipment Industry Volume Share (%), by Application 2024 & 2032
- Figure 35: North America Liquid Handling Equipment Industry Revenue (Million), by End User 2024 & 2032
- Figure 36: North America Liquid Handling Equipment Industry Volume (K Unit), by End User 2024 & 2032
- Figure 37: North America Liquid Handling Equipment Industry Revenue Share (%), by End User 2024 & 2032
- Figure 38: North America Liquid Handling Equipment Industry Volume Share (%), by End User 2024 & 2032
- Figure 39: North America Liquid Handling Equipment Industry Revenue (Million), by Country 2024 & 2032
- Figure 40: North America Liquid Handling Equipment Industry Volume (K Unit), by Country 2024 & 2032
- Figure 41: North America Liquid Handling Equipment Industry Revenue Share (%), by Country 2024 & 2032
- Figure 42: North America Liquid Handling Equipment Industry Volume Share (%), by Country 2024 & 2032
- Figure 43: Europe Liquid Handling Equipment Industry Revenue (Million), by Type 2024 & 2032
- Figure 44: Europe Liquid Handling Equipment Industry Volume (K Unit), by Type 2024 & 2032
- Figure 45: Europe Liquid Handling Equipment Industry Revenue Share (%), by Type 2024 & 2032
- Figure 46: Europe Liquid Handling Equipment Industry Volume Share (%), by Type 2024 & 2032
- Figure 47: Europe Liquid Handling Equipment Industry Revenue (Million), by Product 2024 & 2032
- Figure 48: Europe Liquid Handling Equipment Industry Volume (K Unit), by Product 2024 & 2032
- Figure 49: Europe Liquid Handling Equipment Industry Revenue Share (%), by Product 2024 & 2032
- Figure 50: Europe Liquid Handling Equipment Industry Volume Share (%), by Product 2024 & 2032
- Figure 51: Europe Liquid Handling Equipment Industry Revenue (Million), by Application 2024 & 2032
- Figure 52: Europe Liquid Handling Equipment Industry Volume (K Unit), by Application 2024 & 2032
- Figure 53: Europe Liquid Handling Equipment Industry Revenue Share (%), by Application 2024 & 2032
- Figure 54: Europe Liquid Handling Equipment Industry Volume Share (%), by Application 2024 & 2032
- Figure 55: Europe Liquid Handling Equipment Industry Revenue (Million), by End User 2024 & 2032
- Figure 56: Europe Liquid Handling Equipment Industry Volume (K Unit), by End User 2024 & 2032
- Figure 57: Europe Liquid Handling Equipment Industry Revenue Share (%), by End User 2024 & 2032
- Figure 58: Europe Liquid Handling Equipment Industry Volume Share (%), by End User 2024 & 2032
- Figure 59: Europe Liquid Handling Equipment Industry Revenue (Million), by Country 2024 & 2032
- Figure 60: Europe Liquid Handling Equipment Industry Volume (K Unit), by Country 2024 & 2032
- Figure 61: Europe Liquid Handling Equipment Industry Revenue Share (%), by Country 2024 & 2032
- Figure 62: Europe Liquid Handling Equipment Industry Volume Share (%), by Country 2024 & 2032
- Figure 63: Asia Pacific Liquid Handling Equipment Industry Revenue (Million), by Type 2024 & 2032
- Figure 64: Asia Pacific Liquid Handling Equipment Industry Volume (K Unit), by Type 2024 & 2032
- Figure 65: Asia Pacific Liquid Handling Equipment Industry Revenue Share (%), by Type 2024 & 2032
- Figure 66: Asia Pacific Liquid Handling Equipment Industry Volume Share (%), by Type 2024 & 2032
- Figure 67: Asia Pacific Liquid Handling Equipment Industry Revenue (Million), by Product 2024 & 2032
- Figure 68: Asia Pacific Liquid Handling Equipment Industry Volume (K Unit), by Product 2024 & 2032
- Figure 69: Asia Pacific Liquid Handling Equipment Industry Revenue Share (%), by Product 2024 & 2032
- Figure 70: Asia Pacific Liquid Handling Equipment Industry Volume Share (%), by Product 2024 & 2032
- Figure 71: Asia Pacific Liquid Handling Equipment Industry Revenue (Million), by Application 2024 & 2032
- Figure 72: Asia Pacific Liquid Handling Equipment Industry Volume (K Unit), by Application 2024 & 2032
- Figure 73: Asia Pacific Liquid Handling Equipment Industry Revenue Share (%), by Application 2024 & 2032
- Figure 74: Asia Pacific Liquid Handling Equipment Industry Volume Share (%), by Application 2024 & 2032
- Figure 75: Asia Pacific Liquid Handling Equipment Industry Revenue (Million), by End User 2024 & 2032
- Figure 76: Asia Pacific Liquid Handling Equipment Industry Volume (K Unit), by End User 2024 & 2032
- Figure 77: Asia Pacific Liquid Handling Equipment Industry Revenue Share (%), by End User 2024 & 2032
- Figure 78: Asia Pacific Liquid Handling Equipment Industry Volume Share (%), by End User 2024 & 2032
- Figure 79: Asia Pacific Liquid Handling Equipment Industry Revenue (Million), by Country 2024 & 2032
- Figure 80: Asia Pacific Liquid Handling Equipment Industry Volume (K Unit), by Country 2024 & 2032
- Figure 81: Asia Pacific Liquid Handling Equipment Industry Revenue Share (%), by Country 2024 & 2032
- Figure 82: Asia Pacific Liquid Handling Equipment Industry Volume Share (%), by Country 2024 & 2032
- Figure 83: Middle East and Africa Liquid Handling Equipment Industry Revenue (Million), by Type 2024 & 2032
- Figure 84: Middle East and Africa Liquid Handling Equipment Industry Volume (K Unit), by Type 2024 & 2032
- Figure 85: Middle East and Africa Liquid Handling Equipment Industry Revenue Share (%), by Type 2024 & 2032
- Figure 86: Middle East and Africa Liquid Handling Equipment Industry Volume Share (%), by Type 2024 & 2032
- Figure 87: Middle East and Africa Liquid Handling Equipment Industry Revenue (Million), by Product 2024 & 2032
- Figure 88: Middle East and Africa Liquid Handling Equipment Industry Volume (K Unit), by Product 2024 & 2032
- Figure 89: Middle East and Africa Liquid Handling Equipment Industry Revenue Share (%), by Product 2024 & 2032
- Figure 90: Middle East and Africa Liquid Handling Equipment Industry Volume Share (%), by Product 2024 & 2032
- Figure 91: Middle East and Africa Liquid Handling Equipment Industry Revenue (Million), by Application 2024 & 2032
- Figure 92: Middle East and Africa Liquid Handling Equipment Industry Volume (K Unit), by Application 2024 & 2032
- Figure 93: Middle East and Africa Liquid Handling Equipment Industry Revenue Share (%), by Application 2024 & 2032
- Figure 94: Middle East and Africa Liquid Handling Equipment Industry Volume Share (%), by Application 2024 & 2032
- Figure 95: Middle East and Africa Liquid Handling Equipment Industry Revenue (Million), by End User 2024 & 2032
- Figure 96: Middle East and Africa Liquid Handling Equipment Industry Volume (K Unit), by End User 2024 & 2032
- Figure 97: Middle East and Africa Liquid Handling Equipment Industry Revenue Share (%), by End User 2024 & 2032
- Figure 98: Middle East and Africa Liquid Handling Equipment Industry Volume Share (%), by End User 2024 & 2032
- Figure 99: Middle East and Africa Liquid Handling Equipment Industry Revenue (Million), by Country 2024 & 2032
- Figure 100: Middle East and Africa Liquid Handling Equipment Industry Volume (K Unit), by Country 2024 & 2032
- Figure 101: Middle East and Africa Liquid Handling Equipment Industry Revenue Share (%), by Country 2024 & 2032
- Figure 102: Middle East and Africa Liquid Handling Equipment Industry Volume Share (%), by Country 2024 & 2032
- Figure 103: South America Liquid Handling Equipment Industry Revenue (Million), by Type 2024 & 2032
- Figure 104: South America Liquid Handling Equipment Industry Volume (K Unit), by Type 2024 & 2032
- Figure 105: South America Liquid Handling Equipment Industry Revenue Share (%), by Type 2024 & 2032
- Figure 106: South America Liquid Handling Equipment Industry Volume Share (%), by Type 2024 & 2032
- Figure 107: South America Liquid Handling Equipment Industry Revenue (Million), by Product 2024 & 2032
- Figure 108: South America Liquid Handling Equipment Industry Volume (K Unit), by Product 2024 & 2032
- Figure 109: South America Liquid Handling Equipment Industry Revenue Share (%), by Product 2024 & 2032
- Figure 110: South America Liquid Handling Equipment Industry Volume Share (%), by Product 2024 & 2032
- Figure 111: South America Liquid Handling Equipment Industry Revenue (Million), by Application 2024 & 2032
- Figure 112: South America Liquid Handling Equipment Industry Volume (K Unit), by Application 2024 & 2032
- Figure 113: South America Liquid Handling Equipment Industry Revenue Share (%), by Application 2024 & 2032
- Figure 114: South America Liquid Handling Equipment Industry Volume Share (%), by Application 2024 & 2032
- Figure 115: South America Liquid Handling Equipment Industry Revenue (Million), by End User 2024 & 2032
- Figure 116: South America Liquid Handling Equipment Industry Volume (K Unit), by End User 2024 & 2032
- Figure 117: South America Liquid Handling Equipment Industry Revenue Share (%), by End User 2024 & 2032
- Figure 118: South America Liquid Handling Equipment Industry Volume Share (%), by End User 2024 & 2032
- Figure 119: South America Liquid Handling Equipment Industry Revenue (Million), by Country 2024 & 2032
- Figure 120: South America Liquid Handling Equipment Industry Volume (K Unit), by Country 2024 & 2032
- Figure 121: South America Liquid Handling Equipment Industry Revenue Share (%), by Country 2024 & 2032
- Figure 122: South America Liquid Handling Equipment Industry Volume Share (%), by Country 2024 & 2032
List of Tables
- Table 1: Global Liquid Handling Equipment Industry Revenue Million Forecast, by Region 2019 & 2032
- Table 2: Global Liquid Handling Equipment Industry Volume K Unit Forecast, by Region 2019 & 2032
- Table 3: Global Liquid Handling Equipment Industry Revenue Million Forecast, by Type 2019 & 2032
- Table 4: Global Liquid Handling Equipment Industry Volume K Unit Forecast, by Type 2019 & 2032
- Table 5: Global Liquid Handling Equipment Industry Revenue Million Forecast, by Product 2019 & 2032
- Table 6: Global Liquid Handling Equipment Industry Volume K Unit Forecast, by Product 2019 & 2032
- Table 7: Global Liquid Handling Equipment Industry Revenue Million Forecast, by Application 2019 & 2032
- Table 8: Global Liquid Handling Equipment Industry Volume K Unit Forecast, by Application 2019 & 2032
- Table 9: Global Liquid Handling Equipment Industry Revenue Million Forecast, by End User 2019 & 2032
- Table 10: Global Liquid Handling Equipment Industry Volume K Unit Forecast, by End User 2019 & 2032
- Table 11: Global Liquid Handling Equipment Industry Revenue Million Forecast, by Region 2019 & 2032
- Table 12: Global Liquid Handling Equipment Industry Volume K Unit Forecast, by Region 2019 & 2032
- Table 13: Global Liquid Handling Equipment Industry Revenue Million Forecast, by Country 2019 & 2032
- Table 14: Global Liquid Handling Equipment Industry Volume K Unit Forecast, by Country 2019 & 2032
- Table 15: United States Liquid Handling Equipment Industry Revenue (Million) Forecast, by Application 2019 & 2032
- Table 16: United States Liquid Handling Equipment Industry Volume (K Unit) Forecast, by Application 2019 & 2032
- Table 17: Canada Liquid Handling Equipment Industry Revenue (Million) Forecast, by Application 2019 & 2032
- Table 18: Canada Liquid Handling Equipment Industry Volume (K Unit) Forecast, by Application 2019 & 2032
- Table 19: Mexico Liquid Handling Equipment Industry Revenue (Million) Forecast, by Application 2019 & 2032
- Table 20: Mexico Liquid Handling Equipment Industry Volume (K Unit) Forecast, by Application 2019 & 2032
- Table 21: Global Liquid Handling Equipment Industry Revenue Million Forecast, by Country 2019 & 2032
- Table 22: Global Liquid Handling Equipment Industry Volume K Unit Forecast, by Country 2019 & 2032
- Table 23: Germany Liquid Handling Equipment Industry Revenue (Million) Forecast, by Application 2019 & 2032
- Table 24: Germany Liquid Handling Equipment Industry Volume (K Unit) Forecast, by Application 2019 & 2032
- Table 25: United Kingdom Liquid Handling Equipment Industry Revenue (Million) Forecast, by Application 2019 & 2032
- Table 26: United Kingdom Liquid Handling Equipment Industry Volume (K Unit) Forecast, by Application 2019 & 2032
- Table 27: France Liquid Handling Equipment Industry Revenue (Million) Forecast, by Application 2019 & 2032
- Table 28: France Liquid Handling Equipment Industry Volume (K Unit) Forecast, by Application 2019 & 2032
- Table 29: Italy Liquid Handling Equipment Industry Revenue (Million) Forecast, by Application 2019 & 2032
- Table 30: Italy Liquid Handling Equipment Industry Volume (K Unit) Forecast, by Application 2019 & 2032
- Table 31: Spain Liquid Handling Equipment Industry Revenue (Million) Forecast, by Application 2019 & 2032
- Table 32: Spain Liquid Handling Equipment Industry Volume (K Unit) Forecast, by Application 2019 & 2032
- Table 33: Rest of Europe Liquid Handling Equipment Industry Revenue (Million) Forecast, by Application 2019 & 2032
- Table 34: Rest of Europe Liquid Handling Equipment Industry Volume (K Unit) Forecast, by Application 2019 & 2032
- Table 35: Global Liquid Handling Equipment Industry Revenue Million Forecast, by Country 2019 & 2032
- Table 36: Global Liquid Handling Equipment Industry Volume K Unit Forecast, by Country 2019 & 2032
- Table 37: China Liquid Handling Equipment Industry Revenue (Million) Forecast, by Application 2019 & 2032
- Table 38: China Liquid Handling Equipment Industry Volume (K Unit) Forecast, by Application 2019 & 2032
- Table 39: Japan Liquid Handling Equipment Industry Revenue (Million) Forecast, by Application 2019 & 2032
- Table 40: Japan Liquid Handling Equipment Industry Volume (K Unit) Forecast, by Application 2019 & 2032
- Table 41: India Liquid Handling Equipment Industry Revenue (Million) Forecast, by Application 2019 & 2032
- Table 42: India Liquid Handling Equipment Industry Volume (K Unit) Forecast, by Application 2019 & 2032
- Table 43: Australia Liquid Handling Equipment Industry Revenue (Million) Forecast, by Application 2019 & 2032
- Table 44: Australia Liquid Handling Equipment Industry Volume (K Unit) Forecast, by Application 2019 & 2032
- Table 45: South Korea Liquid Handling Equipment Industry Revenue (Million) Forecast, by Application 2019 & 2032
- Table 46: South Korea Liquid Handling Equipment Industry Volume (K Unit) Forecast, by Application 2019 & 2032
- Table 47: Rest of Asia Pacific Liquid Handling Equipment Industry Revenue (Million) Forecast, by Application 2019 & 2032
- Table 48: Rest of Asia Pacific Liquid Handling Equipment Industry Volume (K Unit) Forecast, by Application 2019 & 2032
- Table 49: Global Liquid Handling Equipment Industry Revenue Million Forecast, by Country 2019 & 2032
- Table 50: Global Liquid Handling Equipment Industry Volume K Unit Forecast, by Country 2019 & 2032
- Table 51: GCC Liquid Handling Equipment Industry Revenue (Million) Forecast, by Application 2019 & 2032
- Table 52: GCC Liquid Handling Equipment Industry Volume (K Unit) Forecast, by Application 2019 & 2032
- Table 53: South Africa Liquid Handling Equipment Industry Revenue (Million) Forecast, by Application 2019 & 2032
- Table 54: South Africa Liquid Handling Equipment Industry Volume (K Unit) Forecast, by Application 2019 & 2032
- Table 55: Rest of Middle East and Africa Liquid Handling Equipment Industry Revenue (Million) Forecast, by Application 2019 & 2032
- Table 56: Rest of Middle East and Africa Liquid Handling Equipment Industry Volume (K Unit) Forecast, by Application 2019 & 2032
- Table 57: Global Liquid Handling Equipment Industry Revenue Million Forecast, by Country 2019 & 2032
- Table 58: Global Liquid Handling Equipment Industry Volume K Unit Forecast, by Country 2019 & 2032
- Table 59: Brazil Liquid Handling Equipment Industry Revenue (Million) Forecast, by Application 2019 & 2032
- Table 60: Brazil Liquid Handling Equipment Industry Volume (K Unit) Forecast, by Application 2019 & 2032
- Table 61: Argentina Liquid Handling Equipment Industry Revenue (Million) Forecast, by Application 2019 & 2032
- Table 62: Argentina Liquid Handling Equipment Industry Volume (K Unit) Forecast, by Application 2019 & 2032
- Table 63: Rest of South America Liquid Handling Equipment Industry Revenue (Million) Forecast, by Application 2019 & 2032
- Table 64: Rest of South America Liquid Handling Equipment Industry Volume (K Unit) Forecast, by Application 2019 & 2032
- Table 65: Global Liquid Handling Equipment Industry Revenue Million Forecast, by Type 2019 & 2032
- Table 66: Global Liquid Handling Equipment Industry Volume K Unit Forecast, by Type 2019 & 2032
- Table 67: Global Liquid Handling Equipment Industry Revenue Million Forecast, by Product 2019 & 2032
- Table 68: Global Liquid Handling Equipment Industry Volume K Unit Forecast, by Product 2019 & 2032
- Table 69: Global Liquid Handling Equipment Industry Revenue Million Forecast, by Application 2019 & 2032
- Table 70: Global Liquid Handling Equipment Industry Volume K Unit Forecast, by Application 2019 & 2032
- Table 71: Global Liquid Handling Equipment Industry Revenue Million Forecast, by End User 2019 & 2032
- Table 72: Global Liquid Handling Equipment Industry Volume K Unit Forecast, by End User 2019 & 2032
- Table 73: Global Liquid Handling Equipment Industry Revenue Million Forecast, by Country 2019 & 2032
- Table 74: Global Liquid Handling Equipment Industry Volume K Unit Forecast, by Country 2019 & 2032
- Table 75: United States Liquid Handling Equipment Industry Revenue (Million) Forecast, by Application 2019 & 2032
- Table 76: United States Liquid Handling Equipment Industry Volume (K Unit) Forecast, by Application 2019 & 2032
- Table 77: Canada Liquid Handling Equipment Industry Revenue (Million) Forecast, by Application 2019 & 2032
- Table 78: Canada Liquid Handling Equipment Industry Volume (K Unit) Forecast, by Application 2019 & 2032
- Table 79: Mexico Liquid Handling Equipment Industry Revenue (Million) Forecast, by Application 2019 & 2032
- Table 80: Mexico Liquid Handling Equipment Industry Volume (K Unit) Forecast, by Application 2019 & 2032
- Table 81: Global Liquid Handling Equipment Industry Revenue Million Forecast, by Type 2019 & 2032
- Table 82: Global Liquid Handling Equipment Industry Volume K Unit Forecast, by Type 2019 & 2032
- Table 83: Global Liquid Handling Equipment Industry Revenue Million Forecast, by Product 2019 & 2032
- Table 84: Global Liquid Handling Equipment Industry Volume K Unit Forecast, by Product 2019 & 2032
- Table 85: Global Liquid Handling Equipment Industry Revenue Million Forecast, by Application 2019 & 2032
- Table 86: Global Liquid Handling Equipment Industry Volume K Unit Forecast, by Application 2019 & 2032
- Table 87: Global Liquid Handling Equipment Industry Revenue Million Forecast, by End User 2019 & 2032
- Table 88: Global Liquid Handling Equipment Industry Volume K Unit Forecast, by End User 2019 & 2032
- Table 89: Global Liquid Handling Equipment Industry Revenue Million Forecast, by Country 2019 & 2032
- Table 90: Global Liquid Handling Equipment Industry Volume K Unit Forecast, by Country 2019 & 2032
- Table 91: Germany Liquid Handling Equipment Industry Revenue (Million) Forecast, by Application 2019 & 2032
- Table 92: Germany Liquid Handling Equipment Industry Volume (K Unit) Forecast, by Application 2019 & 2032
- Table 93: United Kingdom Liquid Handling Equipment Industry Revenue (Million) Forecast, by Application 2019 & 2032
- Table 94: United Kingdom Liquid Handling Equipment Industry Volume (K Unit) Forecast, by Application 2019 & 2032
- Table 95: France Liquid Handling Equipment Industry Revenue (Million) Forecast, by Application 2019 & 2032
- Table 96: France Liquid Handling Equipment Industry Volume (K Unit) Forecast, by Application 2019 & 2032
- Table 97: Italy Liquid Handling Equipment Industry Revenue (Million) Forecast, by Application 2019 & 2032
- Table 98: Italy Liquid Handling Equipment Industry Volume (K Unit) Forecast, by Application 2019 & 2032
- Table 99: Spain Liquid Handling Equipment Industry Revenue (Million) Forecast, by Application 2019 & 2032
- Table 100: Spain Liquid Handling Equipment Industry Volume (K Unit) Forecast, by Application 2019 & 2032
- Table 101: Rest of Europe Liquid Handling Equipment Industry Revenue (Million) Forecast, by Application 2019 & 2032
- Table 102: Rest of Europe Liquid Handling Equipment Industry Volume (K Unit) Forecast, by Application 2019 & 2032
- Table 103: Global Liquid Handling Equipment Industry Revenue Million Forecast, by Type 2019 & 2032
- Table 104: Global Liquid Handling Equipment Industry Volume K Unit Forecast, by Type 2019 & 2032
- Table 105: Global Liquid Handling Equipment Industry Revenue Million Forecast, by Product 2019 & 2032
- Table 106: Global Liquid Handling Equipment Industry Volume K Unit Forecast, by Product 2019 & 2032
- Table 107: Global Liquid Handling Equipment Industry Revenue Million Forecast, by Application 2019 & 2032
- Table 108: Global Liquid Handling Equipment Industry Volume K Unit Forecast, by Application 2019 & 2032
- Table 109: Global Liquid Handling Equipment Industry Revenue Million Forecast, by End User 2019 & 2032
- Table 110: Global Liquid Handling Equipment Industry Volume K Unit Forecast, by End User 2019 & 2032
- Table 111: Global Liquid Handling Equipment Industry Revenue Million Forecast, by Country 2019 & 2032
- Table 112: Global Liquid Handling Equipment Industry Volume K Unit Forecast, by Country 2019 & 2032
- Table 113: China Liquid Handling Equipment Industry Revenue (Million) Forecast, by Application 2019 & 2032
- Table 114: China Liquid Handling Equipment Industry Volume (K Unit) Forecast, by Application 2019 & 2032
- Table 115: Japan Liquid Handling Equipment Industry Revenue (Million) Forecast, by Application 2019 & 2032
- Table 116: Japan Liquid Handling Equipment Industry Volume (K Unit) Forecast, by Application 2019 & 2032
- Table 117: India Liquid Handling Equipment Industry Revenue (Million) Forecast, by Application 2019 & 2032
- Table 118: India Liquid Handling Equipment Industry Volume (K Unit) Forecast, by Application 2019 & 2032
- Table 119: Australia Liquid Handling Equipment Industry Revenue (Million) Forecast, by Application 2019 & 2032
- Table 120: Australia Liquid Handling Equipment Industry Volume (K Unit) Forecast, by Application 2019 & 2032
- Table 121: South Korea Liquid Handling Equipment Industry Revenue (Million) Forecast, by Application 2019 & 2032
- Table 122: South Korea Liquid Handling Equipment Industry Volume (K Unit) Forecast, by Application 2019 & 2032
- Table 123: Rest of Asia Pacific Liquid Handling Equipment Industry Revenue (Million) Forecast, by Application 2019 & 2032
- Table 124: Rest of Asia Pacific Liquid Handling Equipment Industry Volume (K Unit) Forecast, by Application 2019 & 2032
- Table 125: Global Liquid Handling Equipment Industry Revenue Million Forecast, by Type 2019 & 2032
- Table 126: Global Liquid Handling Equipment Industry Volume K Unit Forecast, by Type 2019 & 2032
- Table 127: Global Liquid Handling Equipment Industry Revenue Million Forecast, by Product 2019 & 2032
- Table 128: Global Liquid Handling Equipment Industry Volume K Unit Forecast, by Product 2019 & 2032
- Table 129: Global Liquid Handling Equipment Industry Revenue Million Forecast, by Application 2019 & 2032
- Table 130: Global Liquid Handling Equipment Industry Volume K Unit Forecast, by Application 2019 & 2032
- Table 131: Global Liquid Handling Equipment Industry Revenue Million Forecast, by End User 2019 & 2032
- Table 132: Global Liquid Handling Equipment Industry Volume K Unit Forecast, by End User 2019 & 2032
- Table 133: Global Liquid Handling Equipment Industry Revenue Million Forecast, by Country 2019 & 2032
- Table 134: Global Liquid Handling Equipment Industry Volume K Unit Forecast, by Country 2019 & 2032
- Table 135: GCC Liquid Handling Equipment Industry Revenue (Million) Forecast, by Application 2019 & 2032
- Table 136: GCC Liquid Handling Equipment Industry Volume (K Unit) Forecast, by Application 2019 & 2032
- Table 137: South Africa Liquid Handling Equipment Industry Revenue (Million) Forecast, by Application 2019 & 2032
- Table 138: South Africa Liquid Handling Equipment Industry Volume (K Unit) Forecast, by Application 2019 & 2032
- Table 139: Rest of Middle East and Africa Liquid Handling Equipment Industry Revenue (Million) Forecast, by Application 2019 & 2032
- Table 140: Rest of Middle East and Africa Liquid Handling Equipment Industry Volume (K Unit) Forecast, by Application 2019 & 2032
- Table 141: Global Liquid Handling Equipment Industry Revenue Million Forecast, by Type 2019 & 2032
- Table 142: Global Liquid Handling Equipment Industry Volume K Unit Forecast, by Type 2019 & 2032
- Table 143: Global Liquid Handling Equipment Industry Revenue Million Forecast, by Product 2019 & 2032
- Table 144: Global Liquid Handling Equipment Industry Volume K Unit Forecast, by Product 2019 & 2032
- Table 145: Global Liquid Handling Equipment Industry Revenue Million Forecast, by Application 2019 & 2032
- Table 146: Global Liquid Handling Equipment Industry Volume K Unit Forecast, by Application 2019 & 2032
- Table 147: Global Liquid Handling Equipment Industry Revenue Million Forecast, by End User 2019 & 2032
- Table 148: Global Liquid Handling Equipment Industry Volume K Unit Forecast, by End User 2019 & 2032
- Table 149: Global Liquid Handling Equipment Industry Revenue Million Forecast, by Country 2019 & 2032
- Table 150: Global Liquid Handling Equipment Industry Volume K Unit Forecast, by Country 2019 & 2032
- Table 151: Brazil Liquid Handling Equipment Industry Revenue (Million) Forecast, by Application 2019 & 2032
- Table 152: Brazil Liquid Handling Equipment Industry Volume (K Unit) Forecast, by Application 2019 & 2032
- Table 153: Argentina Liquid Handling Equipment Industry Revenue (Million) Forecast, by Application 2019 & 2032
- Table 154: Argentina Liquid Handling Equipment Industry Volume (K Unit) Forecast, by Application 2019 & 2032
- Table 155: Rest of South America Liquid Handling Equipment Industry Revenue (Million) Forecast, by Application 2019 & 2032
- Table 156: Rest of South America Liquid Handling Equipment Industry Volume (K Unit) Forecast, by Application 2019 & 2032
Frequently Asked Questions
1. What is the projected Compound Annual Growth Rate (CAGR) of the Liquid Handling Equipment Industry?
The projected CAGR is approximately 5.84%.
2. Which companies are prominent players in the Liquid Handling Equipment Industry?
Key companies in the market include Thermo Fisher Scientific Inc , Promega Corporation, Eppendorf AG, Bio-Rad Laboratories, Hamilton Company, PerkinElmer Inc, Labcyte Inc, Agilent Technologies, Corning Incorporated.
3. What are the main segments of the Liquid Handling Equipment Industry?
The market segments include Type, Product, Application, End User.
4. Can you provide details about the market size?
The market size is estimated to be USD 4.90 Million as of 2022.
5. What are some drivers contributing to market growth?
; Rising Investment in Drug Development and Research; Increasing Demand for High-Throughput Screening; Technological Advancements in Automated Liquid Handling Systems.
6. What are the notable trends driving market growth?
Contract Research Organisation in the End User Segment are Expected to Witness Healthy Growth in Future.
7. Are there any restraints impacting market growth?
; Lack of Skilled Labor in Developing Countries; High Cost and Complexity.
8. Can you provide examples of recent developments in the market?
N/A
9. What pricing options are available for accessing the report?
Pricing options include single-user, multi-user, and enterprise licenses priced at USD 4750, USD 5250, and USD 8750 respectively.
10. Is the market size provided in terms of value or volume?
The market size is provided in terms of value, measured in Million and volume, measured in K Unit.
11. Are there any specific market keywords associated with the report?
Yes, the market keyword associated with the report is "Liquid Handling Equipment Industry," which aids in identifying and referencing the specific market segment covered.
12. How do I determine which pricing option suits my needs best?
The pricing options vary based on user requirements and access needs. Individual users may opt for single-user licenses, while businesses requiring broader access may choose multi-user or enterprise licenses for cost-effective access to the report.
13. Are there any additional resources or data provided in the Liquid Handling Equipment Industry report?
While the report offers comprehensive insights, it's advisable to review the specific contents or supplementary materials provided to ascertain if additional resources or data are available.
14. How can I stay updated on further developments or reports in the Liquid Handling Equipment Industry?
To stay informed about further developments, trends, and reports in the Liquid Handling Equipment Industry, consider subscribing to industry newsletters, following relevant companies and organizations, or regularly checking reputable industry news sources and publications.
Methodology
Step 1 - Identification of Relevant Samples Size from Population Database


Step 2 - Approaches for Defining Global Market Size (Value, Volume* & Price*)

Note*: In applicable scenarios
Step 3 - Data Sources
Primary Research
- Web Analytics
- Survey Reports
- Research Institute
- Latest Research Reports
- Opinion Leaders
Secondary Research
- Annual Reports
- White Paper
- Latest Press Release
- Industry Association
- Paid Database
- Investor Presentations

Step 4 - Data Triangulation
Involves using different sources of information in order to increase the validity of a study
These sources are likely to be stakeholders in a program - participants, other researchers, program staff, other community members, and so on.
Then we put all data in single framework & apply various statistical tools to find out the dynamic on the market.
During the analysis stage, feedback from the stakeholder groups would be compared to determine areas of agreement as well as areas of divergence
