

Key Insights
The Oncology Information Systems market is poised for significant expansion, propelled by escalating cancer prevalence, widespread EHR adoption, and the imperative for efficient cancer care management. With a projected Compound Annual Growth Rate (CAGR) of 7.56%, the market size is estimated to reach 963.88 million by 2033 (base year: 2025). Key growth catalysts include the drive for improved patient outcomes via data-driven insights, enhanced cross-disciplinary collaboration, and sophisticated management of complex treatment protocols. The integration of AI and machine learning is enhancing diagnostic precision, treatment planning, and the advancement of personalized medicine. The market is segmented by end-user (hospitals, research centers, specialty clinics), product & service (software, services), and application (medical, radiation, surgical oncology). Hospitals lead as the primary segment due to high patient volumes and robust IT infrastructure. Software solutions dominate the product segment, facilitating data management, analysis, and workflow optimization. While North America currently holds a substantial market share, driven by advanced healthcare infrastructure and technology adoption, the Asia-Pacific region is anticipated to experience considerable growth due to increasing healthcare investments and rising cancer incidence rates. Prominent market players include Accuray, Oracle (Cerner), Siemens Healthineers (Varian), and Elekta, alongside innovative emerging companies.
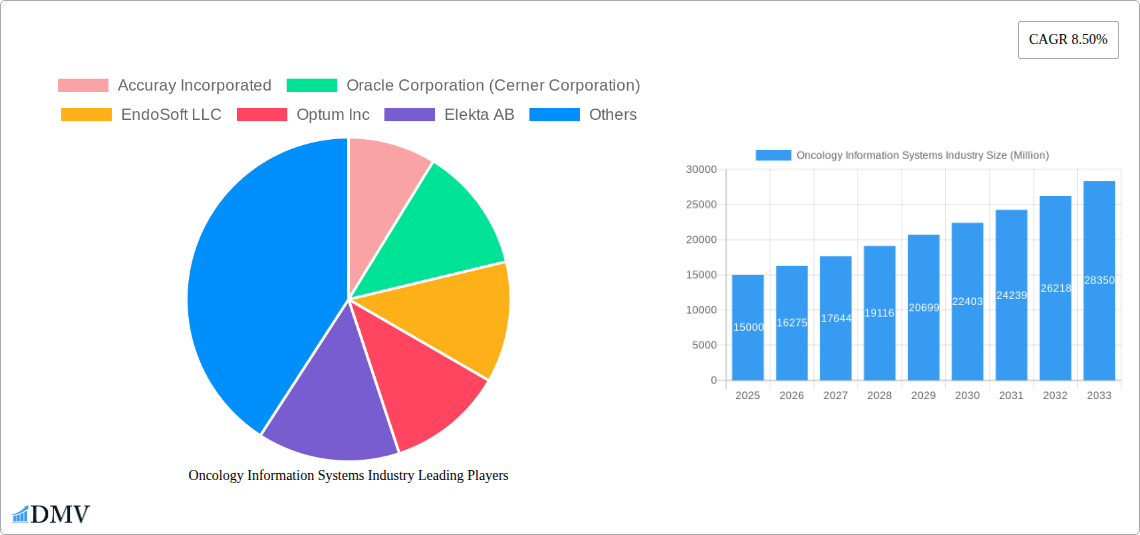
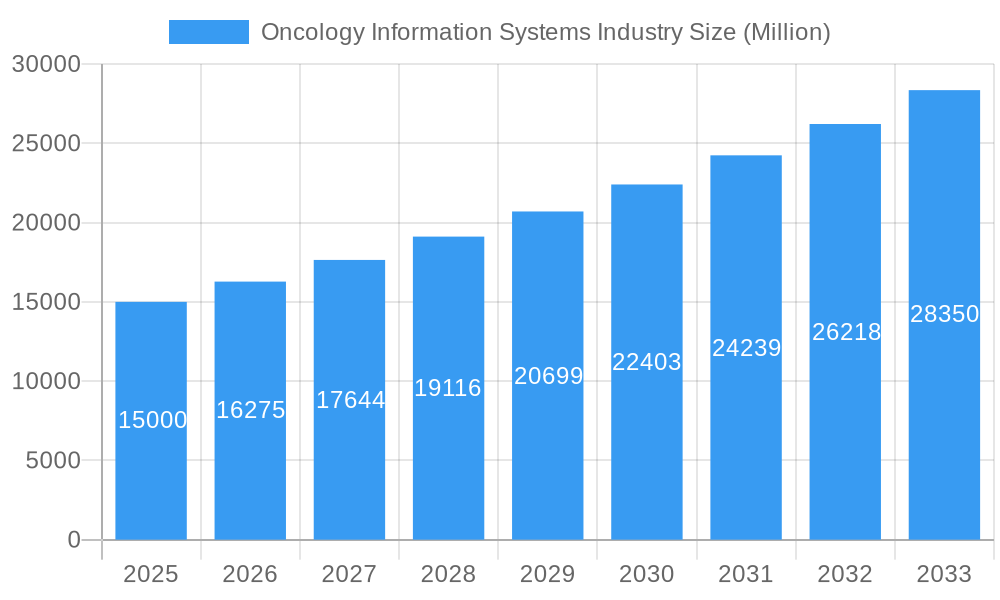
Oncology Information Systems Industry Market Size (In Million)
Market growth is tempered by substantial initial investment requirements for system implementation, data security and privacy concerns, the necessity for robust IT infrastructure and skilled personnel, and interoperability challenges. However, the increasing emphasis on value-based care, supportive government digital health initiatives, and the growing adoption of cloud-based solutions are actively mitigating these constraints. The forecast period (2025-2033) anticipates sustained market growth, with AI-powered solutions and cloud-based systems expected to exhibit accelerated expansion. Regional variations in healthcare infrastructure and regulatory frameworks will continue to influence market dynamics. Future growth will be significantly driven by advancements in data analytics, personalized medicine, and the seamless integration of complementary healthcare technologies within the oncology information systems ecosystem.
Oncology Information Systems Industry Company Market Share
Oncology Information Systems Industry: Market Analysis & Forecast (2019-2033)
This comprehensive report provides an in-depth analysis of the Oncology Information Systems market, encompassing market size, growth drivers, competitive landscape, and future trends. The study period covers 2019-2033, with a base year of 2025 and a forecast period of 2025-2033. This report is crucial for stakeholders seeking to understand the evolving dynamics of this vital sector and make informed strategic decisions. The market is projected to reach xx Million by 2033.
Oncology Information Systems Industry Market Composition & Trends
The Oncology Information Systems market is characterized by a moderately concentrated landscape, with key players such as Accuray Incorporated, Oracle Corporation (Cerner Corporation), and Elekta AB holding significant market share. However, the market also features a number of smaller, specialized players, leading to a dynamic competitive environment. Innovation is driven by advancements in artificial intelligence (AI), big data analytics, and cloud computing, enabling more precise diagnostics and personalized treatment plans. The regulatory landscape is evolving, with increasing emphasis on data security and interoperability. Substitute products are limited, primarily due to the specialized nature of oncology information systems. M&A activity is significant, with deal values exceeding xx Million in recent years. End-users include hospitals, research centers, and specialty clinics, each exhibiting distinct needs and adoption rates.
- Market Share Distribution (2024): Top 3 players hold approximately 40% market share; remaining share distributed across numerous smaller players.
- M&A Activity (2019-2024): Total deal value exceeding xx Million, with a notable increase in strategic acquisitions of smaller technology providers by larger players.
- End-User Profile: Hospitals represent the largest end-user segment, followed by specialty clinics and research centers.
Oncology Information Systems Industry Evolution
The Oncology Information Systems market has experienced robust growth from 2019 to 2024, with a Compound Annual Growth Rate (CAGR) of xx%. This growth is primarily driven by the increasing prevalence of cancer, advancements in cancer treatment technologies, and rising demand for efficient and cost-effective healthcare solutions. Technological advancements, such as the integration of AI and machine learning algorithms for improved diagnostic accuracy and treatment planning, are significantly impacting market growth. The adoption of cloud-based solutions and the increasing focus on data interoperability are also major contributing factors. Shifting consumer demands toward personalized medicine and proactive cancer screening are further fueling market expansion. This trend is expected to continue throughout the forecast period, with a projected CAGR of xx% from 2025 to 2033, reaching xx Million by 2033.
- Growth Rate (2019-2024): xx% CAGR
- Adoption Rate of Cloud-based Solutions (2024): xx% of total installations
- Projected Market Size (2033): xx Million
Leading Regions, Countries, or Segments in Oncology Information Systems Industry
North America currently dominates the Oncology Information Systems market due to high healthcare expenditure, advanced technological infrastructure, and increased adoption of advanced treatment modalities. Within North America, the United States holds the largest market share. However, regions like Europe and Asia-Pacific are witnessing significant growth driven by rising cancer incidence and increasing government initiatives to improve healthcare infrastructure.
- Key Drivers (North America): High healthcare expenditure, advanced technological infrastructure, strong regulatory support for digital health initiatives.
- Key Drivers (Europe): Rising cancer incidence, government investments in healthcare infrastructure, increasing adoption of advanced cancer treatments.
- Key Drivers (Asia-Pacific): Increasing cancer incidence, growing healthcare expenditure, government initiatives to improve healthcare accessibility.
- Dominant Segment (By End-User): Hospitals, due to their large patient volumes and need for comprehensive oncology information management.
- Dominant Segment (By Product & Service): Software, driven by the increasing demand for advanced analytical tools and integrated platforms.
- Dominant Segment (By Application): Medical Oncology, owing to its higher prevalence and widespread adoption of sophisticated treatment protocols.
Oncology Information Systems Industry Product Innovations
Recent product innovations have focused on enhancing the capabilities of existing oncology information systems through the integration of AI-powered diagnostic tools, predictive analytics, and personalized treatment planning algorithms. This has resulted in improved accuracy, efficiency, and patient outcomes. Many vendors are also focusing on developing user-friendly interfaces and seamless integration with existing healthcare IT infrastructure to improve workflow efficiency. The adoption of cloud-based solutions is increasing due to their scalability and cost-effectiveness. Unique selling propositions often center around specialized features for specific cancer types, better data visualization tools, or simplified workflows.
Propelling Factors for Oncology Information Systems Industry Growth
Technological advancements, such as AI and machine learning, are at the forefront of market growth. These technologies facilitate improved diagnostic accuracy, personalized treatment planning, and efficient data management. The increasing prevalence of cancer globally necessitates efficient information management systems, furthering market expansion. Government initiatives promoting the adoption of digital health technologies and supportive regulatory frameworks also contribute significantly to the market's growth trajectory.
Obstacles in the Oncology Information Systems Industry Market
High implementation and maintenance costs represent a significant barrier to entry for some healthcare providers, particularly smaller clinics and hospitals. Data security concerns and the need for stringent compliance with data privacy regulations are also key challenges. Competition among established players and the emergence of new entrants can lead to price pressures. Supply chain disruptions can hinder the timely delivery of hardware and software components, potentially impacting project timelines.
Future Opportunities in Oncology Information Systems Industry
Emerging opportunities lie in expanding into underserved markets, particularly in developing countries with rising cancer rates. The integration of advanced technologies like genomics, proteomics, and radiomics into oncology information systems presents significant potential for improved diagnostic accuracy and personalized treatment. Increased demand for cloud-based, interoperable solutions will drive growth, along with solutions that address specific clinical needs such as targeted therapy monitoring and immune-oncology management.
Major Players in the Oncology Information Systems Industry Ecosystem
- Accuray Incorporated
- Oracle Corporation (Cerner Corporation)
- EndoSoft LLC
- Optum Inc
- Elekta AB
- Siemens Healthineers AG (Varian Medical Systems)
- RaySearch Laboratories AB
- CureMD Corporation
- F Hoffmann-La Roche Ltd (Flatiron Health Inc)
- McKesson Corporation
- BMSI Partners Inc
- MIM Software Inc
Key Developments in Oncology Information Systems Industry Industry
- May 2022: GE Healthcare partnered with RaySearch Laboratories AB to develop a new radiation therapy workflow solution.
- May 2022: Berry Oncology launched its HIFI system for genetic testing and early tumor screening.
These developments showcase the ongoing innovation and strategic partnerships shaping the Oncology Information Systems market.
Strategic Oncology Information Systems Industry Market Forecast
The Oncology Information Systems market is poised for significant growth over the next decade. Continued advancements in AI, big data analytics, and cloud computing will drive innovation and expand the functionalities of existing systems. The increasing prevalence of cancer globally, coupled with growing demand for efficient and cost-effective cancer care, will further fuel market expansion. Strategic partnerships and M&A activity will continue to reshape the competitive landscape, leading to a more consolidated yet innovative market. The market's growth will be underpinned by a focus on improving diagnostic accuracy, personalizing treatment plans, and enhancing the overall efficiency of oncology care.
Oncology Information Systems Industry Segmentation
-
1. Product and Service
- 1.1. Software
- 1.2. Application
-
2. Application
- 2.1. Medical Oncology
- 2.2. Radiation Oncology
- 2.3. Surgical Oncology
-
3. End User
- 3.1. Hospitals
- 3.2. Research Centers
- 3.3. Specialty Clinics
Oncology Information Systems Industry Segmentation By Geography
-
1. North America
- 1.1. United States
- 1.2. Canada
- 1.3. Mexico
-
2. Europe
- 2.1. Germany
- 2.2. United Kingdom
- 2.3. France
- 2.4. Italy
- 2.5. Spain
- 2.6. Rest of Europe
-
3. Asia Pacific
- 3.1. China
- 3.2. Japan
- 3.3. India
- 3.4. Australia
- 3.5. South Korea
- 3.6. Rest of Asia Pacific
-
4. Middle East and Africa
- 4.1. GCC
- 4.2. South Africa
- 4.3. Rest of Middle East and Africa
-
5. South America
- 5.1. Brazil
- 5.2. Argentina
- 5.3. Rest of South America
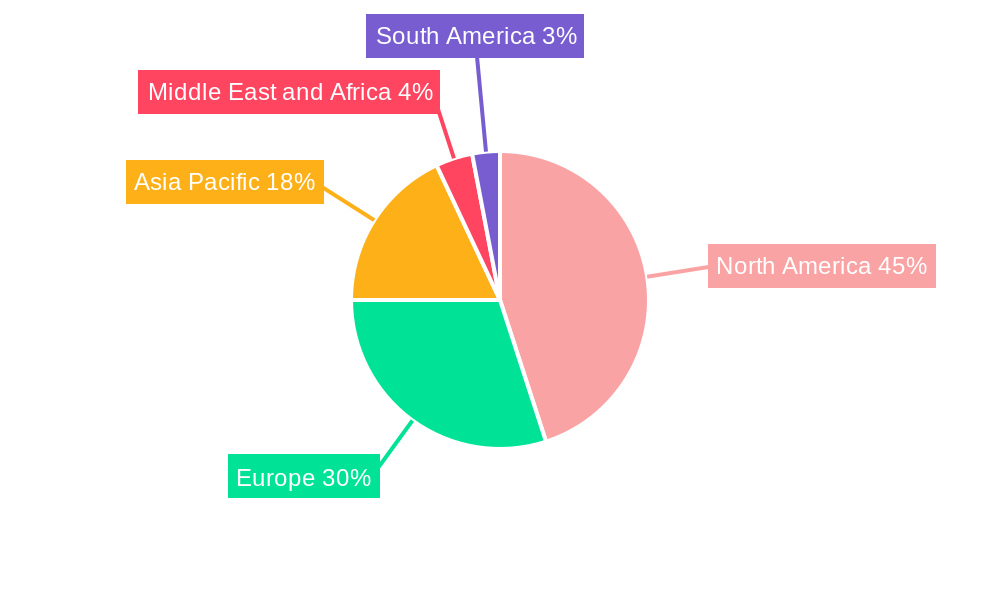
Oncology Information Systems Industry Regional Market Share
Geographic Coverage of Oncology Information Systems Industry
Oncology Information Systems Industry REPORT HIGHLIGHTS
| Aspects | Details |
|---|---|
| Study Period | 2020-2034 |
| Base Year | 2025 |
| Estimated Year | 2026 |
| Forecast Period | 2026-2034 |
| Historical Period | 2020-2025 |
| Growth Rate | CAGR of 7.56% from 2020-2034 |
| Segmentation |
|
Table of Contents
- 1. Introduction
- 1.1. Research Scope
- 1.2. Market Segmentation
- 1.3. Research Objective
- 1.4. Definitions and Assumptions
- 2. Executive Summary
- 2.1. Market Snapshot
- 3. Market Dynamics
- 3.1. Market Drivers
- 3.2. Market Restrains
- 3.3. Market Trends
- 3.4. Market Opportunities
- 4. Market Factor Analysis
- 4.1. Porters Five Forces
- 4.1.1. Bargaining Power of Suppliers
- 4.1.2. Bargaining Power of Buyers
- 4.1.3. Threat of New Entrants
- 4.1.4. Threat of Substitutes
- 4.1.5. Competitive Rivalry
- 4.2. PESTEL analysis
- 4.3. BCG Analysis
- 4.3.1. Stars (High Growth, High Market Share)
- 4.3.2. Cash Cows (Low Growth, High Market Share)
- 4.3.3. Question Mark (High Growth, Low Market Share)
- 4.3.4. Dogs (Low Growth, Low Market Share)
- 4.4. Ansoff Matrix Analysis
- 4.5. Supply Chain Analysis
- 4.6. Regulatory Landscape
- 4.7. Current Market Potential and Opportunity Assessment (TAM–SAM–SOM Framework)
- 4.8. DMV Analyst Note
- 4.1. Porters Five Forces
- 5. Market Analysis, Insights and Forecast 2021-2033
- 5.1. Market Analysis, Insights and Forecast - by Product and Service
- 5.1.1. Software
- 5.1.2. Application
- 5.2. Market Analysis, Insights and Forecast - by Application
- 5.2.1. Medical Oncology
- 5.2.2. Radiation Oncology
- 5.2.3. Surgical Oncology
- 5.3. Market Analysis, Insights and Forecast - by End User
- 5.3.1. Hospitals
- 5.3.2. Research Centers
- 5.3.3. Specialty Clinics
- 5.4. Market Analysis, Insights and Forecast - by Region
- 5.4.1. North America
- 5.4.2. Europe
- 5.4.3. Asia Pacific
- 5.4.4. Middle East and Africa
- 5.4.5. South America
- 5.1. Market Analysis, Insights and Forecast - by Product and Service
- 6. Global Oncology Information Systems Industry Analysis, Insights and Forecast, 2021-2033
- 6.1. Market Analysis, Insights and Forecast - by Product and Service
- 6.1.1. Software
- 6.1.2. Application
- 6.2. Market Analysis, Insights and Forecast - by Application
- 6.2.1. Medical Oncology
- 6.2.2. Radiation Oncology
- 6.2.3. Surgical Oncology
- 6.3. Market Analysis, Insights and Forecast - by End User
- 6.3.1. Hospitals
- 6.3.2. Research Centers
- 6.3.3. Specialty Clinics
- 6.1. Market Analysis, Insights and Forecast - by Product and Service
- 7. North America Oncology Information Systems Industry Analysis, Insights and Forecast, 2020-2032
- 7.1. Market Analysis, Insights and Forecast - by Product and Service
- 7.1.1. Software
- 7.1.2. Application
- 7.2. Market Analysis, Insights and Forecast - by Application
- 7.2.1. Medical Oncology
- 7.2.2. Radiation Oncology
- 7.2.3. Surgical Oncology
- 7.3. Market Analysis, Insights and Forecast - by End User
- 7.3.1. Hospitals
- 7.3.2. Research Centers
- 7.3.3. Specialty Clinics
- 7.1. Market Analysis, Insights and Forecast - by Product and Service
- 8. Europe Oncology Information Systems Industry Analysis, Insights and Forecast, 2020-2032
- 8.1. Market Analysis, Insights and Forecast - by Product and Service
- 8.1.1. Software
- 8.1.2. Application
- 8.2. Market Analysis, Insights and Forecast - by Application
- 8.2.1. Medical Oncology
- 8.2.2. Radiation Oncology
- 8.2.3. Surgical Oncology
- 8.3. Market Analysis, Insights and Forecast - by End User
- 8.3.1. Hospitals
- 8.3.2. Research Centers
- 8.3.3. Specialty Clinics
- 8.1. Market Analysis, Insights and Forecast - by Product and Service
- 9. Asia Pacific Oncology Information Systems Industry Analysis, Insights and Forecast, 2020-2032
- 9.1. Market Analysis, Insights and Forecast - by Product and Service
- 9.1.1. Software
- 9.1.2. Application
- 9.2. Market Analysis, Insights and Forecast - by Application
- 9.2.1. Medical Oncology
- 9.2.2. Radiation Oncology
- 9.2.3. Surgical Oncology
- 9.3. Market Analysis, Insights and Forecast - by End User
- 9.3.1. Hospitals
- 9.3.2. Research Centers
- 9.3.3. Specialty Clinics
- 9.1. Market Analysis, Insights and Forecast - by Product and Service
- 10. Middle East and Africa Oncology Information Systems Industry Analysis, Insights and Forecast, 2020-2032
- 10.1. Market Analysis, Insights and Forecast - by Product and Service
- 10.1.1. Software
- 10.1.2. Application
- 10.2. Market Analysis, Insights and Forecast - by Application
- 10.2.1. Medical Oncology
- 10.2.2. Radiation Oncology
- 10.2.3. Surgical Oncology
- 10.3. Market Analysis, Insights and Forecast - by End User
- 10.3.1. Hospitals
- 10.3.2. Research Centers
- 10.3.3. Specialty Clinics
- 10.1. Market Analysis, Insights and Forecast - by Product and Service
- 11. South America Oncology Information Systems Industry Analysis, Insights and Forecast, 2020-2032
- 11.1. Market Analysis, Insights and Forecast - by Product and Service
- 11.1.1. Software
- 11.1.2. Application
- 11.2. Market Analysis, Insights and Forecast - by Application
- 11.2.1. Medical Oncology
- 11.2.2. Radiation Oncology
- 11.2.3. Surgical Oncology
- 11.3. Market Analysis, Insights and Forecast - by End User
- 11.3.1. Hospitals
- 11.3.2. Research Centers
- 11.3.3. Specialty Clinics
- 11.1. Market Analysis, Insights and Forecast - by Product and Service
- 12. Competitive Analysis
- 12.1. Company Profiles
- 12.1.1 Accuray Incorporated
- 12.1.1.1. Company Overview
- 12.1.1.2. Products
- 12.1.1.3. Company Financials
- 12.1.1.4. SWOT Analysis
- 12.1.2 Oracle Corporation (Cerner Corporation)
- 12.1.2.1. Company Overview
- 12.1.2.2. Products
- 12.1.2.3. Company Financials
- 12.1.2.4. SWOT Analysis
- 12.1.3 EndoSoft LLC
- 12.1.3.1. Company Overview
- 12.1.3.2. Products
- 12.1.3.3. Company Financials
- 12.1.3.4. SWOT Analysis
- 12.1.4 Optum Inc
- 12.1.4.1. Company Overview
- 12.1.4.2. Products
- 12.1.4.3. Company Financials
- 12.1.4.4. SWOT Analysis
- 12.1.5 Elekta AB
- 12.1.5.1. Company Overview
- 12.1.5.2. Products
- 12.1.5.3. Company Financials
- 12.1.5.4. SWOT Analysis
- 12.1.6 Siemens Healthineers AG (Varian Medical Systems)
- 12.1.6.1. Company Overview
- 12.1.6.2. Products
- 12.1.6.3. Company Financials
- 12.1.6.4. SWOT Analysis
- 12.1.7 RaySearch Laboratories AB
- 12.1.7.1. Company Overview
- 12.1.7.2. Products
- 12.1.7.3. Company Financials
- 12.1.7.4. SWOT Analysis
- 12.1.8 CureMD Corporation
- 12.1.8.1. Company Overview
- 12.1.8.2. Products
- 12.1.8.3. Company Financials
- 12.1.8.4. SWOT Analysis
- 12.1.9 F Hoffmann-La Roche Ltd (Flatiron Health Inc )
- 12.1.9.1. Company Overview
- 12.1.9.2. Products
- 12.1.9.3. Company Financials
- 12.1.9.4. SWOT Analysis
- 12.1.10 McKesson Corporation
- 12.1.10.1. Company Overview
- 12.1.10.2. Products
- 12.1.10.3. Company Financials
- 12.1.10.4. SWOT Analysis
- 12.1.11 BMSI Partners Inc
- 12.1.11.1. Company Overview
- 12.1.11.2. Products
- 12.1.11.3. Company Financials
- 12.1.11.4. SWOT Analysis
- 12.1.12 MIM Software Inc
- 12.1.12.1. Company Overview
- 12.1.12.2. Products
- 12.1.12.3. Company Financials
- 12.1.12.4. SWOT Analysis
- 12.1.1 Accuray Incorporated
- 12.2. Market Entropy
- 12.2.1 Company's Key Areas Served
- 12.2.2 Recent Developments
- 12.3. Company Market Share Analysis 2025
- 12.3.1 Top 5 Companies Market Share Analysis
- 12.3.2 Top 3 Companies Market Share Analysis
- 12.4. List of Potential Customers
- 13. Research Methodology
List of Figures
- Figure 1: Global Oncology Information Systems Industry Revenue Breakdown (million, %) by Region 2025 & 2033
- Figure 2: Global Oncology Information Systems Industry Volume Breakdown (K Unit, %) by Region 2025 & 2033
- Figure 3: North America Oncology Information Systems Industry Revenue (million), by Product and Service 2025 & 2033
- Figure 4: North America Oncology Information Systems Industry Volume (K Unit), by Product and Service 2025 & 2033
- Figure 5: North America Oncology Information Systems Industry Revenue Share (%), by Product and Service 2025 & 2033
- Figure 6: North America Oncology Information Systems Industry Volume Share (%), by Product and Service 2025 & 2033
- Figure 7: North America Oncology Information Systems Industry Revenue (million), by Application 2025 & 2033
- Figure 8: North America Oncology Information Systems Industry Volume (K Unit), by Application 2025 & 2033
- Figure 9: North America Oncology Information Systems Industry Revenue Share (%), by Application 2025 & 2033
- Figure 10: North America Oncology Information Systems Industry Volume Share (%), by Application 2025 & 2033
- Figure 11: North America Oncology Information Systems Industry Revenue (million), by End User 2025 & 2033
- Figure 12: North America Oncology Information Systems Industry Volume (K Unit), by End User 2025 & 2033
- Figure 13: North America Oncology Information Systems Industry Revenue Share (%), by End User 2025 & 2033
- Figure 14: North America Oncology Information Systems Industry Volume Share (%), by End User 2025 & 2033
- Figure 15: North America Oncology Information Systems Industry Revenue (million), by Country 2025 & 2033
- Figure 16: North America Oncology Information Systems Industry Volume (K Unit), by Country 2025 & 2033
- Figure 17: North America Oncology Information Systems Industry Revenue Share (%), by Country 2025 & 2033
- Figure 18: North America Oncology Information Systems Industry Volume Share (%), by Country 2025 & 2033
- Figure 19: Europe Oncology Information Systems Industry Revenue (million), by Product and Service 2025 & 2033
- Figure 20: Europe Oncology Information Systems Industry Volume (K Unit), by Product and Service 2025 & 2033
- Figure 21: Europe Oncology Information Systems Industry Revenue Share (%), by Product and Service 2025 & 2033
- Figure 22: Europe Oncology Information Systems Industry Volume Share (%), by Product and Service 2025 & 2033
- Figure 23: Europe Oncology Information Systems Industry Revenue (million), by Application 2025 & 2033
- Figure 24: Europe Oncology Information Systems Industry Volume (K Unit), by Application 2025 & 2033
- Figure 25: Europe Oncology Information Systems Industry Revenue Share (%), by Application 2025 & 2033
- Figure 26: Europe Oncology Information Systems Industry Volume Share (%), by Application 2025 & 2033
- Figure 27: Europe Oncology Information Systems Industry Revenue (million), by End User 2025 & 2033
- Figure 28: Europe Oncology Information Systems Industry Volume (K Unit), by End User 2025 & 2033
- Figure 29: Europe Oncology Information Systems Industry Revenue Share (%), by End User 2025 & 2033
- Figure 30: Europe Oncology Information Systems Industry Volume Share (%), by End User 2025 & 2033
- Figure 31: Europe Oncology Information Systems Industry Revenue (million), by Country 2025 & 2033
- Figure 32: Europe Oncology Information Systems Industry Volume (K Unit), by Country 2025 & 2033
- Figure 33: Europe Oncology Information Systems Industry Revenue Share (%), by Country 2025 & 2033
- Figure 34: Europe Oncology Information Systems Industry Volume Share (%), by Country 2025 & 2033
- Figure 35: Asia Pacific Oncology Information Systems Industry Revenue (million), by Product and Service 2025 & 2033
- Figure 36: Asia Pacific Oncology Information Systems Industry Volume (K Unit), by Product and Service 2025 & 2033
- Figure 37: Asia Pacific Oncology Information Systems Industry Revenue Share (%), by Product and Service 2025 & 2033
- Figure 38: Asia Pacific Oncology Information Systems Industry Volume Share (%), by Product and Service 2025 & 2033
- Figure 39: Asia Pacific Oncology Information Systems Industry Revenue (million), by Application 2025 & 2033
- Figure 40: Asia Pacific Oncology Information Systems Industry Volume (K Unit), by Application 2025 & 2033
- Figure 41: Asia Pacific Oncology Information Systems Industry Revenue Share (%), by Application 2025 & 2033
- Figure 42: Asia Pacific Oncology Information Systems Industry Volume Share (%), by Application 2025 & 2033
- Figure 43: Asia Pacific Oncology Information Systems Industry Revenue (million), by End User 2025 & 2033
- Figure 44: Asia Pacific Oncology Information Systems Industry Volume (K Unit), by End User 2025 & 2033
- Figure 45: Asia Pacific Oncology Information Systems Industry Revenue Share (%), by End User 2025 & 2033
- Figure 46: Asia Pacific Oncology Information Systems Industry Volume Share (%), by End User 2025 & 2033
- Figure 47: Asia Pacific Oncology Information Systems Industry Revenue (million), by Country 2025 & 2033
- Figure 48: Asia Pacific Oncology Information Systems Industry Volume (K Unit), by Country 2025 & 2033
- Figure 49: Asia Pacific Oncology Information Systems Industry Revenue Share (%), by Country 2025 & 2033
- Figure 50: Asia Pacific Oncology Information Systems Industry Volume Share (%), by Country 2025 & 2033
- Figure 51: Middle East and Africa Oncology Information Systems Industry Revenue (million), by Product and Service 2025 & 2033
- Figure 52: Middle East and Africa Oncology Information Systems Industry Volume (K Unit), by Product and Service 2025 & 2033
- Figure 53: Middle East and Africa Oncology Information Systems Industry Revenue Share (%), by Product and Service 2025 & 2033
- Figure 54: Middle East and Africa Oncology Information Systems Industry Volume Share (%), by Product and Service 2025 & 2033
- Figure 55: Middle East and Africa Oncology Information Systems Industry Revenue (million), by Application 2025 & 2033
- Figure 56: Middle East and Africa Oncology Information Systems Industry Volume (K Unit), by Application 2025 & 2033
- Figure 57: Middle East and Africa Oncology Information Systems Industry Revenue Share (%), by Application 2025 & 2033
- Figure 58: Middle East and Africa Oncology Information Systems Industry Volume Share (%), by Application 2025 & 2033
- Figure 59: Middle East and Africa Oncology Information Systems Industry Revenue (million), by End User 2025 & 2033
- Figure 60: Middle East and Africa Oncology Information Systems Industry Volume (K Unit), by End User 2025 & 2033
- Figure 61: Middle East and Africa Oncology Information Systems Industry Revenue Share (%), by End User 2025 & 2033
- Figure 62: Middle East and Africa Oncology Information Systems Industry Volume Share (%), by End User 2025 & 2033
- Figure 63: Middle East and Africa Oncology Information Systems Industry Revenue (million), by Country 2025 & 2033
- Figure 64: Middle East and Africa Oncology Information Systems Industry Volume (K Unit), by Country 2025 & 2033
- Figure 65: Middle East and Africa Oncology Information Systems Industry Revenue Share (%), by Country 2025 & 2033
- Figure 66: Middle East and Africa Oncology Information Systems Industry Volume Share (%), by Country 2025 & 2033
- Figure 67: South America Oncology Information Systems Industry Revenue (million), by Product and Service 2025 & 2033
- Figure 68: South America Oncology Information Systems Industry Volume (K Unit), by Product and Service 2025 & 2033
- Figure 69: South America Oncology Information Systems Industry Revenue Share (%), by Product and Service 2025 & 2033
- Figure 70: South America Oncology Information Systems Industry Volume Share (%), by Product and Service 2025 & 2033
- Figure 71: South America Oncology Information Systems Industry Revenue (million), by Application 2025 & 2033
- Figure 72: South America Oncology Information Systems Industry Volume (K Unit), by Application 2025 & 2033
- Figure 73: South America Oncology Information Systems Industry Revenue Share (%), by Application 2025 & 2033
- Figure 74: South America Oncology Information Systems Industry Volume Share (%), by Application 2025 & 2033
- Figure 75: South America Oncology Information Systems Industry Revenue (million), by End User 2025 & 2033
- Figure 76: South America Oncology Information Systems Industry Volume (K Unit), by End User 2025 & 2033
- Figure 77: South America Oncology Information Systems Industry Revenue Share (%), by End User 2025 & 2033
- Figure 78: South America Oncology Information Systems Industry Volume Share (%), by End User 2025 & 2033
- Figure 79: South America Oncology Information Systems Industry Revenue (million), by Country 2025 & 2033
- Figure 80: South America Oncology Information Systems Industry Volume (K Unit), by Country 2025 & 2033
- Figure 81: South America Oncology Information Systems Industry Revenue Share (%), by Country 2025 & 2033
- Figure 82: South America Oncology Information Systems Industry Volume Share (%), by Country 2025 & 2033
List of Tables
- Table 1: Global Oncology Information Systems Industry Revenue million Forecast, by Product and Service 2020 & 2033
- Table 2: Global Oncology Information Systems Industry Volume K Unit Forecast, by Product and Service 2020 & 2033
- Table 3: Global Oncology Information Systems Industry Revenue million Forecast, by Application 2020 & 2033
- Table 4: Global Oncology Information Systems Industry Volume K Unit Forecast, by Application 2020 & 2033
- Table 5: Global Oncology Information Systems Industry Revenue million Forecast, by End User 2020 & 2033
- Table 6: Global Oncology Information Systems Industry Volume K Unit Forecast, by End User 2020 & 2033
- Table 7: Global Oncology Information Systems Industry Revenue million Forecast, by Region 2020 & 2033
- Table 8: Global Oncology Information Systems Industry Volume K Unit Forecast, by Region 2020 & 2033
- Table 9: Global Oncology Information Systems Industry Revenue million Forecast, by Product and Service 2020 & 2033
- Table 10: Global Oncology Information Systems Industry Volume K Unit Forecast, by Product and Service 2020 & 2033
- Table 11: Global Oncology Information Systems Industry Revenue million Forecast, by Application 2020 & 2033
- Table 12: Global Oncology Information Systems Industry Volume K Unit Forecast, by Application 2020 & 2033
- Table 13: Global Oncology Information Systems Industry Revenue million Forecast, by End User 2020 & 2033
- Table 14: Global Oncology Information Systems Industry Volume K Unit Forecast, by End User 2020 & 2033
- Table 15: Global Oncology Information Systems Industry Revenue million Forecast, by Country 2020 & 2033
- Table 16: Global Oncology Information Systems Industry Volume K Unit Forecast, by Country 2020 & 2033
- Table 17: United States Oncology Information Systems Industry Revenue (million) Forecast, by Application 2020 & 2033
- Table 18: United States Oncology Information Systems Industry Volume (K Unit) Forecast, by Application 2020 & 2033
- Table 19: Canada Oncology Information Systems Industry Revenue (million) Forecast, by Application 2020 & 2033
- Table 20: Canada Oncology Information Systems Industry Volume (K Unit) Forecast, by Application 2020 & 2033
- Table 21: Mexico Oncology Information Systems Industry Revenue (million) Forecast, by Application 2020 & 2033
- Table 22: Mexico Oncology Information Systems Industry Volume (K Unit) Forecast, by Application 2020 & 2033
- Table 23: Global Oncology Information Systems Industry Revenue million Forecast, by Product and Service 2020 & 2033
- Table 24: Global Oncology Information Systems Industry Volume K Unit Forecast, by Product and Service 2020 & 2033
- Table 25: Global Oncology Information Systems Industry Revenue million Forecast, by Application 2020 & 2033
- Table 26: Global Oncology Information Systems Industry Volume K Unit Forecast, by Application 2020 & 2033
- Table 27: Global Oncology Information Systems Industry Revenue million Forecast, by End User 2020 & 2033
- Table 28: Global Oncology Information Systems Industry Volume K Unit Forecast, by End User 2020 & 2033
- Table 29: Global Oncology Information Systems Industry Revenue million Forecast, by Country 2020 & 2033
- Table 30: Global Oncology Information Systems Industry Volume K Unit Forecast, by Country 2020 & 2033
- Table 31: Germany Oncology Information Systems Industry Revenue (million) Forecast, by Application 2020 & 2033
- Table 32: Germany Oncology Information Systems Industry Volume (K Unit) Forecast, by Application 2020 & 2033
- Table 33: United Kingdom Oncology Information Systems Industry Revenue (million) Forecast, by Application 2020 & 2033
- Table 34: United Kingdom Oncology Information Systems Industry Volume (K Unit) Forecast, by Application 2020 & 2033
- Table 35: France Oncology Information Systems Industry Revenue (million) Forecast, by Application 2020 & 2033
- Table 36: France Oncology Information Systems Industry Volume (K Unit) Forecast, by Application 2020 & 2033
- Table 37: Italy Oncology Information Systems Industry Revenue (million) Forecast, by Application 2020 & 2033
- Table 38: Italy Oncology Information Systems Industry Volume (K Unit) Forecast, by Application 2020 & 2033
- Table 39: Spain Oncology Information Systems Industry Revenue (million) Forecast, by Application 2020 & 2033
- Table 40: Spain Oncology Information Systems Industry Volume (K Unit) Forecast, by Application 2020 & 2033
- Table 41: Rest of Europe Oncology Information Systems Industry Revenue (million) Forecast, by Application 2020 & 2033
- Table 42: Rest of Europe Oncology Information Systems Industry Volume (K Unit) Forecast, by Application 2020 & 2033
- Table 43: Global Oncology Information Systems Industry Revenue million Forecast, by Product and Service 2020 & 2033
- Table 44: Global Oncology Information Systems Industry Volume K Unit Forecast, by Product and Service 2020 & 2033
- Table 45: Global Oncology Information Systems Industry Revenue million Forecast, by Application 2020 & 2033
- Table 46: Global Oncology Information Systems Industry Volume K Unit Forecast, by Application 2020 & 2033
- Table 47: Global Oncology Information Systems Industry Revenue million Forecast, by End User 2020 & 2033
- Table 48: Global Oncology Information Systems Industry Volume K Unit Forecast, by End User 2020 & 2033
- Table 49: Global Oncology Information Systems Industry Revenue million Forecast, by Country 2020 & 2033
- Table 50: Global Oncology Information Systems Industry Volume K Unit Forecast, by Country 2020 & 2033
- Table 51: China Oncology Information Systems Industry Revenue (million) Forecast, by Application 2020 & 2033
- Table 52: China Oncology Information Systems Industry Volume (K Unit) Forecast, by Application 2020 & 2033
- Table 53: Japan Oncology Information Systems Industry Revenue (million) Forecast, by Application 2020 & 2033
- Table 54: Japan Oncology Information Systems Industry Volume (K Unit) Forecast, by Application 2020 & 2033
- Table 55: India Oncology Information Systems Industry Revenue (million) Forecast, by Application 2020 & 2033
- Table 56: India Oncology Information Systems Industry Volume (K Unit) Forecast, by Application 2020 & 2033
- Table 57: Australia Oncology Information Systems Industry Revenue (million) Forecast, by Application 2020 & 2033
- Table 58: Australia Oncology Information Systems Industry Volume (K Unit) Forecast, by Application 2020 & 2033
- Table 59: South Korea Oncology Information Systems Industry Revenue (million) Forecast, by Application 2020 & 2033
- Table 60: South Korea Oncology Information Systems Industry Volume (K Unit) Forecast, by Application 2020 & 2033
- Table 61: Rest of Asia Pacific Oncology Information Systems Industry Revenue (million) Forecast, by Application 2020 & 2033
- Table 62: Rest of Asia Pacific Oncology Information Systems Industry Volume (K Unit) Forecast, by Application 2020 & 2033
- Table 63: Global Oncology Information Systems Industry Revenue million Forecast, by Product and Service 2020 & 2033
- Table 64: Global Oncology Information Systems Industry Volume K Unit Forecast, by Product and Service 2020 & 2033
- Table 65: Global Oncology Information Systems Industry Revenue million Forecast, by Application 2020 & 2033
- Table 66: Global Oncology Information Systems Industry Volume K Unit Forecast, by Application 2020 & 2033
- Table 67: Global Oncology Information Systems Industry Revenue million Forecast, by End User 2020 & 2033
- Table 68: Global Oncology Information Systems Industry Volume K Unit Forecast, by End User 2020 & 2033
- Table 69: Global Oncology Information Systems Industry Revenue million Forecast, by Country 2020 & 2033
- Table 70: Global Oncology Information Systems Industry Volume K Unit Forecast, by Country 2020 & 2033
- Table 71: GCC Oncology Information Systems Industry Revenue (million) Forecast, by Application 2020 & 2033
- Table 72: GCC Oncology Information Systems Industry Volume (K Unit) Forecast, by Application 2020 & 2033
- Table 73: South Africa Oncology Information Systems Industry Revenue (million) Forecast, by Application 2020 & 2033
- Table 74: South Africa Oncology Information Systems Industry Volume (K Unit) Forecast, by Application 2020 & 2033
- Table 75: Rest of Middle East and Africa Oncology Information Systems Industry Revenue (million) Forecast, by Application 2020 & 2033
- Table 76: Rest of Middle East and Africa Oncology Information Systems Industry Volume (K Unit) Forecast, by Application 2020 & 2033
- Table 77: Global Oncology Information Systems Industry Revenue million Forecast, by Product and Service 2020 & 2033
- Table 78: Global Oncology Information Systems Industry Volume K Unit Forecast, by Product and Service 2020 & 2033
- Table 79: Global Oncology Information Systems Industry Revenue million Forecast, by Application 2020 & 2033
- Table 80: Global Oncology Information Systems Industry Volume K Unit Forecast, by Application 2020 & 2033
- Table 81: Global Oncology Information Systems Industry Revenue million Forecast, by End User 2020 & 2033
- Table 82: Global Oncology Information Systems Industry Volume K Unit Forecast, by End User 2020 & 2033
- Table 83: Global Oncology Information Systems Industry Revenue million Forecast, by Country 2020 & 2033
- Table 84: Global Oncology Information Systems Industry Volume K Unit Forecast, by Country 2020 & 2033
- Table 85: Brazil Oncology Information Systems Industry Revenue (million) Forecast, by Application 2020 & 2033
- Table 86: Brazil Oncology Information Systems Industry Volume (K Unit) Forecast, by Application 2020 & 2033
- Table 87: Argentina Oncology Information Systems Industry Revenue (million) Forecast, by Application 2020 & 2033
- Table 88: Argentina Oncology Information Systems Industry Volume (K Unit) Forecast, by Application 2020 & 2033
- Table 89: Rest of South America Oncology Information Systems Industry Revenue (million) Forecast, by Application 2020 & 2033
- Table 90: Rest of South America Oncology Information Systems Industry Volume (K Unit) Forecast, by Application 2020 & 2033
Frequently Asked Questions
1. What is the projected Compound Annual Growth Rate (CAGR) of the Oncology Information Systems Industry?
The projected CAGR is approximately 7.56%.
2. Which companies are prominent players in the Oncology Information Systems Industry?
Key companies in the market include Accuray Incorporated, Oracle Corporation (Cerner Corporation), EndoSoft LLC, Optum Inc, Elekta AB, Siemens Healthineers AG (Varian Medical Systems), RaySearch Laboratories AB, CureMD Corporation, F Hoffmann-La Roche Ltd (Flatiron Health Inc ), McKesson Corporation, BMSI Partners Inc, MIM Software Inc .
3. What are the main segments of the Oncology Information Systems Industry?
The market segments include Product and Service, Application, End User.
4. Can you provide details about the market size?
The market size is estimated to be USD 963.88 million as of 2022.
5. What are some drivers contributing to market growth?
Rising incidence of Cancer Worldwide; Growing Government Initiatives for Cancer Awareness.
6. What are the notable trends driving market growth?
Software Segment is Expected to Hold the Largest Market Share in the Oncology Information System Market.
7. Are there any restraints impacting market growth?
High Cost of Cancer Therapies; Dearth of Skilled Professionals.
8. Can you provide examples of recent developments in the market?
May 2022: GE Healthcare entered into an agreement with RaySearch Laboratories AB, a radiation oncology software provider, to develop a new radiation therapy simulation and treatment planning workflow solution designed to simplify how radiation will be targeted to shrink a tumor.
9. What pricing options are available for accessing the report?
Pricing options include single-user, multi-user, and enterprise licenses priced at USD 4750, USD 5250, and USD 8750 respectively.
10. Is the market size provided in terms of value or volume?
The market size is provided in terms of value, measured in million and volume, measured in K Unit.
11. Are there any specific market keywords associated with the report?
Yes, the market keyword associated with the report is "Oncology Information Systems Industry," which aids in identifying and referencing the specific market segment covered.
12. How do I determine which pricing option suits my needs best?
The pricing options vary based on user requirements and access needs. Individual users may opt for single-user licenses, while businesses requiring broader access may choose multi-user or enterprise licenses for cost-effective access to the report.
13. Are there any additional resources or data provided in the Oncology Information Systems Industry report?
While the report offers comprehensive insights, it's advisable to review the specific contents or supplementary materials provided to ascertain if additional resources or data are available.
14. How can I stay updated on further developments or reports in the Oncology Information Systems Industry?
To stay informed about further developments, trends, and reports in the Oncology Information Systems Industry, consider subscribing to industry newsletters, following relevant companies and organizations, or regularly checking reputable industry news sources and publications.
Methodology
Step 1 - Identification of Relevant Samples Size from Population Database


Step 2 - Approaches for Defining Global Market Size (Value, Volume* & Price*)

Note*: In applicable scenarios
Step 3 - Data Sources
Primary Research
- Web Analytics
- Survey Reports
- Research Institute
- Latest Research Reports
- Opinion Leaders
Secondary Research
- Annual Reports
- White Paper
- Latest Press Release
- Industry Association
- Paid Database
- Investor Presentations

Step 4 - Data Triangulation
Involves using different sources of information in order to increase the validity of a study
These sources are likely to be stakeholders in a program - participants, other researchers, program staff, other community members, and so on.
Then we put all data in single framework & apply various statistical tools to find out the dynamic on the market.
During the analysis stage, feedback from the stakeholder groups would be compared to determine areas of agreement as well as areas of divergence