

Key Insights
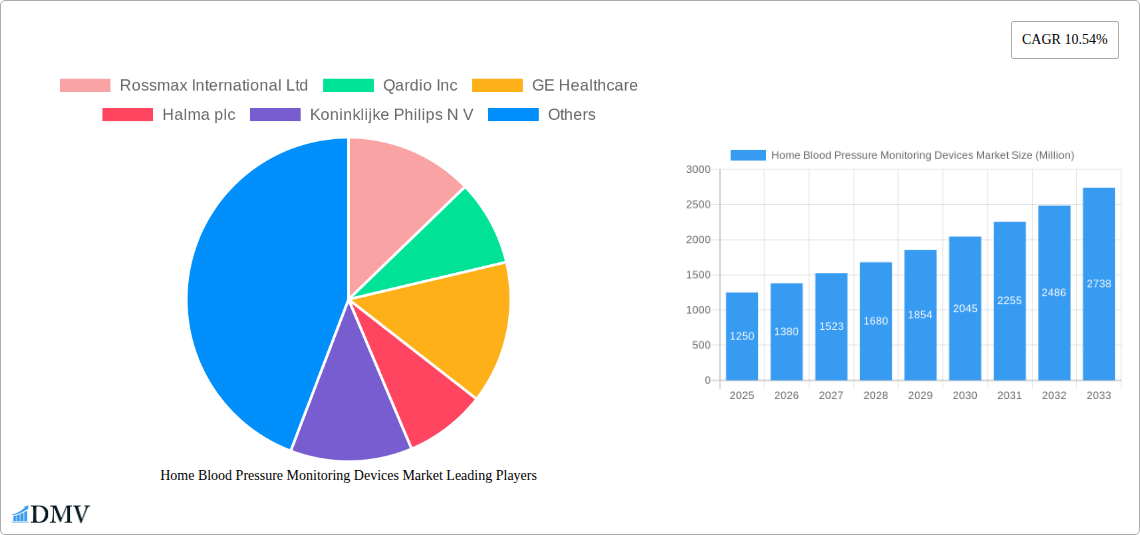
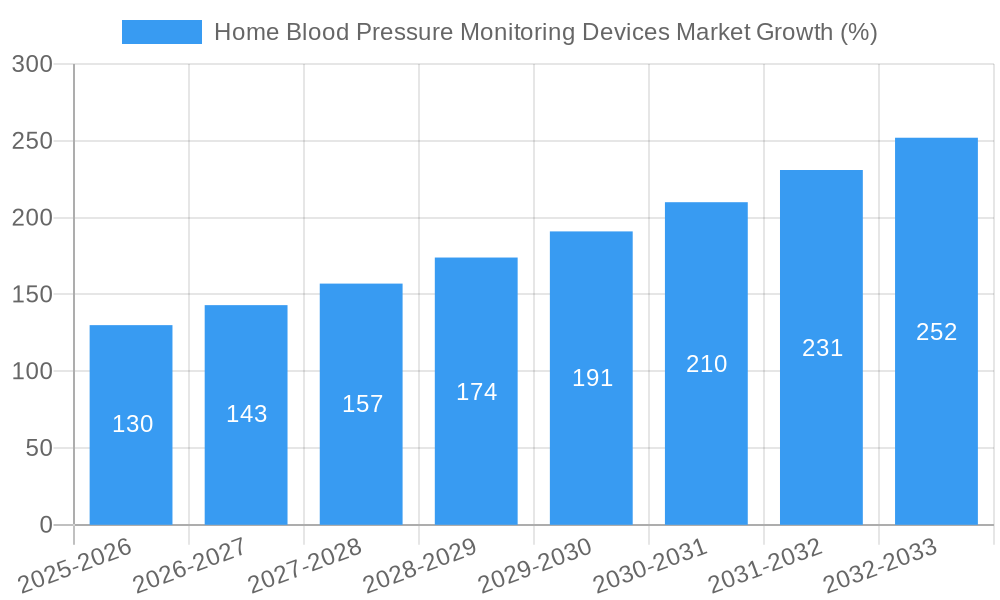
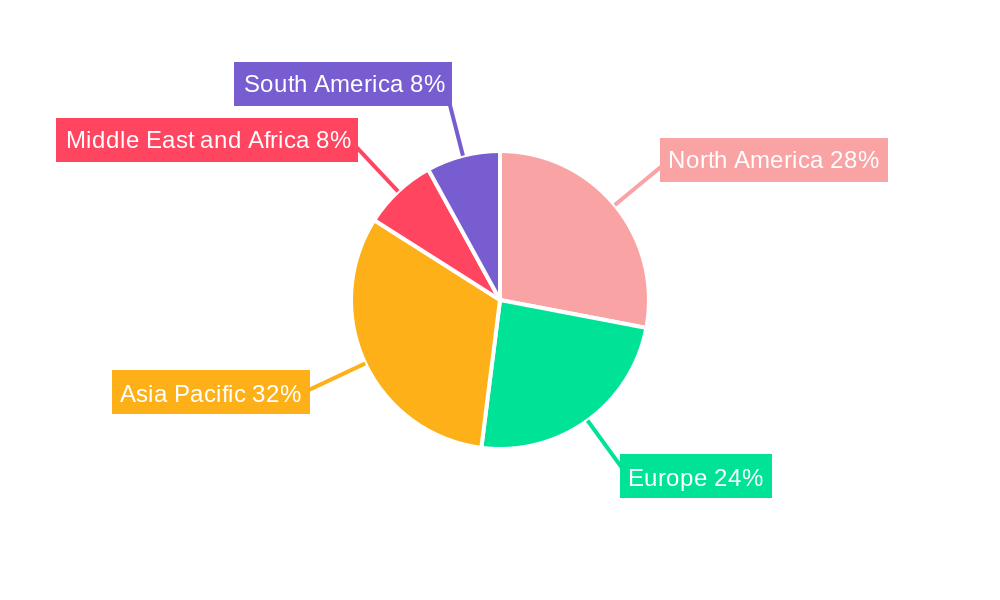
The global Home Blood Pressure Monitoring Devices market is experiencing robust growth, projected to reach a market size of $1.25 billion in 2025, with a Compound Annual Growth Rate (CAGR) of 10.54% from 2025 to 2033. This expansion is fueled by several key factors. The rising prevalence of hypertension and cardiovascular diseases globally necessitates regular blood pressure monitoring, driving demand for convenient and accurate home monitoring devices. Technological advancements, such as the development of more user-friendly and connected devices with smartphone integration and data analysis capabilities, are also contributing significantly to market growth. Furthermore, the increasing awareness of preventative healthcare and self-management of chronic conditions among consumers is boosting the adoption of home blood pressure monitors. The market is segmented by product type (upper arm monitors, wrist monitors, and accessories) and distribution channels (hospital pharmacies, online pharmacies, and other channels). While upper arm monitors currently dominate the market due to their accuracy, wrist monitors are gaining traction due to their portability and convenience. The growth of e-commerce platforms and online pharmacies is further expanding market accessibility. Geographic growth varies, with North America and Europe holding substantial market shares currently, but rapidly developing economies in Asia-Pacific are projected to show significant growth potential in the coming years due to increasing healthcare expenditure and rising health consciousness.
The competitive landscape is marked by the presence of both established players like Omron Healthcare Inc, Philips, and GE Healthcare, and smaller, specialized companies focusing on innovative features and technologies. The market is likely to witness increased competition, with companies focusing on product differentiation through improved accuracy, enhanced connectivity, and user-friendly interfaces. Potential restraints on market growth include factors like the cost of devices, particularly advanced models with smart features, and the potential for inaccurate readings from less reliable devices. However, these restraints are expected to be offset by the overall increase in healthcare expenditure and the growing need for effective chronic disease management. Continued innovation and advancements in technology will be crucial for market players to maintain their competitiveness and capture market share in this dynamic sector.
Home Blood Pressure Monitoring Devices Market: A Comprehensive Report (2019-2033)
This insightful report provides a detailed analysis of the Home Blood Pressure Monitoring Devices Market, covering the period from 2019 to 2033. The study encompasses market sizing, segmentation, competitive landscape, technological advancements, and future growth projections. It's an essential resource for stakeholders, including manufacturers, distributors, investors, and healthcare professionals seeking to navigate this dynamic market. The market is expected to reach xx Million by 2033, presenting significant opportunities for growth.
Home Blood Pressure Monitoring Devices Market Market Composition & Trends
This section delves into the intricate structure of the home blood pressure monitoring devices market, examining market concentration, innovation drivers, regulatory frameworks, substitute products, end-user profiles, and merger and acquisition (M&A) activities. The report analyzes the market share distribution among key players like Omron Healthcare Inc, Koninklijke Philips N V, and others, revealing a moderately consolidated market with opportunities for both established players and emerging entrants.
- Market Concentration: The market exhibits a [insert market concentration metric, e.g., Herfindahl-Hirschman Index (HHI) value] indicating a [insert description, e.g., moderately concentrated] market structure.
- Innovation Catalysts: Miniaturization, wireless connectivity, and AI-driven data analysis are driving innovation.
- Regulatory Landscape: Stringent regulatory approvals and adherence to safety standards significantly influence market dynamics. Variations in regulations across different geographies create both challenges and opportunities.
- Substitute Products: While few direct substitutes exist, alternative monitoring methods (e.g., regular clinical checks) represent indirect competition.
- End-User Profiles: The primary end-users are individuals with hypertension, cardiovascular diseases, and aging populations seeking proactive health management.
- M&A Activities: The report identifies key M&A deals in the sector, quantifying their impact (e.g., total deal values reached xx Million in the historical period). Examples include [insert specific examples of M&A activities if available, including deal values and dates].
Home Blood Pressure Monitoring Devices Market Industry Evolution
This section analyzes the historical and projected growth trajectory of the home blood pressure monitoring devices market. Growth has been driven by increasing prevalence of hypertension and cardiovascular diseases, rising healthcare awareness, technological advancements in device accuracy and connectivity, and the increasing adoption of telemedicine. The market is expected to grow at a CAGR of xx% during the forecast period (2025-2033). The historical period (2019-2024) witnessed a CAGR of xx%, with [insert specific data points on market size for key years, e.g., market size in 2019 was xx Million, and in 2024 it reached xx Million]. The adoption of smart devices and integration with health monitoring apps is further accelerating market growth. Technological advancements such as cuff-less blood pressure monitoring are creating new market segments and increasing the overall market size. The increasing demand for accurate, convenient, and user-friendly home blood pressure monitoring devices is a major driver of market expansion. Furthermore, the growing focus on preventive healthcare is contributing significantly to market growth.
Leading Regions, Countries, or Segments in Home Blood Pressure Monitoring Devices Market
This section identifies the dominant regions, countries, and market segments within the home blood pressure monitoring devices market. Data suggests that [insert dominant region/country, e.g., North America] holds the largest market share due to [explain factors driving dominance, e.g., high prevalence of hypertension, strong healthcare infrastructure, and high disposable income].
Key Drivers by Segment:
- Product:
- Upper Arm Monitors: High accuracy and established user preference contribute to its dominance.
- Wrist Monitors: Convenience and portability drive increasing adoption.
- Accessories: Growth is linked to the increasing adoption of connected devices and data management systems.
- Distribution Channel:
- Online Pharmacies: Convenience and competitive pricing fuel growth in this channel.
- Hospital Pharmacies: This channel retains a significant share due to its established reach within healthcare systems.
- Other Distribution Channels: This includes retailers, direct sales, and other channels with varying levels of market penetration.
Home Blood Pressure Monitoring Devices Market Product Innovations
Recent years have witnessed significant innovations in home blood pressure monitoring devices, including the integration of advanced sensors, improved algorithms for more accurate readings, wireless connectivity for remote monitoring, and user-friendly interfaces with data storage and analysis capabilities. The emergence of cuff-less monitoring technologies, like LiveMetric's LiveOne, represents a significant leap forward, offering real-time, continuous blood pressure monitoring. These innovations enhance convenience, accuracy, and the overall effectiveness of home blood pressure management.
Propelling Factors for Home Blood Pressure Monitoring Devices Market Growth
The market is propelled by several factors: the rising prevalence of hypertension and cardiovascular diseases globally, an aging population, increasing healthcare awareness and self-monitoring trends, technological advancements leading to more accurate, user-friendly devices, and supportive regulatory frameworks encouraging remote patient monitoring. Government initiatives promoting preventive healthcare further contribute to market expansion.
Obstacles in the Home Blood Pressure Monitoring Devices Market Market
Market growth faces challenges like stringent regulatory approvals, potential supply chain disruptions affecting component availability, and intense competition from established and emerging players. Price sensitivity among consumers and the need for consistent user compliance also pose challenges. Moreover, ensuring data privacy and security in connected devices is a growing concern.
Future Opportunities in Home Blood Pressure Monitoring Devices Market
Future growth will be driven by expanding into emerging markets with rising healthcare expenditure, integrating advanced technologies like AI and machine learning for improved diagnostic capabilities and personalized health management, and developing more user-friendly, portable, and wearable devices. The focus will increasingly be on preventative care and remote patient monitoring through connected devices.
Major Players in the Home Blood Pressure Monitoring Devices Market Ecosystem
- Rossmax International Ltd
- Qardio Inc
- GE Healthcare
- Halma plc
- Koninklijke Philips N V
- Spengler SAS
- A&D Medical
- Contec Medical
- Omron Healthcare Inc
- Welch Allyn Inc
- Beurer GmbH
- American Diagnostic Corporation
Key Developments in Home Blood Pressure Monitoring Devices Market Industry
- July 2022: LiveMetric launched LiveOne, a wrist-worn, cuff-free blood pressure monitor offering real-time measurements. This innovation significantly impacts market dynamics by introducing a novel approach to continuous monitoring.
- February 2022: InBody launched the InBody BP 170, a new home blood pressure monitor with an enhanced large display. This highlights the ongoing focus on improving user experience and device usability.
Strategic Home Blood Pressure Monitoring Devices Market Market Forecast
The home blood pressure monitoring devices market is poised for robust growth over the forecast period (2025-2033), driven by technological advancements, increasing healthcare awareness, and the rising prevalence of hypertension and cardiovascular diseases. The integration of innovative technologies like AI and the expansion into untapped markets will be key drivers of future growth. The market’s potential is substantial, promising significant returns for investors and stakeholders.
Home Blood Pressure Monitoring Devices Market Segmentation
-
1. Product
- 1.1. Upper Arm Monitors
- 1.2. Wrist Monitors
- 1.3. Accessories
-
2. Distribution Channel
- 2.1. Hospital Pharmacies
- 2.2. Online Pharmacies
- 2.3. Other Distribution Channels
Home Blood Pressure Monitoring Devices Market Segmentation By Geography
-
1. North America
- 1.1. United States
- 1.2. Canada
- 1.3. Mexico
-
2. Europe
- 2.1. Germany
- 2.2. United Kingdom
- 2.3. France
- 2.4. Italy
- 2.5. Spain
- 2.6. Rest of Europe
-
3. Asia Pacific
- 3.1. China
- 3.2. Japan
- 3.3. India
- 3.4. Australia
- 3.5. South Korea
- 3.6. Rest of Asia Pacific
-
4. Middle East and Africa
- 4.1. GCC
- 4.2. South Africa
- 4.3. Rest of Middle East and Africa
-
5. South America
- 5.1. Brazil
- 5.2. Argentina
- 5.3. Rest of South America
Home Blood Pressure Monitoring Devices Market REPORT HIGHLIGHTS
| Aspects | Details |
|---|---|
| Study Period | 2019-2033 |
| Base Year | 2024 |
| Estimated Year | 2025 |
| Forecast Period | 2025-2033 |
| Historical Period | 2019-2024 |
| Growth Rate | CAGR of 10.54% from 2019-2033 |
| Segmentation |
|
Table of Contents
- 1. Introduction
- 1.1. Research Scope
- 1.2. Market Segmentation
- 1.3. Research Methodology
- 1.4. Definitions and Assumptions
- 2. Executive Summary
- 2.1. Introduction
- 3. Market Dynamics
- 3.1. Introduction
- 3.2. Market Drivers
- 3.2.1. Growing Burden of Blood Pressure-Related Diseases; Rise in the Use of Home Blood Pressure Monitors and Active Promotions; Advancements in the Devices
- 3.3. Market Restrains
- 3.3.1. High Cost and Accuracy of Devices
- 3.4. Market Trends
- 3.4.1. Wrist Monitors Segment is Dominating the Home Blood Pressure Monitoring Devices Market
- 4. Market Factor Analysis
- 4.1. Porters Five Forces
- 4.2. Supply/Value Chain
- 4.3. PESTEL analysis
- 4.4. Market Entropy
- 4.5. Patent/Trademark Analysis
- 5. Global Home Blood Pressure Monitoring Devices Market Analysis, Insights and Forecast, 2019-2031
- 5.1. Market Analysis, Insights and Forecast - by Product
- 5.1.1. Upper Arm Monitors
- 5.1.2. Wrist Monitors
- 5.1.3. Accessories
- 5.2. Market Analysis, Insights and Forecast - by Distribution Channel
- 5.2.1. Hospital Pharmacies
- 5.2.2. Online Pharmacies
- 5.2.3. Other Distribution Channels
- 5.3. Market Analysis, Insights and Forecast - by Region
- 5.3.1. North America
- 5.3.2. Europe
- 5.3.3. Asia Pacific
- 5.3.4. Middle East and Africa
- 5.3.5. South America
- 5.1. Market Analysis, Insights and Forecast - by Product
- 6. North America Home Blood Pressure Monitoring Devices Market Analysis, Insights and Forecast, 2019-2031
- 6.1. Market Analysis, Insights and Forecast - by Product
- 6.1.1. Upper Arm Monitors
- 6.1.2. Wrist Monitors
- 6.1.3. Accessories
- 6.2. Market Analysis, Insights and Forecast - by Distribution Channel
- 6.2.1. Hospital Pharmacies
- 6.2.2. Online Pharmacies
- 6.2.3. Other Distribution Channels
- 6.1. Market Analysis, Insights and Forecast - by Product
- 7. Europe Home Blood Pressure Monitoring Devices Market Analysis, Insights and Forecast, 2019-2031
- 7.1. Market Analysis, Insights and Forecast - by Product
- 7.1.1. Upper Arm Monitors
- 7.1.2. Wrist Monitors
- 7.1.3. Accessories
- 7.2. Market Analysis, Insights and Forecast - by Distribution Channel
- 7.2.1. Hospital Pharmacies
- 7.2.2. Online Pharmacies
- 7.2.3. Other Distribution Channels
- 7.1. Market Analysis, Insights and Forecast - by Product
- 8. Asia Pacific Home Blood Pressure Monitoring Devices Market Analysis, Insights and Forecast, 2019-2031
- 8.1. Market Analysis, Insights and Forecast - by Product
- 8.1.1. Upper Arm Monitors
- 8.1.2. Wrist Monitors
- 8.1.3. Accessories
- 8.2. Market Analysis, Insights and Forecast - by Distribution Channel
- 8.2.1. Hospital Pharmacies
- 8.2.2. Online Pharmacies
- 8.2.3. Other Distribution Channels
- 8.1. Market Analysis, Insights and Forecast - by Product
- 9. Middle East and Africa Home Blood Pressure Monitoring Devices Market Analysis, Insights and Forecast, 2019-2031
- 9.1. Market Analysis, Insights and Forecast - by Product
- 9.1.1. Upper Arm Monitors
- 9.1.2. Wrist Monitors
- 9.1.3. Accessories
- 9.2. Market Analysis, Insights and Forecast - by Distribution Channel
- 9.2.1. Hospital Pharmacies
- 9.2.2. Online Pharmacies
- 9.2.3. Other Distribution Channels
- 9.1. Market Analysis, Insights and Forecast - by Product
- 10. South America Home Blood Pressure Monitoring Devices Market Analysis, Insights and Forecast, 2019-2031
- 10.1. Market Analysis, Insights and Forecast - by Product
- 10.1.1. Upper Arm Monitors
- 10.1.2. Wrist Monitors
- 10.1.3. Accessories
- 10.2. Market Analysis, Insights and Forecast - by Distribution Channel
- 10.2.1. Hospital Pharmacies
- 10.2.2. Online Pharmacies
- 10.2.3. Other Distribution Channels
- 10.1. Market Analysis, Insights and Forecast - by Product
- 11. North America Home Blood Pressure Monitoring Devices Market Analysis, Insights and Forecast, 2019-2031
- 11.1. Market Analysis, Insights and Forecast - By Country/Sub-region
- 11.1.1 United States
- 11.1.2 Canada
- 11.1.3 Mexico
- 12. Europe Home Blood Pressure Monitoring Devices Market Analysis, Insights and Forecast, 2019-2031
- 12.1. Market Analysis, Insights and Forecast - By Country/Sub-region
- 12.1.1 Germany
- 12.1.2 United Kingdom
- 12.1.3 France
- 12.1.4 Italy
- 12.1.5 Spain
- 12.1.6 Rest of Europe
- 13. Asia Pacific Home Blood Pressure Monitoring Devices Market Analysis, Insights and Forecast, 2019-2031
- 13.1. Market Analysis, Insights and Forecast - By Country/Sub-region
- 13.1.1 China
- 13.1.2 Japan
- 13.1.3 India
- 13.1.4 Australia
- 13.1.5 South Korea
- 13.1.6 Rest of Asia Pacific
- 14. Middle East and Africa Home Blood Pressure Monitoring Devices Market Analysis, Insights and Forecast, 2019-2031
- 14.1. Market Analysis, Insights and Forecast - By Country/Sub-region
- 14.1.1 GCC
- 14.1.2 South Africa
- 14.1.3 Rest of Middle East and Africa
- 15. South America Home Blood Pressure Monitoring Devices Market Analysis, Insights and Forecast, 2019-2031
- 15.1. Market Analysis, Insights and Forecast - By Country/Sub-region
- 15.1.1 Brazil
- 15.1.2 Argentina
- 15.1.3 Rest of South America
- 16. Competitive Analysis
- 16.1. Global Market Share Analysis 2024
- 16.2. Company Profiles
- 16.2.1 Rossmax International Ltd
- 16.2.1.1. Overview
- 16.2.1.2. Products
- 16.2.1.3. SWOT Analysis
- 16.2.1.4. Recent Developments
- 16.2.1.5. Financials (Based on Availability)
- 16.2.2 Qardio Inc
- 16.2.2.1. Overview
- 16.2.2.2. Products
- 16.2.2.3. SWOT Analysis
- 16.2.2.4. Recent Developments
- 16.2.2.5. Financials (Based on Availability)
- 16.2.3 GE Healthcare
- 16.2.3.1. Overview
- 16.2.3.2. Products
- 16.2.3.3. SWOT Analysis
- 16.2.3.4. Recent Developments
- 16.2.3.5. Financials (Based on Availability)
- 16.2.4 Halma plc
- 16.2.4.1. Overview
- 16.2.4.2. Products
- 16.2.4.3. SWOT Analysis
- 16.2.4.4. Recent Developments
- 16.2.4.5. Financials (Based on Availability)
- 16.2.5 Koninklijke Philips N V
- 16.2.5.1. Overview
- 16.2.5.2. Products
- 16.2.5.3. SWOT Analysis
- 16.2.5.4. Recent Developments
- 16.2.5.5. Financials (Based on Availability)
- 16.2.6 Spengler SAS
- 16.2.6.1. Overview
- 16.2.6.2. Products
- 16.2.6.3. SWOT Analysis
- 16.2.6.4. Recent Developments
- 16.2.6.5. Financials (Based on Availability)
- 16.2.7 A&D Medical
- 16.2.7.1. Overview
- 16.2.7.2. Products
- 16.2.7.3. SWOT Analysis
- 16.2.7.4. Recent Developments
- 16.2.7.5. Financials (Based on Availability)
- 16.2.8 Contec Medical
- 16.2.8.1. Overview
- 16.2.8.2. Products
- 16.2.8.3. SWOT Analysis
- 16.2.8.4. Recent Developments
- 16.2.8.5. Financials (Based on Availability)
- 16.2.9 Omron Healthcare Inc
- 16.2.9.1. Overview
- 16.2.9.2. Products
- 16.2.9.3. SWOT Analysis
- 16.2.9.4. Recent Developments
- 16.2.9.5. Financials (Based on Availability)
- 16.2.10 Welch Allyn Inc
- 16.2.10.1. Overview
- 16.2.10.2. Products
- 16.2.10.3. SWOT Analysis
- 16.2.10.4. Recent Developments
- 16.2.10.5. Financials (Based on Availability)
- 16.2.11 Beurer GmbH
- 16.2.11.1. Overview
- 16.2.11.2. Products
- 16.2.11.3. SWOT Analysis
- 16.2.11.4. Recent Developments
- 16.2.11.5. Financials (Based on Availability)
- 16.2.12 American Diagnostic Corporation
- 16.2.12.1. Overview
- 16.2.12.2. Products
- 16.2.12.3. SWOT Analysis
- 16.2.12.4. Recent Developments
- 16.2.12.5. Financials (Based on Availability)
- 16.2.1 Rossmax International Ltd
List of Figures
- Figure 1: Global Home Blood Pressure Monitoring Devices Market Revenue Breakdown (Million, %) by Region 2024 & 2032
- Figure 2: Global Home Blood Pressure Monitoring Devices Market Volume Breakdown (K Unit, %) by Region 2024 & 2032
- Figure 3: North America Home Blood Pressure Monitoring Devices Market Revenue (Million), by Country 2024 & 2032
- Figure 4: North America Home Blood Pressure Monitoring Devices Market Volume (K Unit), by Country 2024 & 2032
- Figure 5: North America Home Blood Pressure Monitoring Devices Market Revenue Share (%), by Country 2024 & 2032
- Figure 6: North America Home Blood Pressure Monitoring Devices Market Volume Share (%), by Country 2024 & 2032
- Figure 7: Europe Home Blood Pressure Monitoring Devices Market Revenue (Million), by Country 2024 & 2032
- Figure 8: Europe Home Blood Pressure Monitoring Devices Market Volume (K Unit), by Country 2024 & 2032
- Figure 9: Europe Home Blood Pressure Monitoring Devices Market Revenue Share (%), by Country 2024 & 2032
- Figure 10: Europe Home Blood Pressure Monitoring Devices Market Volume Share (%), by Country 2024 & 2032
- Figure 11: Asia Pacific Home Blood Pressure Monitoring Devices Market Revenue (Million), by Country 2024 & 2032
- Figure 12: Asia Pacific Home Blood Pressure Monitoring Devices Market Volume (K Unit), by Country 2024 & 2032
- Figure 13: Asia Pacific Home Blood Pressure Monitoring Devices Market Revenue Share (%), by Country 2024 & 2032
- Figure 14: Asia Pacific Home Blood Pressure Monitoring Devices Market Volume Share (%), by Country 2024 & 2032
- Figure 15: Middle East and Africa Home Blood Pressure Monitoring Devices Market Revenue (Million), by Country 2024 & 2032
- Figure 16: Middle East and Africa Home Blood Pressure Monitoring Devices Market Volume (K Unit), by Country 2024 & 2032
- Figure 17: Middle East and Africa Home Blood Pressure Monitoring Devices Market Revenue Share (%), by Country 2024 & 2032
- Figure 18: Middle East and Africa Home Blood Pressure Monitoring Devices Market Volume Share (%), by Country 2024 & 2032
- Figure 19: South America Home Blood Pressure Monitoring Devices Market Revenue (Million), by Country 2024 & 2032
- Figure 20: South America Home Blood Pressure Monitoring Devices Market Volume (K Unit), by Country 2024 & 2032
- Figure 21: South America Home Blood Pressure Monitoring Devices Market Revenue Share (%), by Country 2024 & 2032
- Figure 22: South America Home Blood Pressure Monitoring Devices Market Volume Share (%), by Country 2024 & 2032
- Figure 23: North America Home Blood Pressure Monitoring Devices Market Revenue (Million), by Product 2024 & 2032
- Figure 24: North America Home Blood Pressure Monitoring Devices Market Volume (K Unit), by Product 2024 & 2032
- Figure 25: North America Home Blood Pressure Monitoring Devices Market Revenue Share (%), by Product 2024 & 2032
- Figure 26: North America Home Blood Pressure Monitoring Devices Market Volume Share (%), by Product 2024 & 2032
- Figure 27: North America Home Blood Pressure Monitoring Devices Market Revenue (Million), by Distribution Channel 2024 & 2032
- Figure 28: North America Home Blood Pressure Monitoring Devices Market Volume (K Unit), by Distribution Channel 2024 & 2032
- Figure 29: North America Home Blood Pressure Monitoring Devices Market Revenue Share (%), by Distribution Channel 2024 & 2032
- Figure 30: North America Home Blood Pressure Monitoring Devices Market Volume Share (%), by Distribution Channel 2024 & 2032
- Figure 31: North America Home Blood Pressure Monitoring Devices Market Revenue (Million), by Country 2024 & 2032
- Figure 32: North America Home Blood Pressure Monitoring Devices Market Volume (K Unit), by Country 2024 & 2032
- Figure 33: North America Home Blood Pressure Monitoring Devices Market Revenue Share (%), by Country 2024 & 2032
- Figure 34: North America Home Blood Pressure Monitoring Devices Market Volume Share (%), by Country 2024 & 2032
- Figure 35: Europe Home Blood Pressure Monitoring Devices Market Revenue (Million), by Product 2024 & 2032
- Figure 36: Europe Home Blood Pressure Monitoring Devices Market Volume (K Unit), by Product 2024 & 2032
- Figure 37: Europe Home Blood Pressure Monitoring Devices Market Revenue Share (%), by Product 2024 & 2032
- Figure 38: Europe Home Blood Pressure Monitoring Devices Market Volume Share (%), by Product 2024 & 2032
- Figure 39: Europe Home Blood Pressure Monitoring Devices Market Revenue (Million), by Distribution Channel 2024 & 2032
- Figure 40: Europe Home Blood Pressure Monitoring Devices Market Volume (K Unit), by Distribution Channel 2024 & 2032
- Figure 41: Europe Home Blood Pressure Monitoring Devices Market Revenue Share (%), by Distribution Channel 2024 & 2032
- Figure 42: Europe Home Blood Pressure Monitoring Devices Market Volume Share (%), by Distribution Channel 2024 & 2032
- Figure 43: Europe Home Blood Pressure Monitoring Devices Market Revenue (Million), by Country 2024 & 2032
- Figure 44: Europe Home Blood Pressure Monitoring Devices Market Volume (K Unit), by Country 2024 & 2032
- Figure 45: Europe Home Blood Pressure Monitoring Devices Market Revenue Share (%), by Country 2024 & 2032
- Figure 46: Europe Home Blood Pressure Monitoring Devices Market Volume Share (%), by Country 2024 & 2032
- Figure 47: Asia Pacific Home Blood Pressure Monitoring Devices Market Revenue (Million), by Product 2024 & 2032
- Figure 48: Asia Pacific Home Blood Pressure Monitoring Devices Market Volume (K Unit), by Product 2024 & 2032
- Figure 49: Asia Pacific Home Blood Pressure Monitoring Devices Market Revenue Share (%), by Product 2024 & 2032
- Figure 50: Asia Pacific Home Blood Pressure Monitoring Devices Market Volume Share (%), by Product 2024 & 2032
- Figure 51: Asia Pacific Home Blood Pressure Monitoring Devices Market Revenue (Million), by Distribution Channel 2024 & 2032
- Figure 52: Asia Pacific Home Blood Pressure Monitoring Devices Market Volume (K Unit), by Distribution Channel 2024 & 2032
- Figure 53: Asia Pacific Home Blood Pressure Monitoring Devices Market Revenue Share (%), by Distribution Channel 2024 & 2032
- Figure 54: Asia Pacific Home Blood Pressure Monitoring Devices Market Volume Share (%), by Distribution Channel 2024 & 2032
- Figure 55: Asia Pacific Home Blood Pressure Monitoring Devices Market Revenue (Million), by Country 2024 & 2032
- Figure 56: Asia Pacific Home Blood Pressure Monitoring Devices Market Volume (K Unit), by Country 2024 & 2032
- Figure 57: Asia Pacific Home Blood Pressure Monitoring Devices Market Revenue Share (%), by Country 2024 & 2032
- Figure 58: Asia Pacific Home Blood Pressure Monitoring Devices Market Volume Share (%), by Country 2024 & 2032
- Figure 59: Middle East and Africa Home Blood Pressure Monitoring Devices Market Revenue (Million), by Product 2024 & 2032
- Figure 60: Middle East and Africa Home Blood Pressure Monitoring Devices Market Volume (K Unit), by Product 2024 & 2032
- Figure 61: Middle East and Africa Home Blood Pressure Monitoring Devices Market Revenue Share (%), by Product 2024 & 2032
- Figure 62: Middle East and Africa Home Blood Pressure Monitoring Devices Market Volume Share (%), by Product 2024 & 2032
- Figure 63: Middle East and Africa Home Blood Pressure Monitoring Devices Market Revenue (Million), by Distribution Channel 2024 & 2032
- Figure 64: Middle East and Africa Home Blood Pressure Monitoring Devices Market Volume (K Unit), by Distribution Channel 2024 & 2032
- Figure 65: Middle East and Africa Home Blood Pressure Monitoring Devices Market Revenue Share (%), by Distribution Channel 2024 & 2032
- Figure 66: Middle East and Africa Home Blood Pressure Monitoring Devices Market Volume Share (%), by Distribution Channel 2024 & 2032
- Figure 67: Middle East and Africa Home Blood Pressure Monitoring Devices Market Revenue (Million), by Country 2024 & 2032
- Figure 68: Middle East and Africa Home Blood Pressure Monitoring Devices Market Volume (K Unit), by Country 2024 & 2032
- Figure 69: Middle East and Africa Home Blood Pressure Monitoring Devices Market Revenue Share (%), by Country 2024 & 2032
- Figure 70: Middle East and Africa Home Blood Pressure Monitoring Devices Market Volume Share (%), by Country 2024 & 2032
- Figure 71: South America Home Blood Pressure Monitoring Devices Market Revenue (Million), by Product 2024 & 2032
- Figure 72: South America Home Blood Pressure Monitoring Devices Market Volume (K Unit), by Product 2024 & 2032
- Figure 73: South America Home Blood Pressure Monitoring Devices Market Revenue Share (%), by Product 2024 & 2032
- Figure 74: South America Home Blood Pressure Monitoring Devices Market Volume Share (%), by Product 2024 & 2032
- Figure 75: South America Home Blood Pressure Monitoring Devices Market Revenue (Million), by Distribution Channel 2024 & 2032
- Figure 76: South America Home Blood Pressure Monitoring Devices Market Volume (K Unit), by Distribution Channel 2024 & 2032
- Figure 77: South America Home Blood Pressure Monitoring Devices Market Revenue Share (%), by Distribution Channel 2024 & 2032
- Figure 78: South America Home Blood Pressure Monitoring Devices Market Volume Share (%), by Distribution Channel 2024 & 2032
- Figure 79: South America Home Blood Pressure Monitoring Devices Market Revenue (Million), by Country 2024 & 2032
- Figure 80: South America Home Blood Pressure Monitoring Devices Market Volume (K Unit), by Country 2024 & 2032
- Figure 81: South America Home Blood Pressure Monitoring Devices Market Revenue Share (%), by Country 2024 & 2032
- Figure 82: South America Home Blood Pressure Monitoring Devices Market Volume Share (%), by Country 2024 & 2032
List of Tables
- Table 1: Global Home Blood Pressure Monitoring Devices Market Revenue Million Forecast, by Region 2019 & 2032
- Table 2: Global Home Blood Pressure Monitoring Devices Market Volume K Unit Forecast, by Region 2019 & 2032
- Table 3: Global Home Blood Pressure Monitoring Devices Market Revenue Million Forecast, by Product 2019 & 2032
- Table 4: Global Home Blood Pressure Monitoring Devices Market Volume K Unit Forecast, by Product 2019 & 2032
- Table 5: Global Home Blood Pressure Monitoring Devices Market Revenue Million Forecast, by Distribution Channel 2019 & 2032
- Table 6: Global Home Blood Pressure Monitoring Devices Market Volume K Unit Forecast, by Distribution Channel 2019 & 2032
- Table 7: Global Home Blood Pressure Monitoring Devices Market Revenue Million Forecast, by Region 2019 & 2032
- Table 8: Global Home Blood Pressure Monitoring Devices Market Volume K Unit Forecast, by Region 2019 & 2032
- Table 9: Global Home Blood Pressure Monitoring Devices Market Revenue Million Forecast, by Country 2019 & 2032
- Table 10: Global Home Blood Pressure Monitoring Devices Market Volume K Unit Forecast, by Country 2019 & 2032
- Table 11: United States Home Blood Pressure Monitoring Devices Market Revenue (Million) Forecast, by Application 2019 & 2032
- Table 12: United States Home Blood Pressure Monitoring Devices Market Volume (K Unit) Forecast, by Application 2019 & 2032
- Table 13: Canada Home Blood Pressure Monitoring Devices Market Revenue (Million) Forecast, by Application 2019 & 2032
- Table 14: Canada Home Blood Pressure Monitoring Devices Market Volume (K Unit) Forecast, by Application 2019 & 2032
- Table 15: Mexico Home Blood Pressure Monitoring Devices Market Revenue (Million) Forecast, by Application 2019 & 2032
- Table 16: Mexico Home Blood Pressure Monitoring Devices Market Volume (K Unit) Forecast, by Application 2019 & 2032
- Table 17: Global Home Blood Pressure Monitoring Devices Market Revenue Million Forecast, by Country 2019 & 2032
- Table 18: Global Home Blood Pressure Monitoring Devices Market Volume K Unit Forecast, by Country 2019 & 2032
- Table 19: Germany Home Blood Pressure Monitoring Devices Market Revenue (Million) Forecast, by Application 2019 & 2032
- Table 20: Germany Home Blood Pressure Monitoring Devices Market Volume (K Unit) Forecast, by Application 2019 & 2032
- Table 21: United Kingdom Home Blood Pressure Monitoring Devices Market Revenue (Million) Forecast, by Application 2019 & 2032
- Table 22: United Kingdom Home Blood Pressure Monitoring Devices Market Volume (K Unit) Forecast, by Application 2019 & 2032
- Table 23: France Home Blood Pressure Monitoring Devices Market Revenue (Million) Forecast, by Application 2019 & 2032
- Table 24: France Home Blood Pressure Monitoring Devices Market Volume (K Unit) Forecast, by Application 2019 & 2032
- Table 25: Italy Home Blood Pressure Monitoring Devices Market Revenue (Million) Forecast, by Application 2019 & 2032
- Table 26: Italy Home Blood Pressure Monitoring Devices Market Volume (K Unit) Forecast, by Application 2019 & 2032
- Table 27: Spain Home Blood Pressure Monitoring Devices Market Revenue (Million) Forecast, by Application 2019 & 2032
- Table 28: Spain Home Blood Pressure Monitoring Devices Market Volume (K Unit) Forecast, by Application 2019 & 2032
- Table 29: Rest of Europe Home Blood Pressure Monitoring Devices Market Revenue (Million) Forecast, by Application 2019 & 2032
- Table 30: Rest of Europe Home Blood Pressure Monitoring Devices Market Volume (K Unit) Forecast, by Application 2019 & 2032
- Table 31: Global Home Blood Pressure Monitoring Devices Market Revenue Million Forecast, by Country 2019 & 2032
- Table 32: Global Home Blood Pressure Monitoring Devices Market Volume K Unit Forecast, by Country 2019 & 2032
- Table 33: China Home Blood Pressure Monitoring Devices Market Revenue (Million) Forecast, by Application 2019 & 2032
- Table 34: China Home Blood Pressure Monitoring Devices Market Volume (K Unit) Forecast, by Application 2019 & 2032
- Table 35: Japan Home Blood Pressure Monitoring Devices Market Revenue (Million) Forecast, by Application 2019 & 2032
- Table 36: Japan Home Blood Pressure Monitoring Devices Market Volume (K Unit) Forecast, by Application 2019 & 2032
- Table 37: India Home Blood Pressure Monitoring Devices Market Revenue (Million) Forecast, by Application 2019 & 2032
- Table 38: India Home Blood Pressure Monitoring Devices Market Volume (K Unit) Forecast, by Application 2019 & 2032
- Table 39: Australia Home Blood Pressure Monitoring Devices Market Revenue (Million) Forecast, by Application 2019 & 2032
- Table 40: Australia Home Blood Pressure Monitoring Devices Market Volume (K Unit) Forecast, by Application 2019 & 2032
- Table 41: South Korea Home Blood Pressure Monitoring Devices Market Revenue (Million) Forecast, by Application 2019 & 2032
- Table 42: South Korea Home Blood Pressure Monitoring Devices Market Volume (K Unit) Forecast, by Application 2019 & 2032
- Table 43: Rest of Asia Pacific Home Blood Pressure Monitoring Devices Market Revenue (Million) Forecast, by Application 2019 & 2032
- Table 44: Rest of Asia Pacific Home Blood Pressure Monitoring Devices Market Volume (K Unit) Forecast, by Application 2019 & 2032
- Table 45: Global Home Blood Pressure Monitoring Devices Market Revenue Million Forecast, by Country 2019 & 2032
- Table 46: Global Home Blood Pressure Monitoring Devices Market Volume K Unit Forecast, by Country 2019 & 2032
- Table 47: GCC Home Blood Pressure Monitoring Devices Market Revenue (Million) Forecast, by Application 2019 & 2032
- Table 48: GCC Home Blood Pressure Monitoring Devices Market Volume (K Unit) Forecast, by Application 2019 & 2032
- Table 49: South Africa Home Blood Pressure Monitoring Devices Market Revenue (Million) Forecast, by Application 2019 & 2032
- Table 50: South Africa Home Blood Pressure Monitoring Devices Market Volume (K Unit) Forecast, by Application 2019 & 2032
- Table 51: Rest of Middle East and Africa Home Blood Pressure Monitoring Devices Market Revenue (Million) Forecast, by Application 2019 & 2032
- Table 52: Rest of Middle East and Africa Home Blood Pressure Monitoring Devices Market Volume (K Unit) Forecast, by Application 2019 & 2032
- Table 53: Global Home Blood Pressure Monitoring Devices Market Revenue Million Forecast, by Country 2019 & 2032
- Table 54: Global Home Blood Pressure Monitoring Devices Market Volume K Unit Forecast, by Country 2019 & 2032
- Table 55: Brazil Home Blood Pressure Monitoring Devices Market Revenue (Million) Forecast, by Application 2019 & 2032
- Table 56: Brazil Home Blood Pressure Monitoring Devices Market Volume (K Unit) Forecast, by Application 2019 & 2032
- Table 57: Argentina Home Blood Pressure Monitoring Devices Market Revenue (Million) Forecast, by Application 2019 & 2032
- Table 58: Argentina Home Blood Pressure Monitoring Devices Market Volume (K Unit) Forecast, by Application 2019 & 2032
- Table 59: Rest of South America Home Blood Pressure Monitoring Devices Market Revenue (Million) Forecast, by Application 2019 & 2032
- Table 60: Rest of South America Home Blood Pressure Monitoring Devices Market Volume (K Unit) Forecast, by Application 2019 & 2032
- Table 61: Global Home Blood Pressure Monitoring Devices Market Revenue Million Forecast, by Product 2019 & 2032
- Table 62: Global Home Blood Pressure Monitoring Devices Market Volume K Unit Forecast, by Product 2019 & 2032
- Table 63: Global Home Blood Pressure Monitoring Devices Market Revenue Million Forecast, by Distribution Channel 2019 & 2032
- Table 64: Global Home Blood Pressure Monitoring Devices Market Volume K Unit Forecast, by Distribution Channel 2019 & 2032
- Table 65: Global Home Blood Pressure Monitoring Devices Market Revenue Million Forecast, by Country 2019 & 2032
- Table 66: Global Home Blood Pressure Monitoring Devices Market Volume K Unit Forecast, by Country 2019 & 2032
- Table 67: United States Home Blood Pressure Monitoring Devices Market Revenue (Million) Forecast, by Application 2019 & 2032
- Table 68: United States Home Blood Pressure Monitoring Devices Market Volume (K Unit) Forecast, by Application 2019 & 2032
- Table 69: Canada Home Blood Pressure Monitoring Devices Market Revenue (Million) Forecast, by Application 2019 & 2032
- Table 70: Canada Home Blood Pressure Monitoring Devices Market Volume (K Unit) Forecast, by Application 2019 & 2032
- Table 71: Mexico Home Blood Pressure Monitoring Devices Market Revenue (Million) Forecast, by Application 2019 & 2032
- Table 72: Mexico Home Blood Pressure Monitoring Devices Market Volume (K Unit) Forecast, by Application 2019 & 2032
- Table 73: Global Home Blood Pressure Monitoring Devices Market Revenue Million Forecast, by Product 2019 & 2032
- Table 74: Global Home Blood Pressure Monitoring Devices Market Volume K Unit Forecast, by Product 2019 & 2032
- Table 75: Global Home Blood Pressure Monitoring Devices Market Revenue Million Forecast, by Distribution Channel 2019 & 2032
- Table 76: Global Home Blood Pressure Monitoring Devices Market Volume K Unit Forecast, by Distribution Channel 2019 & 2032
- Table 77: Global Home Blood Pressure Monitoring Devices Market Revenue Million Forecast, by Country 2019 & 2032
- Table 78: Global Home Blood Pressure Monitoring Devices Market Volume K Unit Forecast, by Country 2019 & 2032
- Table 79: Germany Home Blood Pressure Monitoring Devices Market Revenue (Million) Forecast, by Application 2019 & 2032
- Table 80: Germany Home Blood Pressure Monitoring Devices Market Volume (K Unit) Forecast, by Application 2019 & 2032
- Table 81: United Kingdom Home Blood Pressure Monitoring Devices Market Revenue (Million) Forecast, by Application 2019 & 2032
- Table 82: United Kingdom Home Blood Pressure Monitoring Devices Market Volume (K Unit) Forecast, by Application 2019 & 2032
- Table 83: France Home Blood Pressure Monitoring Devices Market Revenue (Million) Forecast, by Application 2019 & 2032
- Table 84: France Home Blood Pressure Monitoring Devices Market Volume (K Unit) Forecast, by Application 2019 & 2032
- Table 85: Italy Home Blood Pressure Monitoring Devices Market Revenue (Million) Forecast, by Application 2019 & 2032
- Table 86: Italy Home Blood Pressure Monitoring Devices Market Volume (K Unit) Forecast, by Application 2019 & 2032
- Table 87: Spain Home Blood Pressure Monitoring Devices Market Revenue (Million) Forecast, by Application 2019 & 2032
- Table 88: Spain Home Blood Pressure Monitoring Devices Market Volume (K Unit) Forecast, by Application 2019 & 2032
- Table 89: Rest of Europe Home Blood Pressure Monitoring Devices Market Revenue (Million) Forecast, by Application 2019 & 2032
- Table 90: Rest of Europe Home Blood Pressure Monitoring Devices Market Volume (K Unit) Forecast, by Application 2019 & 2032
- Table 91: Global Home Blood Pressure Monitoring Devices Market Revenue Million Forecast, by Product 2019 & 2032
- Table 92: Global Home Blood Pressure Monitoring Devices Market Volume K Unit Forecast, by Product 2019 & 2032
- Table 93: Global Home Blood Pressure Monitoring Devices Market Revenue Million Forecast, by Distribution Channel 2019 & 2032
- Table 94: Global Home Blood Pressure Monitoring Devices Market Volume K Unit Forecast, by Distribution Channel 2019 & 2032
- Table 95: Global Home Blood Pressure Monitoring Devices Market Revenue Million Forecast, by Country 2019 & 2032
- Table 96: Global Home Blood Pressure Monitoring Devices Market Volume K Unit Forecast, by Country 2019 & 2032
- Table 97: China Home Blood Pressure Monitoring Devices Market Revenue (Million) Forecast, by Application 2019 & 2032
- Table 98: China Home Blood Pressure Monitoring Devices Market Volume (K Unit) Forecast, by Application 2019 & 2032
- Table 99: Japan Home Blood Pressure Monitoring Devices Market Revenue (Million) Forecast, by Application 2019 & 2032
- Table 100: Japan Home Blood Pressure Monitoring Devices Market Volume (K Unit) Forecast, by Application 2019 & 2032
- Table 101: India Home Blood Pressure Monitoring Devices Market Revenue (Million) Forecast, by Application 2019 & 2032
- Table 102: India Home Blood Pressure Monitoring Devices Market Volume (K Unit) Forecast, by Application 2019 & 2032
- Table 103: Australia Home Blood Pressure Monitoring Devices Market Revenue (Million) Forecast, by Application 2019 & 2032
- Table 104: Australia Home Blood Pressure Monitoring Devices Market Volume (K Unit) Forecast, by Application 2019 & 2032
- Table 105: South Korea Home Blood Pressure Monitoring Devices Market Revenue (Million) Forecast, by Application 2019 & 2032
- Table 106: South Korea Home Blood Pressure Monitoring Devices Market Volume (K Unit) Forecast, by Application 2019 & 2032
- Table 107: Rest of Asia Pacific Home Blood Pressure Monitoring Devices Market Revenue (Million) Forecast, by Application 2019 & 2032
- Table 108: Rest of Asia Pacific Home Blood Pressure Monitoring Devices Market Volume (K Unit) Forecast, by Application 2019 & 2032
- Table 109: Global Home Blood Pressure Monitoring Devices Market Revenue Million Forecast, by Product 2019 & 2032
- Table 110: Global Home Blood Pressure Monitoring Devices Market Volume K Unit Forecast, by Product 2019 & 2032
- Table 111: Global Home Blood Pressure Monitoring Devices Market Revenue Million Forecast, by Distribution Channel 2019 & 2032
- Table 112: Global Home Blood Pressure Monitoring Devices Market Volume K Unit Forecast, by Distribution Channel 2019 & 2032
- Table 113: Global Home Blood Pressure Monitoring Devices Market Revenue Million Forecast, by Country 2019 & 2032
- Table 114: Global Home Blood Pressure Monitoring Devices Market Volume K Unit Forecast, by Country 2019 & 2032
- Table 115: GCC Home Blood Pressure Monitoring Devices Market Revenue (Million) Forecast, by Application 2019 & 2032
- Table 116: GCC Home Blood Pressure Monitoring Devices Market Volume (K Unit) Forecast, by Application 2019 & 2032
- Table 117: South Africa Home Blood Pressure Monitoring Devices Market Revenue (Million) Forecast, by Application 2019 & 2032
- Table 118: South Africa Home Blood Pressure Monitoring Devices Market Volume (K Unit) Forecast, by Application 2019 & 2032
- Table 119: Rest of Middle East and Africa Home Blood Pressure Monitoring Devices Market Revenue (Million) Forecast, by Application 2019 & 2032
- Table 120: Rest of Middle East and Africa Home Blood Pressure Monitoring Devices Market Volume (K Unit) Forecast, by Application 2019 & 2032
- Table 121: Global Home Blood Pressure Monitoring Devices Market Revenue Million Forecast, by Product 2019 & 2032
- Table 122: Global Home Blood Pressure Monitoring Devices Market Volume K Unit Forecast, by Product 2019 & 2032
- Table 123: Global Home Blood Pressure Monitoring Devices Market Revenue Million Forecast, by Distribution Channel 2019 & 2032
- Table 124: Global Home Blood Pressure Monitoring Devices Market Volume K Unit Forecast, by Distribution Channel 2019 & 2032
- Table 125: Global Home Blood Pressure Monitoring Devices Market Revenue Million Forecast, by Country 2019 & 2032
- Table 126: Global Home Blood Pressure Monitoring Devices Market Volume K Unit Forecast, by Country 2019 & 2032
- Table 127: Brazil Home Blood Pressure Monitoring Devices Market Revenue (Million) Forecast, by Application 2019 & 2032
- Table 128: Brazil Home Blood Pressure Monitoring Devices Market Volume (K Unit) Forecast, by Application 2019 & 2032
- Table 129: Argentina Home Blood Pressure Monitoring Devices Market Revenue (Million) Forecast, by Application 2019 & 2032
- Table 130: Argentina Home Blood Pressure Monitoring Devices Market Volume (K Unit) Forecast, by Application 2019 & 2032
- Table 131: Rest of South America Home Blood Pressure Monitoring Devices Market Revenue (Million) Forecast, by Application 2019 & 2032
- Table 132: Rest of South America Home Blood Pressure Monitoring Devices Market Volume (K Unit) Forecast, by Application 2019 & 2032
Frequently Asked Questions
1. What is the projected Compound Annual Growth Rate (CAGR) of the Home Blood Pressure Monitoring Devices Market?
The projected CAGR is approximately 10.54%.
2. Which companies are prominent players in the Home Blood Pressure Monitoring Devices Market?
Key companies in the market include Rossmax International Ltd, Qardio Inc, GE Healthcare, Halma plc, Koninklijke Philips N V, Spengler SAS, A&D Medical, Contec Medical, Omron Healthcare Inc, Welch Allyn Inc, Beurer GmbH, American Diagnostic Corporation.
3. What are the main segments of the Home Blood Pressure Monitoring Devices Market?
The market segments include Product, Distribution Channel.
4. Can you provide details about the market size?
The market size is estimated to be USD 1.25 Million as of 2022.
5. What are some drivers contributing to market growth?
Growing Burden of Blood Pressure-Related Diseases; Rise in the Use of Home Blood Pressure Monitors and Active Promotions; Advancements in the Devices.
6. What are the notable trends driving market growth?
Wrist Monitors Segment is Dominating the Home Blood Pressure Monitoring Devices Market.
7. Are there any restraints impacting market growth?
High Cost and Accuracy of Devices.
8. Can you provide examples of recent developments in the market?
July 2022: LiveMetric launched LiveOne, a nano-sensor technology for monitoring blood pressure every 10 seconds. LiveOne is a wrist-worn, cuff-free solution that gives real-time measurements for better care and management of people with hypertension and cardiovascular disorders.
9. What pricing options are available for accessing the report?
Pricing options include single-user, multi-user, and enterprise licenses priced at USD 4750, USD 5250, and USD 8750 respectively.
10. Is the market size provided in terms of value or volume?
The market size is provided in terms of value, measured in Million and volume, measured in K Unit.
11. Are there any specific market keywords associated with the report?
Yes, the market keyword associated with the report is "Home Blood Pressure Monitoring Devices Market," which aids in identifying and referencing the specific market segment covered.
12. How do I determine which pricing option suits my needs best?
The pricing options vary based on user requirements and access needs. Individual users may opt for single-user licenses, while businesses requiring broader access may choose multi-user or enterprise licenses for cost-effective access to the report.
13. Are there any additional resources or data provided in the Home Blood Pressure Monitoring Devices Market report?
While the report offers comprehensive insights, it's advisable to review the specific contents or supplementary materials provided to ascertain if additional resources or data are available.
14. How can I stay updated on further developments or reports in the Home Blood Pressure Monitoring Devices Market?
To stay informed about further developments, trends, and reports in the Home Blood Pressure Monitoring Devices Market, consider subscribing to industry newsletters, following relevant companies and organizations, or regularly checking reputable industry news sources and publications.
Methodology
Step 1 - Identification of Relevant Samples Size from Population Database


Step 2 - Approaches for Defining Global Market Size (Value, Volume* & Price*)

Note*: In applicable scenarios
Step 3 - Data Sources
Primary Research
- Web Analytics
- Survey Reports
- Research Institute
- Latest Research Reports
- Opinion Leaders
Secondary Research
- Annual Reports
- White Paper
- Latest Press Release
- Industry Association
- Paid Database
- Investor Presentations

Step 4 - Data Triangulation
Involves using different sources of information in order to increase the validity of a study
These sources are likely to be stakeholders in a program - participants, other researchers, program staff, other community members, and so on.
Then we put all data in single framework & apply various statistical tools to find out the dynamic on the market.
During the analysis stage, feedback from the stakeholder groups would be compared to determine areas of agreement as well as areas of divergence
