

Key Insights
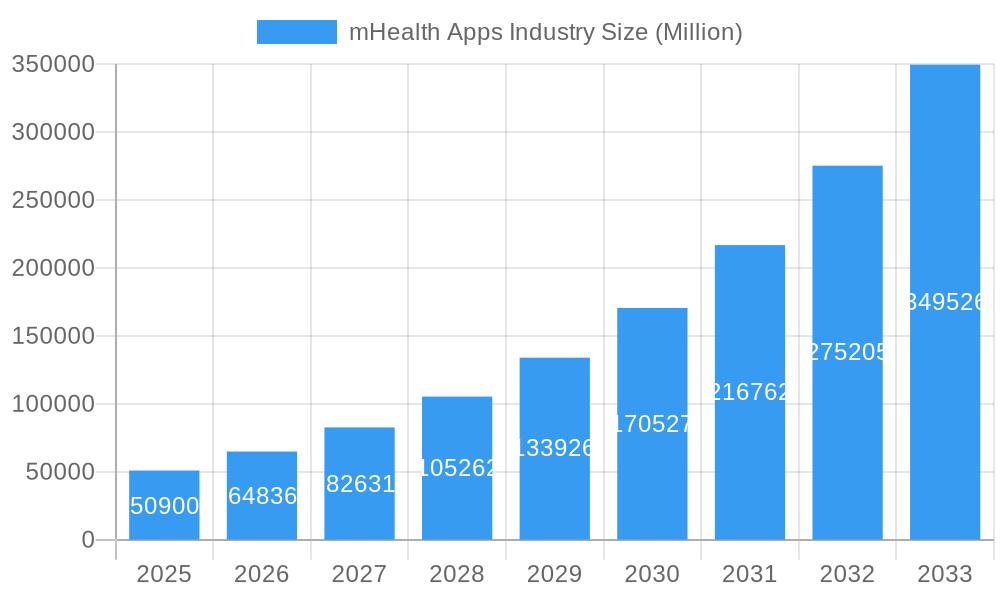
The mHealth app market, valued at $50.9 billion in 2025, is experiencing explosive growth, projected to expand at a compound annual growth rate (CAGR) of 27.30% from 2025 to 2033. This robust expansion is driven by several key factors. The increasing prevalence of chronic diseases necessitates remote patient monitoring and telehealth solutions, fueling demand for applications offering diagnostic services, treatment support, and remote consultations. Technological advancements, including the proliferation of smartphones and wearable sensors, have lowered barriers to entry and broadened accessibility for both providers and patients. Furthermore, supportive regulatory frameworks in many regions, alongside rising healthcare costs and a global shift toward value-based care, are contributing to the market's rapid ascent. The market is segmented across service types (monitoring, post-acute care, diagnostics, teleconsultation, etc.), stakeholders (healthcare providers, mobile operators, app developers), and device types (glucose monitors, cardiac monitors, etc.), offering various avenues for growth and investment. North America currently holds a significant market share due to advanced technology infrastructure and high healthcare expenditure, but rapid adoption in Asia-Pacific and other developing regions is poised to reshape the market landscape in the coming years.
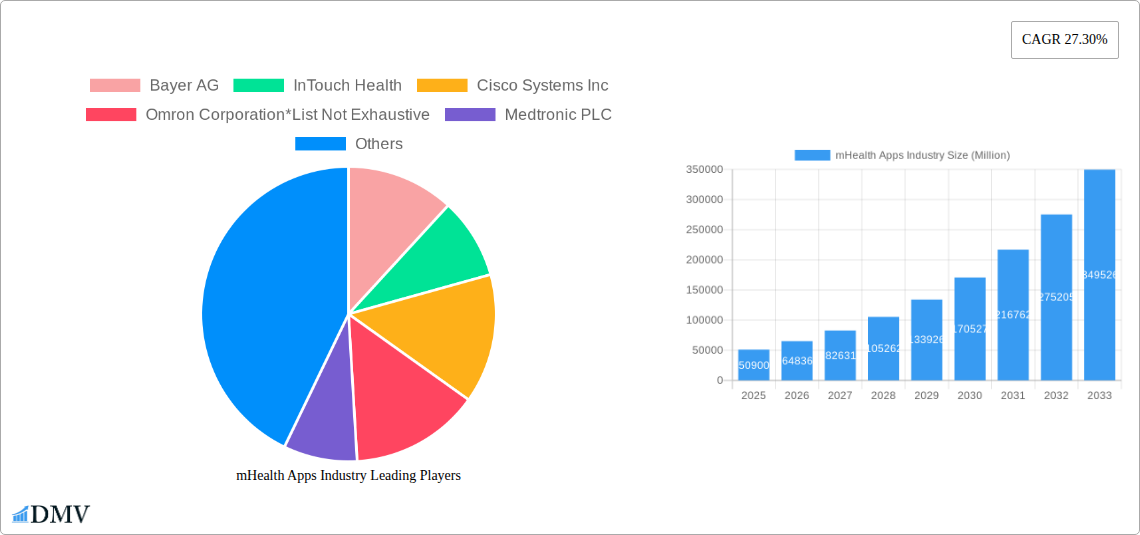
mHealth Apps Industry Market Size (In Billion)
The competitive landscape is populated by both established players like Johnson & Johnson, Medtronic, and Cisco, and emerging startups specializing in niche applications. These companies are focusing on developing innovative solutions, enhancing user experience, and forging strategic partnerships to maintain a competitive edge. While data security and privacy concerns pose a significant challenge, industry-wide efforts to comply with regulations and ensure patient data protection are mitigating this risk. The future of the mHealth app market is bright, with continued technological innovation, expanding service offerings, and increasing global adoption expected to drive substantial market expansion in the coming decade. The focus on personalized medicine and preventative healthcare will further accelerate growth, resulting in a market significantly larger than the initial projections suggest.
mHealth Apps Industry Company Market Share
mHealth Apps Industry: A Comprehensive Market Report (2019-2033)
This insightful report provides a detailed analysis of the mHealth apps industry, projecting a market valued at $XX Million by 2033. It offers a comprehensive overview of market dynamics, technological advancements, and future growth potential, empowering stakeholders to make informed decisions in this rapidly evolving sector. The study period covers 2019-2033, with 2025 serving as both the base and estimated year. The forecast period spans 2025-2033, and the historical period encompasses 2019-2024.
mHealth Apps Industry Market Composition & Trends
This section evaluates the mHealth apps market's competitive landscape, highlighting key trends shaping its evolution. We analyze market concentration, revealing the distribution of market share amongst leading players like Bayer AG, InTouch Health, Cisco Systems Inc, Omron Corporation, Medtronic PLC, Cerner Corporation, Koninklijke Philips NV, Johnson & Johnson, AT&T Inc, and Athenahealth Inc (list not exhaustive). The report delves into innovation catalysts, regulatory landscapes impacting app development and deployment, and the influence of substitute products. It profiles end-users, examining their adoption patterns and preferences, and analyzes M&A activity, including deal values and their impact on market consolidation.
- Market Share Distribution: A detailed breakdown of market share held by key players in 2025. XX% is projected for the top 5 players.
- M&A Deal Values: Analysis of significant mergers and acquisitions within the industry during the historical period, totaling an estimated $XX Million.
- Regulatory Landscape: Assessment of key regulatory frameworks influencing the mHealth app market across different regions, and their potential impact on future growth.
mHealth Apps Industry Industry Evolution
This section provides a comprehensive analysis of the mHealth apps industry's growth trajectory from 2019 to 2033. We examine technological advancements, such as the integration of AI and IoT, and their impact on market expansion. The evolving consumer demands, including the increasing preference for personalized healthcare solutions, are also explored. We will provide specific data points on the compound annual growth rate (CAGR) and adoption metrics across various segments. The influence of factors like rising smartphone penetration and increasing access to high-speed internet will be thoroughly discussed, projecting the mHealth app market's future value and potential.
Leading Regions, Countries, or Segments in mHealth Apps Industry
This section identifies the leading regions, countries, and segments within the mHealth apps industry. We analyze dominance factors within each category, including Service Type, Stakeholder, and Device Type. Key drivers, such as investment trends and regulatory support, are highlighted using bullet points for clarity.
Dominant Segments:
- Service Type: Teleconsultation is projected to be a leading segment, driven by increasing demand for remote healthcare services.
- Stakeholder: Healthcare providers are expected to be the dominant stakeholder due to the increasing adoption of mHealth apps for patient monitoring and management.
- Device Type: Remote Patient Monitoring (RPM) devices are projected to lead the market, fueled by the increasing demand for continuous health monitoring solutions.
Key Drivers:
- Increased Investments: Significant investments in R&D and infrastructure are accelerating the growth of this industry.
- Regulatory Support: Favorable regulatory frameworks in several countries are encouraging the adoption of mHealth apps.
- Technological Advancements: Innovations in areas such as AI and IoT are enabling the development of more sophisticated and user-friendly mHealth apps.
mHealth Apps Industry Product Innovations
Recent product innovations have focused on improving user experience, enhancing data security, and integrating AI for better diagnostic capabilities. These advancements include more intuitive interfaces, advanced data analytics features, and seamless integration with Electronic Health Records (EHR) systems. Unique selling propositions encompass personalized health recommendations and proactive health alerts based on individual patient data.
Propelling Factors for mHealth Apps Industry Growth
The mHealth apps industry's growth is fueled by several interconnected factors. Technological advancements, such as the development of sophisticated sensors and improved data analytics capabilities, have played a crucial role. Favorable economic conditions, particularly in developed nations with strong healthcare infrastructure, have facilitated wider adoption. Regulatory support and initiatives promoting telehealth have also contributed to the industry's expansion. For example, the increasing focus on preventative healthcare is driving demand for wellness and fitness applications.
Obstacles in the mHealth Apps Industry Market
The mHealth apps market faces several challenges. Stringent regulatory hurdles, including data privacy and security concerns, complicate market entry and expansion. Supply chain disruptions, particularly in the production of certain devices, can hamper growth. Intense competition from established players and emerging startups creates pressure on pricing and profitability. Data security breaches can lead to significant financial losses and reputational damage, impacting consumer confidence and market trust.
Future Opportunities in mHealth Apps Industry
The mHealth apps market presents significant opportunities. Expansion into emerging markets with growing smartphone penetration offers substantial potential. Technological advancements, such as the application of AI in diagnostics and personalized medicine, create new avenues for growth. The growing focus on chronic disease management presents a significant market for mHealth apps targeting specific health conditions.
Major Players in the mHealth Apps Industry Ecosystem
- Bayer AG
- InTouch Health
- Cisco Systems Inc
- Omron Corporation
- Medtronic PLC
- Cerner Corporation
- Koninklijke Philips NV
- Johnson & Johnson
- AT&T Inc
- Athenahealth Inc
Key Developments in mHealth Apps Industry Industry
- 2023: Launch of several new mHealth applications featuring AI-powered diagnostic capabilities.
- 2022: Significant investment in the development of remote patient monitoring devices.
- 2021: Several mergers and acquisitions consolidate the market.
Strategic mHealth Apps Industry Market Forecast
The mHealth apps industry is poised for continued growth, driven by technological innovation, increasing consumer demand for remote healthcare services, and supportive regulatory environments. The forecast period (2025-2033) promises significant market expansion, with opportunities across diverse segments. The integration of AI and IoT technologies is expected to further enhance the capabilities of mHealth apps and expand their applications. The future holds significant potential for this industry to reshape healthcare delivery.
mHealth Apps Industry Segmentation
-
1. Service Type
-
1.1. Monitoring Services
- 1.1.1. Independent Aging Solutions
- 1.1.2. Chronic Disease Management
- 1.1.3. Post-acute Care Services
-
1.2. Diagnostic Services
- 1.2.1. Self Diagnosis
- 1.2.2. Telemedicine Solutions
- 1.2.3. Medical
-
1.3. Treatment Services
- 1.3.1. Remote Patient Monitoring Services
- 1.3.2. Teleconsultation
- 1.4. Wellness and Fitness Solutions
- 1.5. Other Se
-
1.1. Monitoring Services
-
2. Device Type
- 2.1. Blood Glucose Monitors
- 2.2. Cardiac Monitors
- 2.3. Hemodynamic Monitors
- 2.4. Neurological Monitors
- 2.5. Respiratory Monitors
- 2.6. Body and Temperature Monitors
- 2.7. Remote Patient Monitoring Devices
- 2.8. Other Device Types
-
3. Stake Holder
- 3.1. Mobile Operators
- 3.2. Healthcare Providers
- 3.3. Application/Content Players
- 3.4. Other Stake Holders
mHealth Apps Industry Segmentation By Geography
-
1. North America
- 1.1. United States
- 1.2. Canada
- 1.3. Mexico
-
2. South America
- 2.1. Brazil
- 2.2. Argentina
- 2.3. Rest of South America
-
3. Europe
- 3.1. United Kingdom
- 3.2. Germany
- 3.3. France
- 3.4. Italy
- 3.5. Spain
- 3.6. Russia
- 3.7. Benelux
- 3.8. Nordics
- 3.9. Rest of Europe
-
4. Middle East & Africa
- 4.1. Turkey
- 4.2. Israel
- 4.3. GCC
- 4.4. North Africa
- 4.5. South Africa
- 4.6. Rest of Middle East & Africa
-
5. Asia Pacific
- 5.1. China
- 5.2. India
- 5.3. Japan
- 5.4. South Korea
- 5.5. ASEAN
- 5.6. Oceania
- 5.7. Rest of Asia Pacific
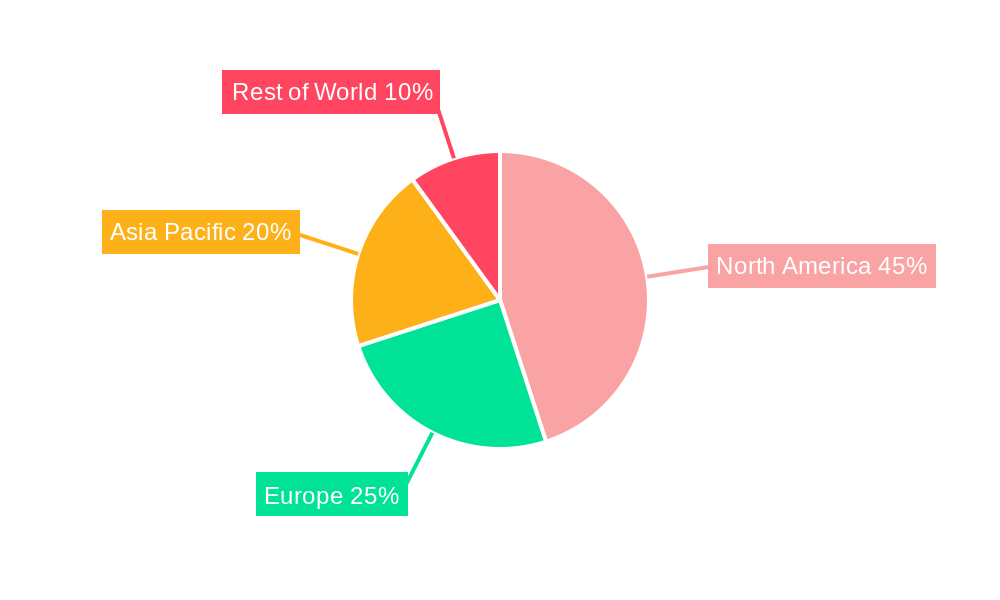
mHealth Apps Industry Regional Market Share
Geographic Coverage of mHealth Apps Industry
mHealth Apps Industry REPORT HIGHLIGHTS
| Aspects | Details |
|---|---|
| Study Period | 2020-2034 |
| Base Year | 2025 |
| Estimated Year | 2026 |
| Forecast Period | 2026-2034 |
| Historical Period | 2020-2025 |
| Growth Rate | CAGR of 27.30% from 2020-2034 |
| Segmentation |
|
Table of Contents
- 1. Introduction
- 1.1. Research Scope
- 1.2. Market Segmentation
- 1.3. Research Objective
- 1.4. Definitions and Assumptions
- 2. Executive Summary
- 2.1. Market Snapshot
- 3. Market Dynamics
- 3.1. Market Drivers
- 3.2. Market Restrains
- 3.3. Market Trends
- 3.4. Market Opportunities
- 4. Market Factor Analysis
- 4.1. Porters Five Forces
- 4.1.1. Bargaining Power of Suppliers
- 4.1.2. Bargaining Power of Buyers
- 4.1.3. Threat of New Entrants
- 4.1.4. Threat of Substitutes
- 4.1.5. Competitive Rivalry
- 4.2. PESTEL analysis
- 4.3. BCG Analysis
- 4.3.1. Stars (High Growth, High Market Share)
- 4.3.2. Cash Cows (Low Growth, High Market Share)
- 4.3.3. Question Mark (High Growth, Low Market Share)
- 4.3.4. Dogs (Low Growth, Low Market Share)
- 4.4. Ansoff Matrix Analysis
- 4.5. Supply Chain Analysis
- 4.6. Regulatory Landscape
- 4.7. Current Market Potential and Opportunity Assessment (TAM–SAM–SOM Framework)
- 4.8. DMV Analyst Note
- 4.1. Porters Five Forces
- 5. Market Analysis, Insights and Forecast 2021-2033
- 5.1. Market Analysis, Insights and Forecast - by Service Type
- 5.1.1. Monitoring Services
- 5.1.1.1. Independent Aging Solutions
- 5.1.1.2. Chronic Disease Management
- 5.1.1.3. Post-acute Care Services
- 5.1.2. Diagnostic Services
- 5.1.2.1. Self Diagnosis
- 5.1.2.2. Telemedicine Solutions
- 5.1.2.3. Medical
- 5.1.3. Treatment Services
- 5.1.3.1. Remote Patient Monitoring Services
- 5.1.3.2. Teleconsultation
- 5.1.4. Wellness and Fitness Solutions
- 5.1.5. Other Se
- 5.1.1. Monitoring Services
- 5.2. Market Analysis, Insights and Forecast - by Device Type
- 5.2.1. Blood Glucose Monitors
- 5.2.2. Cardiac Monitors
- 5.2.3. Hemodynamic Monitors
- 5.2.4. Neurological Monitors
- 5.2.5. Respiratory Monitors
- 5.2.6. Body and Temperature Monitors
- 5.2.7. Remote Patient Monitoring Devices
- 5.2.8. Other Device Types
- 5.3. Market Analysis, Insights and Forecast - by Stake Holder
- 5.3.1. Mobile Operators
- 5.3.2. Healthcare Providers
- 5.3.3. Application/Content Players
- 5.3.4. Other Stake Holders
- 5.4. Market Analysis, Insights and Forecast - by Region
- 5.4.1. North America
- 5.4.2. South America
- 5.4.3. Europe
- 5.4.4. Middle East & Africa
- 5.4.5. Asia Pacific
- 5.1. Market Analysis, Insights and Forecast - by Service Type
- 6. Global mHealth Apps Industry Analysis, Insights and Forecast, 2021-2033
- 6.1. Market Analysis, Insights and Forecast - by Service Type
- 6.1.1. Monitoring Services
- 6.1.1.1. Independent Aging Solutions
- 6.1.1.2. Chronic Disease Management
- 6.1.1.3. Post-acute Care Services
- 6.1.2. Diagnostic Services
- 6.1.2.1. Self Diagnosis
- 6.1.2.2. Telemedicine Solutions
- 6.1.2.3. Medical
- 6.1.3. Treatment Services
- 6.1.3.1. Remote Patient Monitoring Services
- 6.1.3.2. Teleconsultation
- 6.1.4. Wellness and Fitness Solutions
- 6.1.5. Other Se
- 6.1.1. Monitoring Services
- 6.2. Market Analysis, Insights and Forecast - by Device Type
- 6.2.1. Blood Glucose Monitors
- 6.2.2. Cardiac Monitors
- 6.2.3. Hemodynamic Monitors
- 6.2.4. Neurological Monitors
- 6.2.5. Respiratory Monitors
- 6.2.6. Body and Temperature Monitors
- 6.2.7. Remote Patient Monitoring Devices
- 6.2.8. Other Device Types
- 6.3. Market Analysis, Insights and Forecast - by Stake Holder
- 6.3.1. Mobile Operators
- 6.3.2. Healthcare Providers
- 6.3.3. Application/Content Players
- 6.3.4. Other Stake Holders
- 6.1. Market Analysis, Insights and Forecast - by Service Type
- 7. North America mHealth Apps Industry Analysis, Insights and Forecast, 2020-2032
- 7.1. Market Analysis, Insights and Forecast - by Service Type
- 7.1.1. Monitoring Services
- 7.1.1.1. Independent Aging Solutions
- 7.1.1.2. Chronic Disease Management
- 7.1.1.3. Post-acute Care Services
- 7.1.2. Diagnostic Services
- 7.1.2.1. Self Diagnosis
- 7.1.2.2. Telemedicine Solutions
- 7.1.2.3. Medical
- 7.1.3. Treatment Services
- 7.1.3.1. Remote Patient Monitoring Services
- 7.1.3.2. Teleconsultation
- 7.1.4. Wellness and Fitness Solutions
- 7.1.5. Other Se
- 7.1.1. Monitoring Services
- 7.2. Market Analysis, Insights and Forecast - by Device Type
- 7.2.1. Blood Glucose Monitors
- 7.2.2. Cardiac Monitors
- 7.2.3. Hemodynamic Monitors
- 7.2.4. Neurological Monitors
- 7.2.5. Respiratory Monitors
- 7.2.6. Body and Temperature Monitors
- 7.2.7. Remote Patient Monitoring Devices
- 7.2.8. Other Device Types
- 7.3. Market Analysis, Insights and Forecast - by Stake Holder
- 7.3.1. Mobile Operators
- 7.3.2. Healthcare Providers
- 7.3.3. Application/Content Players
- 7.3.4. Other Stake Holders
- 7.1. Market Analysis, Insights and Forecast - by Service Type
- 8. South America mHealth Apps Industry Analysis, Insights and Forecast, 2020-2032
- 8.1. Market Analysis, Insights and Forecast - by Service Type
- 8.1.1. Monitoring Services
- 8.1.1.1. Independent Aging Solutions
- 8.1.1.2. Chronic Disease Management
- 8.1.1.3. Post-acute Care Services
- 8.1.2. Diagnostic Services
- 8.1.2.1. Self Diagnosis
- 8.1.2.2. Telemedicine Solutions
- 8.1.2.3. Medical
- 8.1.3. Treatment Services
- 8.1.3.1. Remote Patient Monitoring Services
- 8.1.3.2. Teleconsultation
- 8.1.4. Wellness and Fitness Solutions
- 8.1.5. Other Se
- 8.1.1. Monitoring Services
- 8.2. Market Analysis, Insights and Forecast - by Device Type
- 8.2.1. Blood Glucose Monitors
- 8.2.2. Cardiac Monitors
- 8.2.3. Hemodynamic Monitors
- 8.2.4. Neurological Monitors
- 8.2.5. Respiratory Monitors
- 8.2.6. Body and Temperature Monitors
- 8.2.7. Remote Patient Monitoring Devices
- 8.2.8. Other Device Types
- 8.3. Market Analysis, Insights and Forecast - by Stake Holder
- 8.3.1. Mobile Operators
- 8.3.2. Healthcare Providers
- 8.3.3. Application/Content Players
- 8.3.4. Other Stake Holders
- 8.1. Market Analysis, Insights and Forecast - by Service Type
- 9. Europe mHealth Apps Industry Analysis, Insights and Forecast, 2020-2032
- 9.1. Market Analysis, Insights and Forecast - by Service Type
- 9.1.1. Monitoring Services
- 9.1.1.1. Independent Aging Solutions
- 9.1.1.2. Chronic Disease Management
- 9.1.1.3. Post-acute Care Services
- 9.1.2. Diagnostic Services
- 9.1.2.1. Self Diagnosis
- 9.1.2.2. Telemedicine Solutions
- 9.1.2.3. Medical
- 9.1.3. Treatment Services
- 9.1.3.1. Remote Patient Monitoring Services
- 9.1.3.2. Teleconsultation
- 9.1.4. Wellness and Fitness Solutions
- 9.1.5. Other Se
- 9.1.1. Monitoring Services
- 9.2. Market Analysis, Insights and Forecast - by Device Type
- 9.2.1. Blood Glucose Monitors
- 9.2.2. Cardiac Monitors
- 9.2.3. Hemodynamic Monitors
- 9.2.4. Neurological Monitors
- 9.2.5. Respiratory Monitors
- 9.2.6. Body and Temperature Monitors
- 9.2.7. Remote Patient Monitoring Devices
- 9.2.8. Other Device Types
- 9.3. Market Analysis, Insights and Forecast - by Stake Holder
- 9.3.1. Mobile Operators
- 9.3.2. Healthcare Providers
- 9.3.3. Application/Content Players
- 9.3.4. Other Stake Holders
- 9.1. Market Analysis, Insights and Forecast - by Service Type
- 10. Middle East & Africa mHealth Apps Industry Analysis, Insights and Forecast, 2020-2032
- 10.1. Market Analysis, Insights and Forecast - by Service Type
- 10.1.1. Monitoring Services
- 10.1.1.1. Independent Aging Solutions
- 10.1.1.2. Chronic Disease Management
- 10.1.1.3. Post-acute Care Services
- 10.1.2. Diagnostic Services
- 10.1.2.1. Self Diagnosis
- 10.1.2.2. Telemedicine Solutions
- 10.1.2.3. Medical
- 10.1.3. Treatment Services
- 10.1.3.1. Remote Patient Monitoring Services
- 10.1.3.2. Teleconsultation
- 10.1.4. Wellness and Fitness Solutions
- 10.1.5. Other Se
- 10.1.1. Monitoring Services
- 10.2. Market Analysis, Insights and Forecast - by Device Type
- 10.2.1. Blood Glucose Monitors
- 10.2.2. Cardiac Monitors
- 10.2.3. Hemodynamic Monitors
- 10.2.4. Neurological Monitors
- 10.2.5. Respiratory Monitors
- 10.2.6. Body and Temperature Monitors
- 10.2.7. Remote Patient Monitoring Devices
- 10.2.8. Other Device Types
- 10.3. Market Analysis, Insights and Forecast - by Stake Holder
- 10.3.1. Mobile Operators
- 10.3.2. Healthcare Providers
- 10.3.3. Application/Content Players
- 10.3.4. Other Stake Holders
- 10.1. Market Analysis, Insights and Forecast - by Service Type
- 11. Asia Pacific mHealth Apps Industry Analysis, Insights and Forecast, 2020-2032
- 11.1. Market Analysis, Insights and Forecast - by Service Type
- 11.1.1. Monitoring Services
- 11.1.1.1. Independent Aging Solutions
- 11.1.1.2. Chronic Disease Management
- 11.1.1.3. Post-acute Care Services
- 11.1.2. Diagnostic Services
- 11.1.2.1. Self Diagnosis
- 11.1.2.2. Telemedicine Solutions
- 11.1.2.3. Medical
- 11.1.3. Treatment Services
- 11.1.3.1. Remote Patient Monitoring Services
- 11.1.3.2. Teleconsultation
- 11.1.4. Wellness and Fitness Solutions
- 11.1.5. Other Se
- 11.1.1. Monitoring Services
- 11.2. Market Analysis, Insights and Forecast - by Device Type
- 11.2.1. Blood Glucose Monitors
- 11.2.2. Cardiac Monitors
- 11.2.3. Hemodynamic Monitors
- 11.2.4. Neurological Monitors
- 11.2.5. Respiratory Monitors
- 11.2.6. Body and Temperature Monitors
- 11.2.7. Remote Patient Monitoring Devices
- 11.2.8. Other Device Types
- 11.3. Market Analysis, Insights and Forecast - by Stake Holder
- 11.3.1. Mobile Operators
- 11.3.2. Healthcare Providers
- 11.3.3. Application/Content Players
- 11.3.4. Other Stake Holders
- 11.1. Market Analysis, Insights and Forecast - by Service Type
- 12. Competitive Analysis
- 12.1. Company Profiles
- 12.1.1 Bayer AG
- 12.1.1.1. Company Overview
- 12.1.1.2. Products
- 12.1.1.3. Company Financials
- 12.1.1.4. SWOT Analysis
- 12.1.2 InTouch Health
- 12.1.2.1. Company Overview
- 12.1.2.2. Products
- 12.1.2.3. Company Financials
- 12.1.2.4. SWOT Analysis
- 12.1.3 Cisco Systems Inc
- 12.1.3.1. Company Overview
- 12.1.3.2. Products
- 12.1.3.3. Company Financials
- 12.1.3.4. SWOT Analysis
- 12.1.4 Omron Corporation*List Not Exhaustive
- 12.1.4.1. Company Overview
- 12.1.4.2. Products
- 12.1.4.3. Company Financials
- 12.1.4.4. SWOT Analysis
- 12.1.5 Medtronic PLC
- 12.1.5.1. Company Overview
- 12.1.5.2. Products
- 12.1.5.3. Company Financials
- 12.1.5.4. SWOT Analysis
- 12.1.6 Cerner Corporation
- 12.1.6.1. Company Overview
- 12.1.6.2. Products
- 12.1.6.3. Company Financials
- 12.1.6.4. SWOT Analysis
- 12.1.7 Koninklijke Philips NV
- 12.1.7.1. Company Overview
- 12.1.7.2. Products
- 12.1.7.3. Company Financials
- 12.1.7.4. SWOT Analysis
- 12.1.8 Johnson & Johnson
- 12.1.8.1. Company Overview
- 12.1.8.2. Products
- 12.1.8.3. Company Financials
- 12.1.8.4. SWOT Analysis
- 12.1.9 AT&T Inc
- 12.1.9.1. Company Overview
- 12.1.9.2. Products
- 12.1.9.3. Company Financials
- 12.1.9.4. SWOT Analysis
- 12.1.10 Athenahealth Inc
- 12.1.10.1. Company Overview
- 12.1.10.2. Products
- 12.1.10.3. Company Financials
- 12.1.10.4. SWOT Analysis
- 12.1.1 Bayer AG
- 12.2. Market Entropy
- 12.2.1 Company's Key Areas Served
- 12.2.2 Recent Developments
- 12.3. Company Market Share Analysis 2025
- 12.3.1 Top 5 Companies Market Share Analysis
- 12.3.2 Top 3 Companies Market Share Analysis
- 12.4. List of Potential Customers
- 13. Research Methodology
List of Figures
- Figure 1: Global mHealth Apps Industry Revenue Breakdown (Million, %) by Region 2025 & 2033
- Figure 2: North America mHealth Apps Industry Revenue (Million), by Service Type 2025 & 2033
- Figure 3: North America mHealth Apps Industry Revenue Share (%), by Service Type 2025 & 2033
- Figure 4: North America mHealth Apps Industry Revenue (Million), by Device Type 2025 & 2033
- Figure 5: North America mHealth Apps Industry Revenue Share (%), by Device Type 2025 & 2033
- Figure 6: North America mHealth Apps Industry Revenue (Million), by Stake Holder 2025 & 2033
- Figure 7: North America mHealth Apps Industry Revenue Share (%), by Stake Holder 2025 & 2033
- Figure 8: North America mHealth Apps Industry Revenue (Million), by Country 2025 & 2033
- Figure 9: North America mHealth Apps Industry Revenue Share (%), by Country 2025 & 2033
- Figure 10: South America mHealth Apps Industry Revenue (Million), by Service Type 2025 & 2033
- Figure 11: South America mHealth Apps Industry Revenue Share (%), by Service Type 2025 & 2033
- Figure 12: South America mHealth Apps Industry Revenue (Million), by Device Type 2025 & 2033
- Figure 13: South America mHealth Apps Industry Revenue Share (%), by Device Type 2025 & 2033
- Figure 14: South America mHealth Apps Industry Revenue (Million), by Stake Holder 2025 & 2033
- Figure 15: South America mHealth Apps Industry Revenue Share (%), by Stake Holder 2025 & 2033
- Figure 16: South America mHealth Apps Industry Revenue (Million), by Country 2025 & 2033
- Figure 17: South America mHealth Apps Industry Revenue Share (%), by Country 2025 & 2033
- Figure 18: Europe mHealth Apps Industry Revenue (Million), by Service Type 2025 & 2033
- Figure 19: Europe mHealth Apps Industry Revenue Share (%), by Service Type 2025 & 2033
- Figure 20: Europe mHealth Apps Industry Revenue (Million), by Device Type 2025 & 2033
- Figure 21: Europe mHealth Apps Industry Revenue Share (%), by Device Type 2025 & 2033
- Figure 22: Europe mHealth Apps Industry Revenue (Million), by Stake Holder 2025 & 2033
- Figure 23: Europe mHealth Apps Industry Revenue Share (%), by Stake Holder 2025 & 2033
- Figure 24: Europe mHealth Apps Industry Revenue (Million), by Country 2025 & 2033
- Figure 25: Europe mHealth Apps Industry Revenue Share (%), by Country 2025 & 2033
- Figure 26: Middle East & Africa mHealth Apps Industry Revenue (Million), by Service Type 2025 & 2033
- Figure 27: Middle East & Africa mHealth Apps Industry Revenue Share (%), by Service Type 2025 & 2033
- Figure 28: Middle East & Africa mHealth Apps Industry Revenue (Million), by Device Type 2025 & 2033
- Figure 29: Middle East & Africa mHealth Apps Industry Revenue Share (%), by Device Type 2025 & 2033
- Figure 30: Middle East & Africa mHealth Apps Industry Revenue (Million), by Stake Holder 2025 & 2033
- Figure 31: Middle East & Africa mHealth Apps Industry Revenue Share (%), by Stake Holder 2025 & 2033
- Figure 32: Middle East & Africa mHealth Apps Industry Revenue (Million), by Country 2025 & 2033
- Figure 33: Middle East & Africa mHealth Apps Industry Revenue Share (%), by Country 2025 & 2033
- Figure 34: Asia Pacific mHealth Apps Industry Revenue (Million), by Service Type 2025 & 2033
- Figure 35: Asia Pacific mHealth Apps Industry Revenue Share (%), by Service Type 2025 & 2033
- Figure 36: Asia Pacific mHealth Apps Industry Revenue (Million), by Device Type 2025 & 2033
- Figure 37: Asia Pacific mHealth Apps Industry Revenue Share (%), by Device Type 2025 & 2033
- Figure 38: Asia Pacific mHealth Apps Industry Revenue (Million), by Stake Holder 2025 & 2033
- Figure 39: Asia Pacific mHealth Apps Industry Revenue Share (%), by Stake Holder 2025 & 2033
- Figure 40: Asia Pacific mHealth Apps Industry Revenue (Million), by Country 2025 & 2033
- Figure 41: Asia Pacific mHealth Apps Industry Revenue Share (%), by Country 2025 & 2033
List of Tables
- Table 1: Global mHealth Apps Industry Revenue Million Forecast, by Service Type 2020 & 2033
- Table 2: Global mHealth Apps Industry Revenue Million Forecast, by Device Type 2020 & 2033
- Table 3: Global mHealth Apps Industry Revenue Million Forecast, by Stake Holder 2020 & 2033
- Table 4: Global mHealth Apps Industry Revenue Million Forecast, by Region 2020 & 2033
- Table 5: Global mHealth Apps Industry Revenue Million Forecast, by Service Type 2020 & 2033
- Table 6: Global mHealth Apps Industry Revenue Million Forecast, by Device Type 2020 & 2033
- Table 7: Global mHealth Apps Industry Revenue Million Forecast, by Stake Holder 2020 & 2033
- Table 8: Global mHealth Apps Industry Revenue Million Forecast, by Country 2020 & 2033
- Table 9: United States mHealth Apps Industry Revenue (Million) Forecast, by Application 2020 & 2033
- Table 10: Canada mHealth Apps Industry Revenue (Million) Forecast, by Application 2020 & 2033
- Table 11: Mexico mHealth Apps Industry Revenue (Million) Forecast, by Application 2020 & 2033
- Table 12: Global mHealth Apps Industry Revenue Million Forecast, by Service Type 2020 & 2033
- Table 13: Global mHealth Apps Industry Revenue Million Forecast, by Device Type 2020 & 2033
- Table 14: Global mHealth Apps Industry Revenue Million Forecast, by Stake Holder 2020 & 2033
- Table 15: Global mHealth Apps Industry Revenue Million Forecast, by Country 2020 & 2033
- Table 16: Brazil mHealth Apps Industry Revenue (Million) Forecast, by Application 2020 & 2033
- Table 17: Argentina mHealth Apps Industry Revenue (Million) Forecast, by Application 2020 & 2033
- Table 18: Rest of South America mHealth Apps Industry Revenue (Million) Forecast, by Application 2020 & 2033
- Table 19: Global mHealth Apps Industry Revenue Million Forecast, by Service Type 2020 & 2033
- Table 20: Global mHealth Apps Industry Revenue Million Forecast, by Device Type 2020 & 2033
- Table 21: Global mHealth Apps Industry Revenue Million Forecast, by Stake Holder 2020 & 2033
- Table 22: Global mHealth Apps Industry Revenue Million Forecast, by Country 2020 & 2033
- Table 23: United Kingdom mHealth Apps Industry Revenue (Million) Forecast, by Application 2020 & 2033
- Table 24: Germany mHealth Apps Industry Revenue (Million) Forecast, by Application 2020 & 2033
- Table 25: France mHealth Apps Industry Revenue (Million) Forecast, by Application 2020 & 2033
- Table 26: Italy mHealth Apps Industry Revenue (Million) Forecast, by Application 2020 & 2033
- Table 27: Spain mHealth Apps Industry Revenue (Million) Forecast, by Application 2020 & 2033
- Table 28: Russia mHealth Apps Industry Revenue (Million) Forecast, by Application 2020 & 2033
- Table 29: Benelux mHealth Apps Industry Revenue (Million) Forecast, by Application 2020 & 2033
- Table 30: Nordics mHealth Apps Industry Revenue (Million) Forecast, by Application 2020 & 2033
- Table 31: Rest of Europe mHealth Apps Industry Revenue (Million) Forecast, by Application 2020 & 2033
- Table 32: Global mHealth Apps Industry Revenue Million Forecast, by Service Type 2020 & 2033
- Table 33: Global mHealth Apps Industry Revenue Million Forecast, by Device Type 2020 & 2033
- Table 34: Global mHealth Apps Industry Revenue Million Forecast, by Stake Holder 2020 & 2033
- Table 35: Global mHealth Apps Industry Revenue Million Forecast, by Country 2020 & 2033
- Table 36: Turkey mHealth Apps Industry Revenue (Million) Forecast, by Application 2020 & 2033
- Table 37: Israel mHealth Apps Industry Revenue (Million) Forecast, by Application 2020 & 2033
- Table 38: GCC mHealth Apps Industry Revenue (Million) Forecast, by Application 2020 & 2033
- Table 39: North Africa mHealth Apps Industry Revenue (Million) Forecast, by Application 2020 & 2033
- Table 40: South Africa mHealth Apps Industry Revenue (Million) Forecast, by Application 2020 & 2033
- Table 41: Rest of Middle East & Africa mHealth Apps Industry Revenue (Million) Forecast, by Application 2020 & 2033
- Table 42: Global mHealth Apps Industry Revenue Million Forecast, by Service Type 2020 & 2033
- Table 43: Global mHealth Apps Industry Revenue Million Forecast, by Device Type 2020 & 2033
- Table 44: Global mHealth Apps Industry Revenue Million Forecast, by Stake Holder 2020 & 2033
- Table 45: Global mHealth Apps Industry Revenue Million Forecast, by Country 2020 & 2033
- Table 46: China mHealth Apps Industry Revenue (Million) Forecast, by Application 2020 & 2033
- Table 47: India mHealth Apps Industry Revenue (Million) Forecast, by Application 2020 & 2033
- Table 48: Japan mHealth Apps Industry Revenue (Million) Forecast, by Application 2020 & 2033
- Table 49: South Korea mHealth Apps Industry Revenue (Million) Forecast, by Application 2020 & 2033
- Table 50: ASEAN mHealth Apps Industry Revenue (Million) Forecast, by Application 2020 & 2033
- Table 51: Oceania mHealth Apps Industry Revenue (Million) Forecast, by Application 2020 & 2033
- Table 52: Rest of Asia Pacific mHealth Apps Industry Revenue (Million) Forecast, by Application 2020 & 2033
Frequently Asked Questions
1. What is the projected Compound Annual Growth Rate (CAGR) of the mHealth Apps Industry?
The projected CAGR is approximately 27.30%.
2. Which companies are prominent players in the mHealth Apps Industry?
Key companies in the market include Bayer AG, InTouch Health, Cisco Systems Inc, Omron Corporation*List Not Exhaustive, Medtronic PLC, Cerner Corporation, Koninklijke Philips NV, Johnson & Johnson, AT&T Inc, Athenahealth Inc.
3. What are the main segments of the mHealth Apps Industry?
The market segments include Service Type, Device Type, Stake Holder.
4. Can you provide details about the market size?
The market size is estimated to be USD 50.9 Million as of 2022.
5. What are some drivers contributing to market growth?
; Growing usage of Smartphones. Tablets. and Mobile Technology in Healthcare; Increasing Awareness of People for Chronic Diseases; Increasing Focus on Personalized Medicine and Patient-centered Approach; Increased Usage of Mobile Health App.
6. What are the notable trends driving market growth?
Remote Patient Monitoring Devices is the Leading Segment Under Devices Type that is Expected to Grow During the Forecast Period.
7. Are there any restraints impacting market growth?
; Data Insecurity; Provider Liability Concerns; Lower Adoption in Rural Areas.
8. Can you provide examples of recent developments in the market?
N/A
9. What pricing options are available for accessing the report?
Pricing options include single-user, multi-user, and enterprise licenses priced at USD 3800, USD 4500, and USD 5800 respectively.
10. Is the market size provided in terms of value or volume?
The market size is provided in terms of value, measured in Million.
11. Are there any specific market keywords associated with the report?
Yes, the market keyword associated with the report is "mHealth Apps Industry," which aids in identifying and referencing the specific market segment covered.
12. How do I determine which pricing option suits my needs best?
The pricing options vary based on user requirements and access needs. Individual users may opt for single-user licenses, while businesses requiring broader access may choose multi-user or enterprise licenses for cost-effective access to the report.
13. Are there any additional resources or data provided in the mHealth Apps Industry report?
While the report offers comprehensive insights, it's advisable to review the specific contents or supplementary materials provided to ascertain if additional resources or data are available.
14. How can I stay updated on further developments or reports in the mHealth Apps Industry?
To stay informed about further developments, trends, and reports in the mHealth Apps Industry, consider subscribing to industry newsletters, following relevant companies and organizations, or regularly checking reputable industry news sources and publications.
Methodology
Step 1 - Identification of Relevant Samples Size from Population Database


Step 2 - Approaches for Defining Global Market Size (Value, Volume* & Price*)

Note*: In applicable scenarios
Step 3 - Data Sources
Primary Research
- Web Analytics
- Survey Reports
- Research Institute
- Latest Research Reports
- Opinion Leaders
Secondary Research
- Annual Reports
- White Paper
- Latest Press Release
- Industry Association
- Paid Database
- Investor Presentations

Step 4 - Data Triangulation
Involves using different sources of information in order to increase the validity of a study
These sources are likely to be stakeholders in a program - participants, other researchers, program staff, other community members, and so on.
Then we put all data in single framework & apply various statistical tools to find out the dynamic on the market.
During the analysis stage, feedback from the stakeholder groups would be compared to determine areas of agreement as well as areas of divergence