

Key Insights
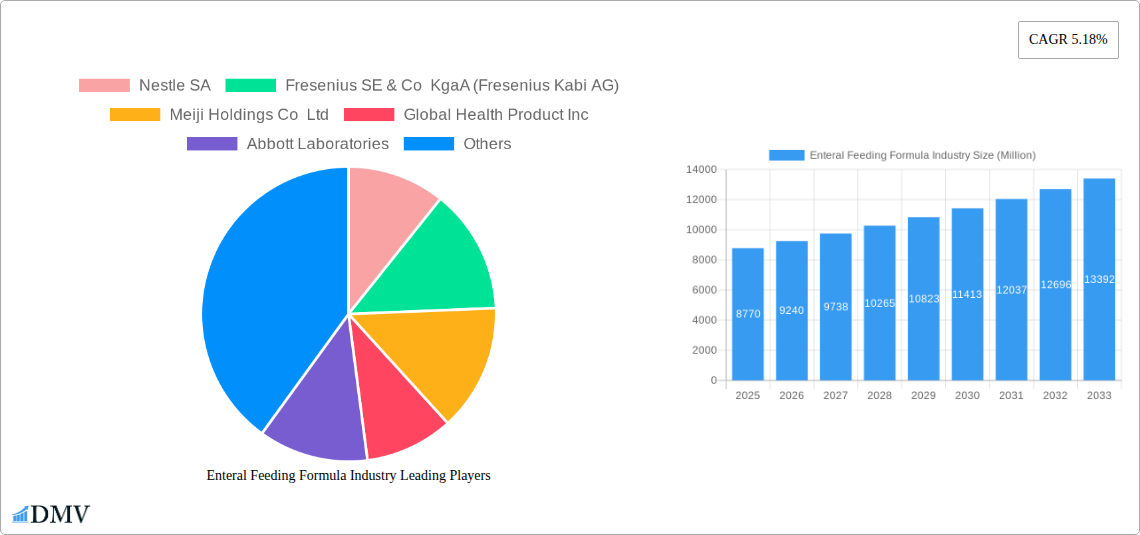
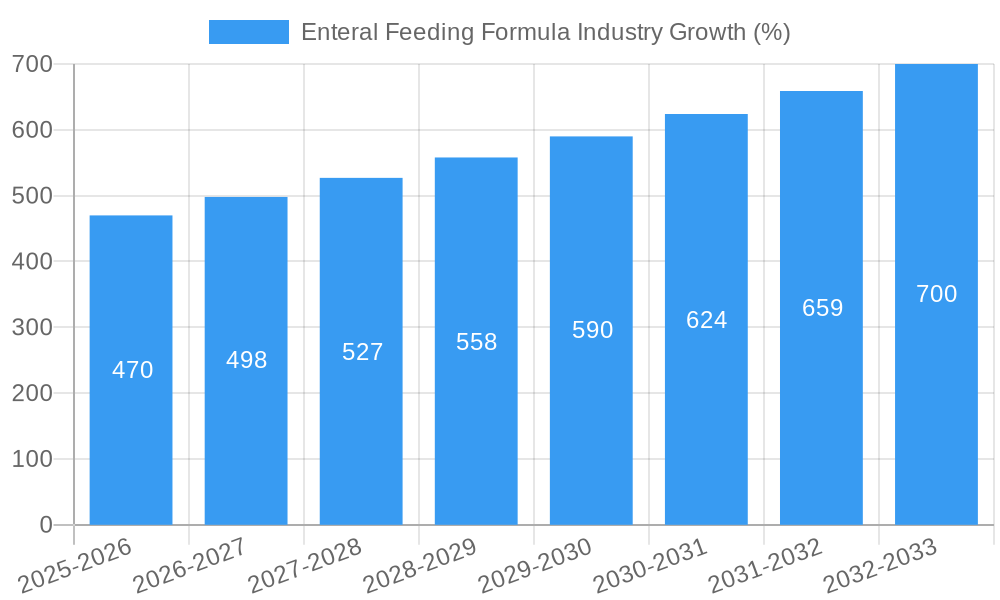
The global enteral feeding formula market, valued at $8.77 billion in 2025, is projected to experience robust growth, driven by a compound annual growth rate (CAGR) of 5.18% from 2025 to 2033. This expansion is fueled by several key factors. The rising prevalence of chronic diseases like cancer, neurological disorders, and diabetes necessitates increased reliance on enteral nutrition, thereby boosting market demand. An aging global population, coupled with higher healthcare expenditure in developed nations, further contributes to market growth. Technological advancements in formula composition, including the development of disease-specific formulas catering to individual patient needs, are also key drivers. Furthermore, the increasing preference for home-based care, fueled by cost-effectiveness and improved patient comfort, is expanding the market for home-care delivery channels. Growth is also influenced by increasing awareness of the benefits of enteral nutrition among healthcare professionals and patients, leading to higher adoption rates.
However, the market faces certain challenges. The high cost of specialized enteral formulas can pose a significant barrier, particularly in developing economies with limited healthcare access. Furthermore, potential adverse effects associated with enteral nutrition, along with the need for skilled healthcare professionals for proper administration and monitoring, can restrain market growth. Competitive intensity among established players and new entrants is another aspect influencing market dynamics. Nevertheless, the overall growth trajectory for the enteral feeding formula market remains positive, driven by the aforementioned factors and continued innovation within the industry. The market segmentation analysis reveals that the hospital channel and oncology application currently hold significant market shares, although growth in home-care and other applications is expected to accelerate in the forecast period. Leading players like Nestlé, Fresenius Kabi, and Abbott are leveraging their strong market positions through strategic partnerships, product diversification, and geographical expansion to maintain their dominance in this expanding sector.
Enteral Feeding Formula Industry Market Report: 2019-2033
This comprehensive report provides a detailed analysis of the global enteral feeding formula market, offering invaluable insights for stakeholders across the value chain. The study period covers 2019-2033, with 2025 as the base and estimated year, and a forecast period of 2025-2033. This report analyzes key market trends, competitive dynamics, and future growth opportunities, enabling informed strategic decision-making. The market is valued at xx Million in 2025 and is projected to reach xx Million by 2033, exhibiting a CAGR of xx% during the forecast period.
Enteral Feeding Formula Industry Market Composition & Trends
The enteral feeding formula market is a dynamic landscape shaped by several key factors. Market concentration is moderately high, with major players like Nestlé SA, Fresenius SE & Co KGaA (Fresenius Kabi AG), and Abbott Laboratories holding significant market share. However, smaller, specialized companies like Kate Farms are also gaining traction, particularly in niche segments like plant-based formulas. Innovation is driven by the need for specialized formulas catering to diverse medical conditions and patient preferences, including the rising demand for convenient and palatable options. Stringent regulatory frameworks, varying across different regions, influence product development and market access. Substitute products, such as parenteral nutrition, exist but are generally more complex and costly. The end-user profile is diverse, encompassing hospitals, home care agencies, and individual patients, each with unique needs and preferences. M&A activity in the sector has been moderate, with deal values ranging from xx Million to xx Million in recent years, reflecting strategic consolidation efforts.
- Market Share Distribution (2025): Nestlé SA (xx%), Fresenius SE & Co KGaA (xx%), Abbott Laboratories (xx%), Others (xx%).
- Recent M&A Activity: Details on significant mergers and acquisitions (with deal values) will be provided in the full report.
Enteral Feeding Formula Industry Evolution
The enteral feeding formula market has experienced significant evolution over the past decade. From 2019 to 2024, the market witnessed a CAGR of xx%, driven primarily by increasing prevalence of chronic diseases, aging populations, and technological advancements leading to improved formula efficacy and palatability. Technological advancements, such as the development of more bioavailable formulas and customized nutritional solutions tailored to specific patient needs, are key drivers of market growth. Consumer demands are shifting towards more convenient, palatable, and specialized products, prompting manufacturers to innovate and expand their product portfolios. The market is also witnessing a rise in demand for plant-based and organic options, aligning with growing consumer preference for natural and sustainable products. The adoption rate of disease-specific formulas is steadily increasing, reflecting a growing understanding of the importance of tailored nutrition in managing chronic conditions. The shift towards home-based care is also contributing to the growth of the home care segment.
Leading Regions, Countries, or Segments in Enteral Feeding Formula Industry
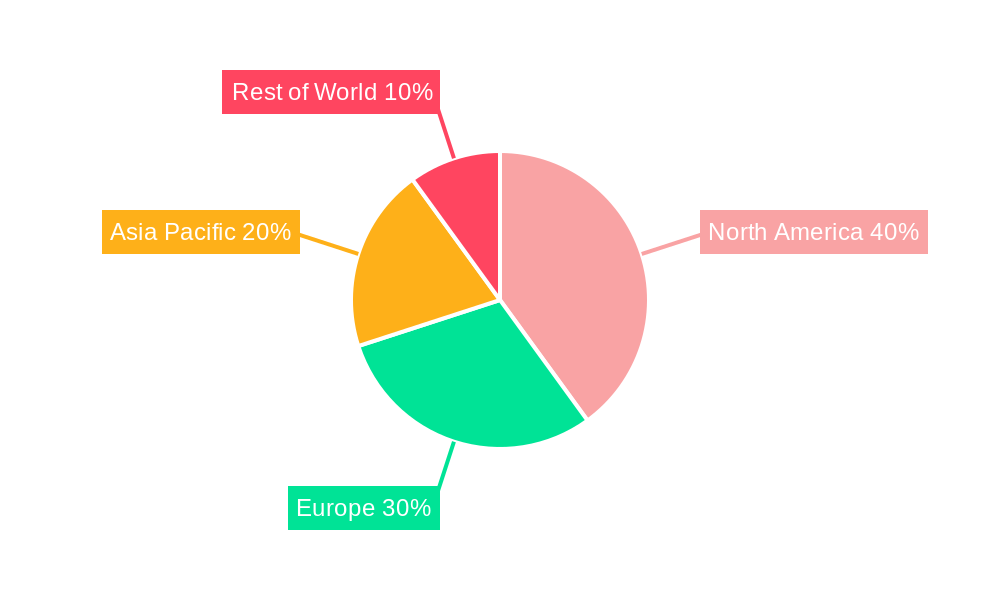
North America currently holds the dominant position in the global enteral feeding formula market, driven by high healthcare expenditure, technological advancements, and a robust regulatory framework. However, Asia-Pacific is projected to witness significant growth in the coming years, fueled by rising prevalence of chronic diseases and increasing healthcare awareness.
- By Product: Disease-specific formulas are experiencing rapid growth due to rising prevalence of chronic illnesses and increasing patient awareness.
- By Application: Oncology and critical care segments are key revenue generators due to the high prevalence of associated diseases and the critical need for specialized nutrition.
- By End User: Hospitals remain the largest end-user segment, followed by home care agencies.
- By Distribution Channel: Hospitals are the primary distribution channel, with retail pharmacies and online channels gaining traction.
Key Drivers:
- High Prevalence of Chronic Diseases: The rising incidence of conditions like cancer, diabetes, and neurological disorders fuels demand for specialized formulas.
- Aging Population: An aging population globally increases the need for nutritional support, particularly among the elderly and those with age-related health issues.
- Technological Advancements: Developments in formula composition and delivery systems improve efficacy and patient compliance.
Enteral Feeding Formula Industry Product Innovations
Recent innovations focus on improving palatability, ease of administration, and formula efficacy. This includes the development of ready-to-use formulas, specialized formulas for specific medical conditions (e.g., diabetes, oncology), and plant-based options. The incorporation of functional ingredients like prebiotics and probiotics enhances gut health and overall patient outcomes. Kate Farm’s recent launch of Adult Standard 1.4, a high-calorie formula available in chocolate, exemplifies this trend toward improved taste and convenience. Technological advancements in formula processing and packaging improve shelf life and reduce waste.
Propelling Factors for Enteral Feeding Formula Industry Growth
Technological advancements, such as improved formula compositions and delivery systems, are driving market expansion. Economic factors, like increasing healthcare expenditure and rising disposable incomes in developing economies, play a significant role. Favorable regulatory landscapes, promoting innovation and market access, also contribute to growth.
Obstacles in the Enteral Feeding Formula Industry Market
Stringent regulatory requirements for product approval and distribution pose challenges. Supply chain disruptions, particularly concerning raw materials and packaging, can impact production and availability. Intense competition among established players and emerging market entrants creates pressure on pricing and profitability.
Future Opportunities in Enteral Feeding Formula Industry
Emerging markets in Asia-Pacific and Latin America present significant growth opportunities. Developments in personalized nutrition and the use of advanced technologies like telehealth platforms for remote patient monitoring can unlock new avenues for market expansion. Furthermore, the growing demand for plant-based and organic options presents opportunities for manufacturers offering sustainable and environmentally friendly products.
Major Players in the Enteral Feeding Formula Industry Ecosystem
- Nestle SA
- Fresenius SE & Co KGaA (Fresenius Kabi AG)
- Meiji Holdings Co Ltd
- Global Health Product Inc
- Abbott Laboratories
- Danone SA (Nutricia)
- Functional Formularies
- Hormel Foods Corporation
- B Braun Melsungen AG
- Victus Inc
- Reckitt Benckiser Group plc (Mead Johnson)
- Kate Farms
Key Developments in Enteral Feeding Formula Industry Industry
- September 2022: Kate Farms secured USD 75 Million in Series C funding, boosting its plant-based research and product development.
- September 2022: Kate Farms launched Adult Standard 1.4, a high-calorie chocolate formula, enhancing product offerings.
Strategic Enteral Feeding Formula Industry Market Forecast
The enteral feeding formula market is poised for robust growth, driven by favorable demographic trends, increasing prevalence of chronic diseases, and continuous innovation in formula composition and delivery systems. The expanding home healthcare segment and increasing adoption of personalized nutrition solutions will further fuel market expansion. The potential for significant growth in emerging markets, coupled with ongoing technological advancements, presents substantial opportunities for market players in the coming years.
Enteral Feeding Formula Industry Segmentation
-
1. Product
- 1.1. Standard Formulas
- 1.2. Disease-specific Formulas
-
2. Application
- 2.1. Oncology
- 2.2. Neurology
- 2.3. Critical Care
- 2.4. Diabetes
- 2.5. Gastroenterology
- 2.6. Other Applications
-
3. End User
- 3.1. Hospital
- 3.2. Home Care Agencies and Hospices
- 3.3. Other End Users
-
4. Distributuion Channel
- 4.1. Hospitals
- 4.2. Retail Pharmacies
- 4.3. Online Pharmacies
Enteral Feeding Formula Industry Segmentation By Geography
-
1. North America
- 1.1. United States
- 1.2. Canada
- 1.3. Mexico
-
2. Europe
- 2.1. Germany
- 2.2. United Kingdom
- 2.3. France
- 2.4. Italy
- 2.5. Spain
- 2.6. Rest of Europe
-
3. Asia Pacific
- 3.1. China
- 3.2. Japan
- 3.3. India
- 3.4. Australia
- 3.5. South Korea
- 3.6. Rest of Asia Pacific
-
4. Middle East and Africa
- 4.1. GCC
- 4.2. South Africa
- 4.3. Rest of Middle East and Africa
-
5. South America
- 5.1. Brazil
- 5.2. Argentina
- 5.3. Rest of South America
Enteral Feeding Formula Industry REPORT HIGHLIGHTS
| Aspects | Details |
|---|---|
| Study Period | 2019-2033 |
| Base Year | 2024 |
| Estimated Year | 2025 |
| Forecast Period | 2025-2033 |
| Historical Period | 2019-2024 |
| Growth Rate | CAGR of 5.18% from 2019-2033 |
| Segmentation |
|
Table of Contents
- 1. Introduction
- 1.1. Research Scope
- 1.2. Market Segmentation
- 1.3. Research Methodology
- 1.4. Definitions and Assumptions
- 2. Executive Summary
- 2.1. Introduction
- 3. Market Dynamics
- 3.1. Introduction
- 3.2. Market Drivers
- 3.2.1. Increasing Prevalence of Metabolic and Chronic Diseases; Increasing Spending on Patient Care; Growing Geriatric Population
- 3.3. Market Restrains
- 3.3.1. Complications Associated with Enteral Nutrition; High Cost and Low Adherence Rates in Developing Countries
- 3.4. Market Trends
- 3.4.1. Oncology Segment is Expected to Hold a Significant Market Share in the Enteral Feeding Formulas Market
- 4. Market Factor Analysis
- 4.1. Porters Five Forces
- 4.2. Supply/Value Chain
- 4.3. PESTEL analysis
- 4.4. Market Entropy
- 4.5. Patent/Trademark Analysis
- 5. Global Enteral Feeding Formula Industry Analysis, Insights and Forecast, 2019-2031
- 5.1. Market Analysis, Insights and Forecast - by Product
- 5.1.1. Standard Formulas
- 5.1.2. Disease-specific Formulas
- 5.2. Market Analysis, Insights and Forecast - by Application
- 5.2.1. Oncology
- 5.2.2. Neurology
- 5.2.3. Critical Care
- 5.2.4. Diabetes
- 5.2.5. Gastroenterology
- 5.2.6. Other Applications
- 5.3. Market Analysis, Insights and Forecast - by End User
- 5.3.1. Hospital
- 5.3.2. Home Care Agencies and Hospices
- 5.3.3. Other End Users
- 5.4. Market Analysis, Insights and Forecast - by Distributuion Channel
- 5.4.1. Hospitals
- 5.4.2. Retail Pharmacies
- 5.4.3. Online Pharmacies
- 5.5. Market Analysis, Insights and Forecast - by Region
- 5.5.1. North America
- 5.5.2. Europe
- 5.5.3. Asia Pacific
- 5.5.4. Middle East and Africa
- 5.5.5. South America
- 5.1. Market Analysis, Insights and Forecast - by Product
- 6. North America Enteral Feeding Formula Industry Analysis, Insights and Forecast, 2019-2031
- 6.1. Market Analysis, Insights and Forecast - by Product
- 6.1.1. Standard Formulas
- 6.1.2. Disease-specific Formulas
- 6.2. Market Analysis, Insights and Forecast - by Application
- 6.2.1. Oncology
- 6.2.2. Neurology
- 6.2.3. Critical Care
- 6.2.4. Diabetes
- 6.2.5. Gastroenterology
- 6.2.6. Other Applications
- 6.3. Market Analysis, Insights and Forecast - by End User
- 6.3.1. Hospital
- 6.3.2. Home Care Agencies and Hospices
- 6.3.3. Other End Users
- 6.4. Market Analysis, Insights and Forecast - by Distributuion Channel
- 6.4.1. Hospitals
- 6.4.2. Retail Pharmacies
- 6.4.3. Online Pharmacies
- 6.1. Market Analysis, Insights and Forecast - by Product
- 7. Europe Enteral Feeding Formula Industry Analysis, Insights and Forecast, 2019-2031
- 7.1. Market Analysis, Insights and Forecast - by Product
- 7.1.1. Standard Formulas
- 7.1.2. Disease-specific Formulas
- 7.2. Market Analysis, Insights and Forecast - by Application
- 7.2.1. Oncology
- 7.2.2. Neurology
- 7.2.3. Critical Care
- 7.2.4. Diabetes
- 7.2.5. Gastroenterology
- 7.2.6. Other Applications
- 7.3. Market Analysis, Insights and Forecast - by End User
- 7.3.1. Hospital
- 7.3.2. Home Care Agencies and Hospices
- 7.3.3. Other End Users
- 7.4. Market Analysis, Insights and Forecast - by Distributuion Channel
- 7.4.1. Hospitals
- 7.4.2. Retail Pharmacies
- 7.4.3. Online Pharmacies
- 7.1. Market Analysis, Insights and Forecast - by Product
- 8. Asia Pacific Enteral Feeding Formula Industry Analysis, Insights and Forecast, 2019-2031
- 8.1. Market Analysis, Insights and Forecast - by Product
- 8.1.1. Standard Formulas
- 8.1.2. Disease-specific Formulas
- 8.2. Market Analysis, Insights and Forecast - by Application
- 8.2.1. Oncology
- 8.2.2. Neurology
- 8.2.3. Critical Care
- 8.2.4. Diabetes
- 8.2.5. Gastroenterology
- 8.2.6. Other Applications
- 8.3. Market Analysis, Insights and Forecast - by End User
- 8.3.1. Hospital
- 8.3.2. Home Care Agencies and Hospices
- 8.3.3. Other End Users
- 8.4. Market Analysis, Insights and Forecast - by Distributuion Channel
- 8.4.1. Hospitals
- 8.4.2. Retail Pharmacies
- 8.4.3. Online Pharmacies
- 8.1. Market Analysis, Insights and Forecast - by Product
- 9. Middle East and Africa Enteral Feeding Formula Industry Analysis, Insights and Forecast, 2019-2031
- 9.1. Market Analysis, Insights and Forecast - by Product
- 9.1.1. Standard Formulas
- 9.1.2. Disease-specific Formulas
- 9.2. Market Analysis, Insights and Forecast - by Application
- 9.2.1. Oncology
- 9.2.2. Neurology
- 9.2.3. Critical Care
- 9.2.4. Diabetes
- 9.2.5. Gastroenterology
- 9.2.6. Other Applications
- 9.3. Market Analysis, Insights and Forecast - by End User
- 9.3.1. Hospital
- 9.3.2. Home Care Agencies and Hospices
- 9.3.3. Other End Users
- 9.4. Market Analysis, Insights and Forecast - by Distributuion Channel
- 9.4.1. Hospitals
- 9.4.2. Retail Pharmacies
- 9.4.3. Online Pharmacies
- 9.1. Market Analysis, Insights and Forecast - by Product
- 10. South America Enteral Feeding Formula Industry Analysis, Insights and Forecast, 2019-2031
- 10.1. Market Analysis, Insights and Forecast - by Product
- 10.1.1. Standard Formulas
- 10.1.2. Disease-specific Formulas
- 10.2. Market Analysis, Insights and Forecast - by Application
- 10.2.1. Oncology
- 10.2.2. Neurology
- 10.2.3. Critical Care
- 10.2.4. Diabetes
- 10.2.5. Gastroenterology
- 10.2.6. Other Applications
- 10.3. Market Analysis, Insights and Forecast - by End User
- 10.3.1. Hospital
- 10.3.2. Home Care Agencies and Hospices
- 10.3.3. Other End Users
- 10.4. Market Analysis, Insights and Forecast - by Distributuion Channel
- 10.4.1. Hospitals
- 10.4.2. Retail Pharmacies
- 10.4.3. Online Pharmacies
- 10.1. Market Analysis, Insights and Forecast - by Product
- 11. North America Enteral Feeding Formula Industry Analysis, Insights and Forecast, 2019-2031
- 11.1. Market Analysis, Insights and Forecast - By Country/Sub-region
- 11.1.1 United States
- 11.1.2 Canada
- 11.1.3 Mexico
- 12. South America Enteral Feeding Formula Industry Analysis, Insights and Forecast, 2019-2031
- 12.1. Market Analysis, Insights and Forecast - By Country/Sub-region
- 12.1.1 Brazil
- 12.1.2 Mexico
- 12.1.3 Rest of South America
- 13. Europe Enteral Feeding Formula Industry Analysis, Insights and Forecast, 2019-2031
- 13.1. Market Analysis, Insights and Forecast - By Country/Sub-region
- 13.1.1 United Kingdom
- 13.1.2 Germany
- 13.1.3 France
- 13.1.4 Italy
- 13.1.5 Spain
- 13.1.6 Russia
- 13.1.7 Rest of Europe
- 14. Asia Pacific Enteral Feeding Formula Industry Analysis, Insights and Forecast, 2019-2031
- 14.1. Market Analysis, Insights and Forecast - By Country/Sub-region
- 14.1.1 China
- 14.1.2 Japan
- 14.1.3 India
- 14.1.4 South Korea
- 14.1.5 Taiwan
- 14.1.6 Australia
- 14.1.7 Rest of Asia-Pacific
- 15. MEA Enteral Feeding Formula Industry Analysis, Insights and Forecast, 2019-2031
- 15.1. Market Analysis, Insights and Forecast - By Country/Sub-region
- 15.1.1 Middle East
- 15.1.2 Africa
- 16. Competitive Analysis
- 16.1. Global Market Share Analysis 2024
- 16.2. Company Profiles
- 16.2.1 Nestle SA
- 16.2.1.1. Overview
- 16.2.1.2. Products
- 16.2.1.3. SWOT Analysis
- 16.2.1.4. Recent Developments
- 16.2.1.5. Financials (Based on Availability)
- 16.2.2 Fresenius SE & Co KgaA (Fresenius Kabi AG)
- 16.2.2.1. Overview
- 16.2.2.2. Products
- 16.2.2.3. SWOT Analysis
- 16.2.2.4. Recent Developments
- 16.2.2.5. Financials (Based on Availability)
- 16.2.3 Meiji Holdings Co Ltd
- 16.2.3.1. Overview
- 16.2.3.2. Products
- 16.2.3.3. SWOT Analysis
- 16.2.3.4. Recent Developments
- 16.2.3.5. Financials (Based on Availability)
- 16.2.4 Global Health Product Inc
- 16.2.4.1. Overview
- 16.2.4.2. Products
- 16.2.4.3. SWOT Analysis
- 16.2.4.4. Recent Developments
- 16.2.4.5. Financials (Based on Availability)
- 16.2.5 Abbott Laboratories
- 16.2.5.1. Overview
- 16.2.5.2. Products
- 16.2.5.3. SWOT Analysis
- 16.2.5.4. Recent Developments
- 16.2.5.5. Financials (Based on Availability)
- 16.2.6 Danone SA (Nutricia)
- 16.2.6.1. Overview
- 16.2.6.2. Products
- 16.2.6.3. SWOT Analysis
- 16.2.6.4. Recent Developments
- 16.2.6.5. Financials (Based on Availability)
- 16.2.7 Functional Formularies*List Not Exhaustive
- 16.2.7.1. Overview
- 16.2.7.2. Products
- 16.2.7.3. SWOT Analysis
- 16.2.7.4. Recent Developments
- 16.2.7.5. Financials (Based on Availability)
- 16.2.8 Hormel Foods Corporation
- 16.2.8.1. Overview
- 16.2.8.2. Products
- 16.2.8.3. SWOT Analysis
- 16.2.8.4. Recent Developments
- 16.2.8.5. Financials (Based on Availability)
- 16.2.9 B Braun Melsungen AG
- 16.2.9.1. Overview
- 16.2.9.2. Products
- 16.2.9.3. SWOT Analysis
- 16.2.9.4. Recent Developments
- 16.2.9.5. Financials (Based on Availability)
- 16.2.10 Victus Inc
- 16.2.10.1. Overview
- 16.2.10.2. Products
- 16.2.10.3. SWOT Analysis
- 16.2.10.4. Recent Developments
- 16.2.10.5. Financials (Based on Availability)
- 16.2.11 Reckitt Benckiser Group plc (Mead Johnson)
- 16.2.11.1. Overview
- 16.2.11.2. Products
- 16.2.11.3. SWOT Analysis
- 16.2.11.4. Recent Developments
- 16.2.11.5. Financials (Based on Availability)
- 16.2.12 Kate Farms
- 16.2.12.1. Overview
- 16.2.12.2. Products
- 16.2.12.3. SWOT Analysis
- 16.2.12.4. Recent Developments
- 16.2.12.5. Financials (Based on Availability)
- 16.2.1 Nestle SA
List of Figures
- Figure 1: Global Enteral Feeding Formula Industry Revenue Breakdown (Million, %) by Region 2024 & 2032
- Figure 2: North America Enteral Feeding Formula Industry Revenue (Million), by Country 2024 & 2032
- Figure 3: North America Enteral Feeding Formula Industry Revenue Share (%), by Country 2024 & 2032
- Figure 4: South America Enteral Feeding Formula Industry Revenue (Million), by Country 2024 & 2032
- Figure 5: South America Enteral Feeding Formula Industry Revenue Share (%), by Country 2024 & 2032
- Figure 6: Europe Enteral Feeding Formula Industry Revenue (Million), by Country 2024 & 2032
- Figure 7: Europe Enteral Feeding Formula Industry Revenue Share (%), by Country 2024 & 2032
- Figure 8: Asia Pacific Enteral Feeding Formula Industry Revenue (Million), by Country 2024 & 2032
- Figure 9: Asia Pacific Enteral Feeding Formula Industry Revenue Share (%), by Country 2024 & 2032
- Figure 10: MEA Enteral Feeding Formula Industry Revenue (Million), by Country 2024 & 2032
- Figure 11: MEA Enteral Feeding Formula Industry Revenue Share (%), by Country 2024 & 2032
- Figure 12: North America Enteral Feeding Formula Industry Revenue (Million), by Product 2024 & 2032
- Figure 13: North America Enteral Feeding Formula Industry Revenue Share (%), by Product 2024 & 2032
- Figure 14: North America Enteral Feeding Formula Industry Revenue (Million), by Application 2024 & 2032
- Figure 15: North America Enteral Feeding Formula Industry Revenue Share (%), by Application 2024 & 2032
- Figure 16: North America Enteral Feeding Formula Industry Revenue (Million), by End User 2024 & 2032
- Figure 17: North America Enteral Feeding Formula Industry Revenue Share (%), by End User 2024 & 2032
- Figure 18: North America Enteral Feeding Formula Industry Revenue (Million), by Distributuion Channel 2024 & 2032
- Figure 19: North America Enteral Feeding Formula Industry Revenue Share (%), by Distributuion Channel 2024 & 2032
- Figure 20: North America Enteral Feeding Formula Industry Revenue (Million), by Country 2024 & 2032
- Figure 21: North America Enteral Feeding Formula Industry Revenue Share (%), by Country 2024 & 2032
- Figure 22: Europe Enteral Feeding Formula Industry Revenue (Million), by Product 2024 & 2032
- Figure 23: Europe Enteral Feeding Formula Industry Revenue Share (%), by Product 2024 & 2032
- Figure 24: Europe Enteral Feeding Formula Industry Revenue (Million), by Application 2024 & 2032
- Figure 25: Europe Enteral Feeding Formula Industry Revenue Share (%), by Application 2024 & 2032
- Figure 26: Europe Enteral Feeding Formula Industry Revenue (Million), by End User 2024 & 2032
- Figure 27: Europe Enteral Feeding Formula Industry Revenue Share (%), by End User 2024 & 2032
- Figure 28: Europe Enteral Feeding Formula Industry Revenue (Million), by Distributuion Channel 2024 & 2032
- Figure 29: Europe Enteral Feeding Formula Industry Revenue Share (%), by Distributuion Channel 2024 & 2032
- Figure 30: Europe Enteral Feeding Formula Industry Revenue (Million), by Country 2024 & 2032
- Figure 31: Europe Enteral Feeding Formula Industry Revenue Share (%), by Country 2024 & 2032
- Figure 32: Asia Pacific Enteral Feeding Formula Industry Revenue (Million), by Product 2024 & 2032
- Figure 33: Asia Pacific Enteral Feeding Formula Industry Revenue Share (%), by Product 2024 & 2032
- Figure 34: Asia Pacific Enteral Feeding Formula Industry Revenue (Million), by Application 2024 & 2032
- Figure 35: Asia Pacific Enteral Feeding Formula Industry Revenue Share (%), by Application 2024 & 2032
- Figure 36: Asia Pacific Enteral Feeding Formula Industry Revenue (Million), by End User 2024 & 2032
- Figure 37: Asia Pacific Enteral Feeding Formula Industry Revenue Share (%), by End User 2024 & 2032
- Figure 38: Asia Pacific Enteral Feeding Formula Industry Revenue (Million), by Distributuion Channel 2024 & 2032
- Figure 39: Asia Pacific Enteral Feeding Formula Industry Revenue Share (%), by Distributuion Channel 2024 & 2032
- Figure 40: Asia Pacific Enteral Feeding Formula Industry Revenue (Million), by Country 2024 & 2032
- Figure 41: Asia Pacific Enteral Feeding Formula Industry Revenue Share (%), by Country 2024 & 2032
- Figure 42: Middle East and Africa Enteral Feeding Formula Industry Revenue (Million), by Product 2024 & 2032
- Figure 43: Middle East and Africa Enteral Feeding Formula Industry Revenue Share (%), by Product 2024 & 2032
- Figure 44: Middle East and Africa Enteral Feeding Formula Industry Revenue (Million), by Application 2024 & 2032
- Figure 45: Middle East and Africa Enteral Feeding Formula Industry Revenue Share (%), by Application 2024 & 2032
- Figure 46: Middle East and Africa Enteral Feeding Formula Industry Revenue (Million), by End User 2024 & 2032
- Figure 47: Middle East and Africa Enteral Feeding Formula Industry Revenue Share (%), by End User 2024 & 2032
- Figure 48: Middle East and Africa Enteral Feeding Formula Industry Revenue (Million), by Distributuion Channel 2024 & 2032
- Figure 49: Middle East and Africa Enteral Feeding Formula Industry Revenue Share (%), by Distributuion Channel 2024 & 2032
- Figure 50: Middle East and Africa Enteral Feeding Formula Industry Revenue (Million), by Country 2024 & 2032
- Figure 51: Middle East and Africa Enteral Feeding Formula Industry Revenue Share (%), by Country 2024 & 2032
- Figure 52: South America Enteral Feeding Formula Industry Revenue (Million), by Product 2024 & 2032
- Figure 53: South America Enteral Feeding Formula Industry Revenue Share (%), by Product 2024 & 2032
- Figure 54: South America Enteral Feeding Formula Industry Revenue (Million), by Application 2024 & 2032
- Figure 55: South America Enteral Feeding Formula Industry Revenue Share (%), by Application 2024 & 2032
- Figure 56: South America Enteral Feeding Formula Industry Revenue (Million), by End User 2024 & 2032
- Figure 57: South America Enteral Feeding Formula Industry Revenue Share (%), by End User 2024 & 2032
- Figure 58: South America Enteral Feeding Formula Industry Revenue (Million), by Distributuion Channel 2024 & 2032
- Figure 59: South America Enteral Feeding Formula Industry Revenue Share (%), by Distributuion Channel 2024 & 2032
- Figure 60: South America Enteral Feeding Formula Industry Revenue (Million), by Country 2024 & 2032
- Figure 61: South America Enteral Feeding Formula Industry Revenue Share (%), by Country 2024 & 2032
List of Tables
- Table 1: Global Enteral Feeding Formula Industry Revenue Million Forecast, by Region 2019 & 2032
- Table 2: Global Enteral Feeding Formula Industry Revenue Million Forecast, by Product 2019 & 2032
- Table 3: Global Enteral Feeding Formula Industry Revenue Million Forecast, by Application 2019 & 2032
- Table 4: Global Enteral Feeding Formula Industry Revenue Million Forecast, by End User 2019 & 2032
- Table 5: Global Enteral Feeding Formula Industry Revenue Million Forecast, by Distributuion Channel 2019 & 2032
- Table 6: Global Enteral Feeding Formula Industry Revenue Million Forecast, by Region 2019 & 2032
- Table 7: Global Enteral Feeding Formula Industry Revenue Million Forecast, by Country 2019 & 2032
- Table 8: United States Enteral Feeding Formula Industry Revenue (Million) Forecast, by Application 2019 & 2032
- Table 9: Canada Enteral Feeding Formula Industry Revenue (Million) Forecast, by Application 2019 & 2032
- Table 10: Mexico Enteral Feeding Formula Industry Revenue (Million) Forecast, by Application 2019 & 2032
- Table 11: Global Enteral Feeding Formula Industry Revenue Million Forecast, by Country 2019 & 2032
- Table 12: Brazil Enteral Feeding Formula Industry Revenue (Million) Forecast, by Application 2019 & 2032
- Table 13: Mexico Enteral Feeding Formula Industry Revenue (Million) Forecast, by Application 2019 & 2032
- Table 14: Rest of South America Enteral Feeding Formula Industry Revenue (Million) Forecast, by Application 2019 & 2032
- Table 15: Global Enteral Feeding Formula Industry Revenue Million Forecast, by Country 2019 & 2032
- Table 16: United Kingdom Enteral Feeding Formula Industry Revenue (Million) Forecast, by Application 2019 & 2032
- Table 17: Germany Enteral Feeding Formula Industry Revenue (Million) Forecast, by Application 2019 & 2032
- Table 18: France Enteral Feeding Formula Industry Revenue (Million) Forecast, by Application 2019 & 2032
- Table 19: Italy Enteral Feeding Formula Industry Revenue (Million) Forecast, by Application 2019 & 2032
- Table 20: Spain Enteral Feeding Formula Industry Revenue (Million) Forecast, by Application 2019 & 2032
- Table 21: Russia Enteral Feeding Formula Industry Revenue (Million) Forecast, by Application 2019 & 2032
- Table 22: Rest of Europe Enteral Feeding Formula Industry Revenue (Million) Forecast, by Application 2019 & 2032
- Table 23: Global Enteral Feeding Formula Industry Revenue Million Forecast, by Country 2019 & 2032
- Table 24: China Enteral Feeding Formula Industry Revenue (Million) Forecast, by Application 2019 & 2032
- Table 25: Japan Enteral Feeding Formula Industry Revenue (Million) Forecast, by Application 2019 & 2032
- Table 26: India Enteral Feeding Formula Industry Revenue (Million) Forecast, by Application 2019 & 2032
- Table 27: South Korea Enteral Feeding Formula Industry Revenue (Million) Forecast, by Application 2019 & 2032
- Table 28: Taiwan Enteral Feeding Formula Industry Revenue (Million) Forecast, by Application 2019 & 2032
- Table 29: Australia Enteral Feeding Formula Industry Revenue (Million) Forecast, by Application 2019 & 2032
- Table 30: Rest of Asia-Pacific Enteral Feeding Formula Industry Revenue (Million) Forecast, by Application 2019 & 2032
- Table 31: Global Enteral Feeding Formula Industry Revenue Million Forecast, by Country 2019 & 2032
- Table 32: Middle East Enteral Feeding Formula Industry Revenue (Million) Forecast, by Application 2019 & 2032
- Table 33: Africa Enteral Feeding Formula Industry Revenue (Million) Forecast, by Application 2019 & 2032
- Table 34: Global Enteral Feeding Formula Industry Revenue Million Forecast, by Product 2019 & 2032
- Table 35: Global Enteral Feeding Formula Industry Revenue Million Forecast, by Application 2019 & 2032
- Table 36: Global Enteral Feeding Formula Industry Revenue Million Forecast, by End User 2019 & 2032
- Table 37: Global Enteral Feeding Formula Industry Revenue Million Forecast, by Distributuion Channel 2019 & 2032
- Table 38: Global Enteral Feeding Formula Industry Revenue Million Forecast, by Country 2019 & 2032
- Table 39: United States Enteral Feeding Formula Industry Revenue (Million) Forecast, by Application 2019 & 2032
- Table 40: Canada Enteral Feeding Formula Industry Revenue (Million) Forecast, by Application 2019 & 2032
- Table 41: Mexico Enteral Feeding Formula Industry Revenue (Million) Forecast, by Application 2019 & 2032
- Table 42: Global Enteral Feeding Formula Industry Revenue Million Forecast, by Product 2019 & 2032
- Table 43: Global Enteral Feeding Formula Industry Revenue Million Forecast, by Application 2019 & 2032
- Table 44: Global Enteral Feeding Formula Industry Revenue Million Forecast, by End User 2019 & 2032
- Table 45: Global Enteral Feeding Formula Industry Revenue Million Forecast, by Distributuion Channel 2019 & 2032
- Table 46: Global Enteral Feeding Formula Industry Revenue Million Forecast, by Country 2019 & 2032
- Table 47: Germany Enteral Feeding Formula Industry Revenue (Million) Forecast, by Application 2019 & 2032
- Table 48: United Kingdom Enteral Feeding Formula Industry Revenue (Million) Forecast, by Application 2019 & 2032
- Table 49: France Enteral Feeding Formula Industry Revenue (Million) Forecast, by Application 2019 & 2032
- Table 50: Italy Enteral Feeding Formula Industry Revenue (Million) Forecast, by Application 2019 & 2032
- Table 51: Spain Enteral Feeding Formula Industry Revenue (Million) Forecast, by Application 2019 & 2032
- Table 52: Rest of Europe Enteral Feeding Formula Industry Revenue (Million) Forecast, by Application 2019 & 2032
- Table 53: Global Enteral Feeding Formula Industry Revenue Million Forecast, by Product 2019 & 2032
- Table 54: Global Enteral Feeding Formula Industry Revenue Million Forecast, by Application 2019 & 2032
- Table 55: Global Enteral Feeding Formula Industry Revenue Million Forecast, by End User 2019 & 2032
- Table 56: Global Enteral Feeding Formula Industry Revenue Million Forecast, by Distributuion Channel 2019 & 2032
- Table 57: Global Enteral Feeding Formula Industry Revenue Million Forecast, by Country 2019 & 2032
- Table 58: China Enteral Feeding Formula Industry Revenue (Million) Forecast, by Application 2019 & 2032
- Table 59: Japan Enteral Feeding Formula Industry Revenue (Million) Forecast, by Application 2019 & 2032
- Table 60: India Enteral Feeding Formula Industry Revenue (Million) Forecast, by Application 2019 & 2032
- Table 61: Australia Enteral Feeding Formula Industry Revenue (Million) Forecast, by Application 2019 & 2032
- Table 62: South Korea Enteral Feeding Formula Industry Revenue (Million) Forecast, by Application 2019 & 2032
- Table 63: Rest of Asia Pacific Enteral Feeding Formula Industry Revenue (Million) Forecast, by Application 2019 & 2032
- Table 64: Global Enteral Feeding Formula Industry Revenue Million Forecast, by Product 2019 & 2032
- Table 65: Global Enteral Feeding Formula Industry Revenue Million Forecast, by Application 2019 & 2032
- Table 66: Global Enteral Feeding Formula Industry Revenue Million Forecast, by End User 2019 & 2032
- Table 67: Global Enteral Feeding Formula Industry Revenue Million Forecast, by Distributuion Channel 2019 & 2032
- Table 68: Global Enteral Feeding Formula Industry Revenue Million Forecast, by Country 2019 & 2032
- Table 69: GCC Enteral Feeding Formula Industry Revenue (Million) Forecast, by Application 2019 & 2032
- Table 70: South Africa Enteral Feeding Formula Industry Revenue (Million) Forecast, by Application 2019 & 2032
- Table 71: Rest of Middle East and Africa Enteral Feeding Formula Industry Revenue (Million) Forecast, by Application 2019 & 2032
- Table 72: Global Enteral Feeding Formula Industry Revenue Million Forecast, by Product 2019 & 2032
- Table 73: Global Enteral Feeding Formula Industry Revenue Million Forecast, by Application 2019 & 2032
- Table 74: Global Enteral Feeding Formula Industry Revenue Million Forecast, by End User 2019 & 2032
- Table 75: Global Enteral Feeding Formula Industry Revenue Million Forecast, by Distributuion Channel 2019 & 2032
- Table 76: Global Enteral Feeding Formula Industry Revenue Million Forecast, by Country 2019 & 2032
- Table 77: Brazil Enteral Feeding Formula Industry Revenue (Million) Forecast, by Application 2019 & 2032
- Table 78: Argentina Enteral Feeding Formula Industry Revenue (Million) Forecast, by Application 2019 & 2032
- Table 79: Rest of South America Enteral Feeding Formula Industry Revenue (Million) Forecast, by Application 2019 & 2032
Frequently Asked Questions
1. What is the projected Compound Annual Growth Rate (CAGR) of the Enteral Feeding Formula Industry?
The projected CAGR is approximately 5.18%.
2. Which companies are prominent players in the Enteral Feeding Formula Industry?
Key companies in the market include Nestle SA, Fresenius SE & Co KgaA (Fresenius Kabi AG), Meiji Holdings Co Ltd, Global Health Product Inc, Abbott Laboratories, Danone SA (Nutricia), Functional Formularies*List Not Exhaustive, Hormel Foods Corporation, B Braun Melsungen AG, Victus Inc, Reckitt Benckiser Group plc (Mead Johnson), Kate Farms.
3. What are the main segments of the Enteral Feeding Formula Industry?
The market segments include Product, Application, End User, Distributuion Channel.
4. Can you provide details about the market size?
The market size is estimated to be USD 8.77 Million as of 2022.
5. What are some drivers contributing to market growth?
Increasing Prevalence of Metabolic and Chronic Diseases; Increasing Spending on Patient Care; Growing Geriatric Population.
6. What are the notable trends driving market growth?
Oncology Segment is Expected to Hold a Significant Market Share in the Enteral Feeding Formulas Market.
7. Are there any restraints impacting market growth?
Complications Associated with Enteral Nutrition; High Cost and Low Adherence Rates in Developing Countries.
8. Can you provide examples of recent developments in the market?
September 2022: Kate Farms raised USD 75 million in a Series C funding round led by life-science investor Novo Holdings. With this, Kate Farms will be able to increase its efforts in developing plant-based clinical nutrition research, product innovation, and development into more channels.
9. What pricing options are available for accessing the report?
Pricing options include single-user, multi-user, and enterprise licenses priced at USD 4750, USD 5250, and USD 8750 respectively.
10. Is the market size provided in terms of value or volume?
The market size is provided in terms of value, measured in Million.
11. Are there any specific market keywords associated with the report?
Yes, the market keyword associated with the report is "Enteral Feeding Formula Industry," which aids in identifying and referencing the specific market segment covered.
12. How do I determine which pricing option suits my needs best?
The pricing options vary based on user requirements and access needs. Individual users may opt for single-user licenses, while businesses requiring broader access may choose multi-user or enterprise licenses for cost-effective access to the report.
13. Are there any additional resources or data provided in the Enteral Feeding Formula Industry report?
While the report offers comprehensive insights, it's advisable to review the specific contents or supplementary materials provided to ascertain if additional resources or data are available.
14. How can I stay updated on further developments or reports in the Enteral Feeding Formula Industry?
To stay informed about further developments, trends, and reports in the Enteral Feeding Formula Industry, consider subscribing to industry newsletters, following relevant companies and organizations, or regularly checking reputable industry news sources and publications.
Methodology
Step 1 - Identification of Relevant Samples Size from Population Database


Step 2 - Approaches for Defining Global Market Size (Value, Volume* & Price*)

Note*: In applicable scenarios
Step 3 - Data Sources
Primary Research
- Web Analytics
- Survey Reports
- Research Institute
- Latest Research Reports
- Opinion Leaders
Secondary Research
- Annual Reports
- White Paper
- Latest Press Release
- Industry Association
- Paid Database
- Investor Presentations

Step 4 - Data Triangulation
Involves using different sources of information in order to increase the validity of a study
These sources are likely to be stakeholders in a program - participants, other researchers, program staff, other community members, and so on.
Then we put all data in single framework & apply various statistical tools to find out the dynamic on the market.
During the analysis stage, feedback from the stakeholder groups would be compared to determine areas of agreement as well as areas of divergence
