

Key Insights
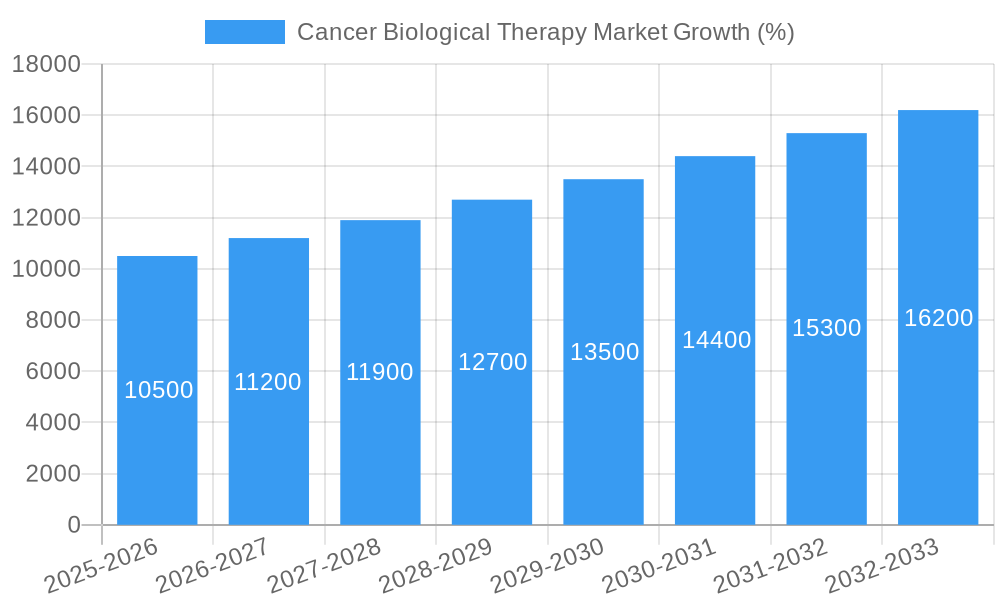
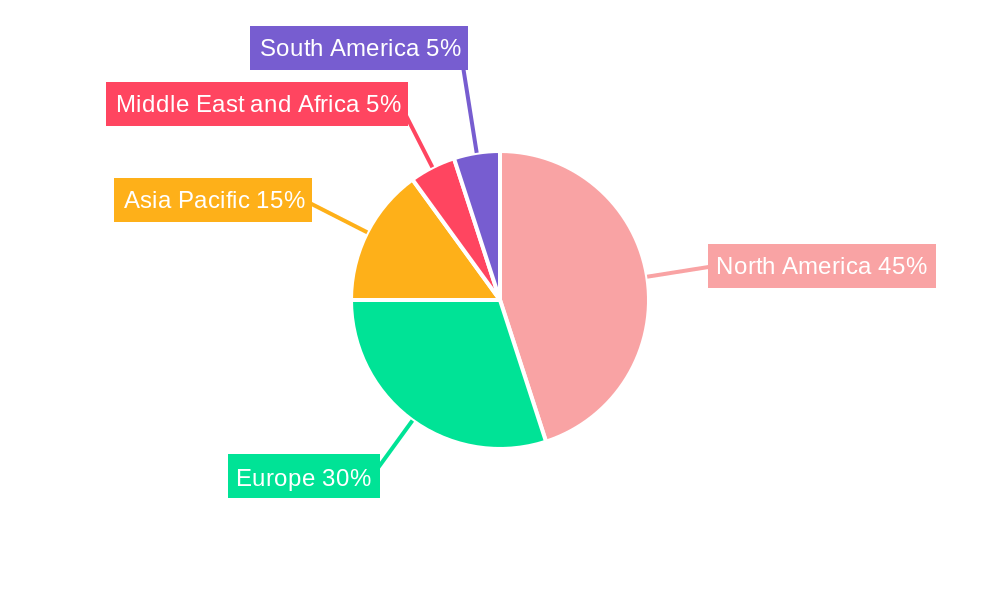
The global cancer biological therapy market is experiencing robust growth, driven by a rising incidence of cancer globally, an aging population, and the increasing prevalence of chronic diseases. The market's compound annual growth rate (CAGR) of 7.10% from 2019 to 2024 indicates significant potential. Several factors contribute to this growth, including advancements in research and development leading to more effective and targeted therapies, a rise in government initiatives supporting cancer research and treatment, and increased healthcare expenditure. The market is segmented by therapy type (small molecule drugs, monoclonal antibodies, immunotherapies, and others), cancer type (lung, breast, colorectal, blood, gynecologic, and others), and end-user (hospitals, cancer and radiation therapy centers, and specialty clinics). Monoclonal antibodies and immunotherapies are currently dominating the market due to their high efficacy and targeted approach, offering improved patient outcomes compared to traditional chemotherapy. The North American market holds a significant share, attributed to advanced healthcare infrastructure and high healthcare expenditure. However, the Asia Pacific region is projected to witness the fastest growth rate due to expanding healthcare infrastructure, increasing awareness about cancer, and a growing population. Market restraints include the high cost of these therapies, potential side effects, and the need for specialized healthcare professionals for administration. Despite these challenges, the market's future looks promising with ongoing research into novel therapies and personalized medicine approaches.
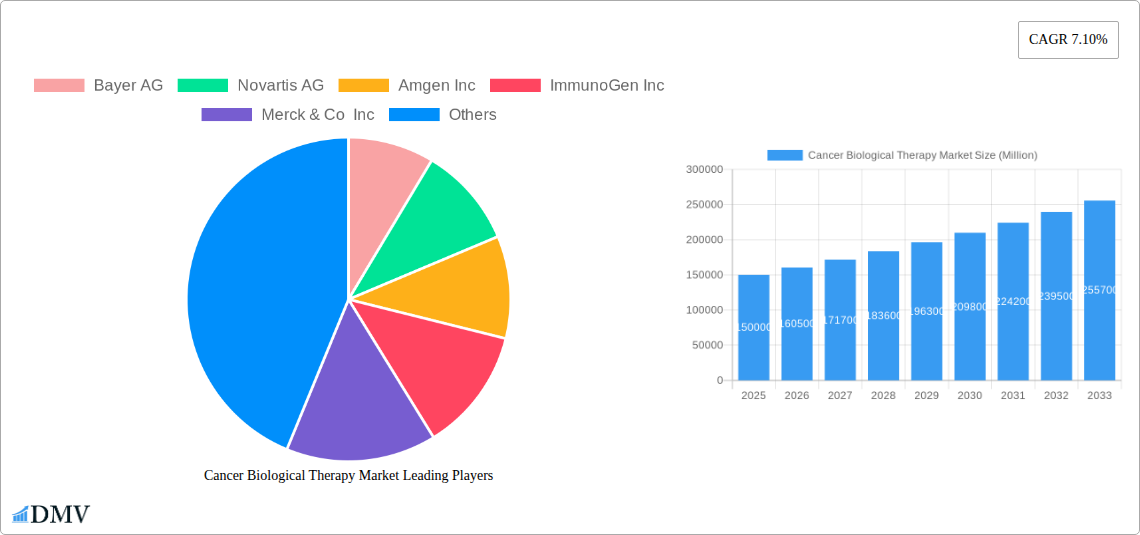
The competitive landscape is shaped by numerous pharmaceutical giants, including Bayer AG, Novartis AG, Amgen Inc., and others. These companies are actively involved in research and development, strategic partnerships, and mergers and acquisitions to strengthen their market position. The focus is on developing innovative therapies with improved efficacy and reduced side effects to cater to the growing unmet medical needs of cancer patients. The increasing demand for personalized medicine, which tailors treatment based on an individual's genetic profile, is also driving innovation in the market. Future growth will depend on the successful development and commercialization of novel therapies, expansion into emerging markets, and the adoption of advanced technologies in diagnostics and treatment. The focus on improved patient outcomes and affordability will play a crucial role in shaping the market's trajectory in the coming years.
Cancer Biological Therapy Market: A Comprehensive Report (2019-2033)
This insightful report provides a detailed analysis of the Cancer Biological Therapy Market, projecting a market value of xx Million by 2033. The study encompasses the historical period (2019-2024), base year (2025), and forecast period (2025-2033), offering a comprehensive understanding of market dynamics and future potential. Key segments analyzed include therapy types (small molecule drugs, monoclonal antibodies, immunotherapies, others), cancer types (lung, breast, colorectal, blood, gynecologic, others), and end-users (hospitals, cancer centers, specialty clinics). Leading players such as Bayer AG, Novartis AG, and Amgen Inc. are profiled, alongside an examination of key market trends and future opportunities.
Cancer Biological Therapy Market Market Composition & Trends
The Cancer Biological Therapy market exhibits a moderately concentrated landscape, with a few dominant players holding significant market share. Innovation is a key driver, fueled by advancements in immunotherapy, targeted therapies, and personalized medicine. The regulatory environment plays a crucial role, impacting market access and drug approvals. Substitute products, including conventional chemotherapy and radiotherapy, pose competitive challenges. End-users are primarily hospitals, specialized cancer centers, and clinics, each with unique needs and procurement processes. M&A activity has been significant, with deal values reaching xx Million in recent years, primarily driven by strategic expansion and access to innovative technologies.
- Market Share Distribution: Top 5 players hold approximately xx% of the market share in 2025.
- M&A Deal Values: Total M&A deal value in 2024 estimated at xx Million.
- Key Innovation Catalysts: Advancements in immunotherapy, targeted therapies, and personalized medicine.
- Regulatory Landscape: Stringent regulatory approvals influence market entry and growth.
Cancer Biological Therapy Market Industry Evolution
The Cancer Biological Therapy market has witnessed robust growth over the past five years, driven by rising cancer incidence rates, increasing awareness of targeted therapies, and significant advancements in biological treatment approaches. The market experienced a Compound Annual Growth Rate (CAGR) of xx% between 2019 and 2024. Technological advancements, particularly in immunotherapy and personalized medicine, have significantly impacted treatment outcomes and patient survival rates. Shifting consumer demands for more effective and less toxic therapies are fueling the adoption of biological treatments. The market is expected to continue its upward trajectory, with a projected CAGR of xx% from 2025 to 2033. This growth is primarily driven by the increasing prevalence of various cancer types, the emergence of novel therapies, and expanding healthcare infrastructure globally. Adoption rates of biological therapies are gradually increasing, particularly in developed countries with robust healthcare systems.
Leading Regions, Countries, or Segments in Cancer Biological Therapy Market
North America currently dominates the Cancer Biological Therapy market, driven by high healthcare expenditure, advanced healthcare infrastructure, and early adoption of innovative therapies. Within therapy types, monoclonal antibodies hold the largest market share, owing to their high efficacy and relatively lower toxicity profiles compared to traditional chemotherapy. Lung cancer represents a significant segment within the cancer type category, reflecting its high prevalence and unmet medical needs.
- Key Drivers for North America Dominance: High healthcare expenditure, robust research & development activities, and early adoption of new therapies.
- Key Drivers for Monoclonal Antibodies Segment: High efficacy, relatively lower toxicity, and favorable regulatory approvals.
- Key Drivers for Lung Cancer Segment: High prevalence, significant unmet needs, and ongoing research focused on targeted therapies.
- Other Significant Regions: Europe, Asia-Pacific.
Cancer Biological Therapy Market Product Innovations
Recent innovations have focused on enhancing the efficacy and safety of biological therapies. This includes the development of novel drug conjugates, improved antibody engineering techniques, and the exploration of combination therapies to overcome treatment resistance. These advancements lead to improved patient outcomes, increased survival rates, and a better quality of life for cancer patients. Unique selling propositions center around enhanced efficacy, reduced toxicity profiles, and improved targeting mechanisms.
Propelling Factors for Cancer Biological Therapy Market Growth
Several factors propel the growth of the Cancer Biological Therapy market. Technological advancements in drug development are leading to more effective and targeted therapies. Increased cancer incidence rates globally drive demand for improved treatment options. Favorable regulatory environments, including accelerated approval pathways for promising new therapies, further support market growth. Finally, rising healthcare spending and increasing insurance coverage for cancer treatments contribute to market expansion.
Obstacles in the Cancer Biological Therapy Market Market
High drug prices and limited insurance coverage can limit access to these therapies, particularly in developing countries. Supply chain disruptions and manufacturing challenges can affect the availability and affordability of these drugs. Furthermore, intense competition among established pharmaceutical companies and the emergence of new players pose significant challenges. The regulatory landscape, although supportive in some areas, can also create hurdles for new drug approvals.
Future Opportunities in Cancer Biological Therapy Market
Emerging opportunities lie in the development of novel combination therapies, personalized medicine approaches, and the exploration of new targets for cancer treatment. Expansion into emerging markets with a growing cancer burden presents significant potential. Advancements in immunotherapy, particularly CAR T-cell therapy, offer promising avenues for future growth.
Major Players in the Cancer Biological Therapy Market Ecosystem
- Bayer AG
- Novartis AG
- Amgen Inc
- ImmunoGen Inc
- Merck & Co Inc
- F Hoffmann-La Roche Ltd
- Mirati Therapeutics Inc
- GlaxoSmithKline plc
- AstraZeneca plc
- Johnson & Johnson
- Bristol-Myers Squibb Company
- Pfizer Inc
Key Developments in Cancer Biological Therapy Market Industry
- December 2022: Genentech, Inc. received FDA approval for Tecentriq (atezolizumab) for adult and pediatric patients (≥2 years) with unresectable or metastatic alveolar soft part sarcoma (ASPS). This approval expands the treatment options for a rare and aggressive cancer type, significantly impacting the market.
- August 2022: AstraZeneca and Daiichi Sankyo's Enhertu (trastuzumab deruxtecan) received FDA approval for treating adult patients with unresectable or metastatic non-small cell lung cancer (NSCLC) with activating HER2 mutations. This approval significantly expands the use of Enhertu in a large patient population.
Strategic Cancer Biological Therapy Market Market Forecast
The Cancer Biological Therapy market is poised for continued growth, driven by ongoing technological advancements, increasing demand for effective cancer treatments, and expansion into new markets. The market's potential is vast, particularly given the increasing prevalence of cancer worldwide and the ongoing development of innovative therapeutic approaches. This presents significant opportunities for pharmaceutical companies and investors in the coming years.
Cancer Biological Therapy Market Segmentation
-
1. Therapy Type
- 1.1. Small Molecule Drugs
- 1.2. Monoclonal Antibodies
- 1.3. Immunotherapies
- 1.4. Others
-
2. Cancer Type
- 2.1. Lung Cancer
- 2.2. Breast Cancer
- 2.3. Colorectal Cancer
- 2.4. Blood Cancer
- 2.5. Gynecologic Cancer
- 2.6. Others
-
3. End User
- 3.1. Hospitals
- 3.2. Cancer and Radiation Therapy Centers
- 3.3. Specialty Clinics
Cancer Biological Therapy Market Segmentation By Geography
-
1. North America
- 1.1. United States
- 1.2. Canada
- 1.3. Mexico
-
2. Europe
- 2.1. Germany
- 2.2. United Kingdom
- 2.3. France
- 2.4. Italy
- 2.5. Spain
- 2.6. Rest of Europe
-
3. Asia Pacific
- 3.1. China
- 3.2. Japan
- 3.3. India
- 3.4. Australia
- 3.5. South Korea
- 3.6. Rest of Asia Pacific
-
4. Middle East and Africa
- 4.1. GCC
- 4.2. South Africa
- 4.3. Rest of Middle East and Africa
-
5. South America
- 5.1. Brazil
- 5.2. Argentina
- 5.3. Rest of South America
Cancer Biological Therapy Market REPORT HIGHLIGHTS
| Aspects | Details |
|---|---|
| Study Period | 2019-2033 |
| Base Year | 2024 |
| Estimated Year | 2025 |
| Forecast Period | 2025-2033 |
| Historical Period | 2019-2024 |
| Growth Rate | CAGR of 7.10% from 2019-2033 |
| Segmentation |
|
Table of Contents
- 1. Introduction
- 1.1. Research Scope
- 1.2. Market Segmentation
- 1.3. Research Methodology
- 1.4. Definitions and Assumptions
- 2. Executive Summary
- 2.1. Introduction
- 3. Market Dynamics
- 3.1. Introduction
- 3.2. Market Drivers
- 3.2.1. Increasing Prevalence of Various Type of Cancers; Increasing Investment in Research and Development
- 3.3. Market Restrains
- 3.3.1. High Cost and Side Effects Associated with the Targeted Therapies
- 3.4. Market Trends
- 3.4.1. Breast Cancer Segment is Expected to Register a High CAGR in the Market Over the Forecast Period
- 4. Market Factor Analysis
- 4.1. Porters Five Forces
- 4.2. Supply/Value Chain
- 4.3. PESTEL analysis
- 4.4. Market Entropy
- 4.5. Patent/Trademark Analysis
- 5. Global Cancer Biological Therapy Market Analysis, Insights and Forecast, 2019-2031
- 5.1. Market Analysis, Insights and Forecast - by Therapy Type
- 5.1.1. Small Molecule Drugs
- 5.1.2. Monoclonal Antibodies
- 5.1.3. Immunotherapies
- 5.1.4. Others
- 5.2. Market Analysis, Insights and Forecast - by Cancer Type
- 5.2.1. Lung Cancer
- 5.2.2. Breast Cancer
- 5.2.3. Colorectal Cancer
- 5.2.4. Blood Cancer
- 5.2.5. Gynecologic Cancer
- 5.2.6. Others
- 5.3. Market Analysis, Insights and Forecast - by End User
- 5.3.1. Hospitals
- 5.3.2. Cancer and Radiation Therapy Centers
- 5.3.3. Specialty Clinics
- 5.4. Market Analysis, Insights and Forecast - by Region
- 5.4.1. North America
- 5.4.2. Europe
- 5.4.3. Asia Pacific
- 5.4.4. Middle East and Africa
- 5.4.5. South America
- 5.1. Market Analysis, Insights and Forecast - by Therapy Type
- 6. North America Cancer Biological Therapy Market Analysis, Insights and Forecast, 2019-2031
- 6.1. Market Analysis, Insights and Forecast - by Therapy Type
- 6.1.1. Small Molecule Drugs
- 6.1.2. Monoclonal Antibodies
- 6.1.3. Immunotherapies
- 6.1.4. Others
- 6.2. Market Analysis, Insights and Forecast - by Cancer Type
- 6.2.1. Lung Cancer
- 6.2.2. Breast Cancer
- 6.2.3. Colorectal Cancer
- 6.2.4. Blood Cancer
- 6.2.5. Gynecologic Cancer
- 6.2.6. Others
- 6.3. Market Analysis, Insights and Forecast - by End User
- 6.3.1. Hospitals
- 6.3.2. Cancer and Radiation Therapy Centers
- 6.3.3. Specialty Clinics
- 6.1. Market Analysis, Insights and Forecast - by Therapy Type
- 7. Europe Cancer Biological Therapy Market Analysis, Insights and Forecast, 2019-2031
- 7.1. Market Analysis, Insights and Forecast - by Therapy Type
- 7.1.1. Small Molecule Drugs
- 7.1.2. Monoclonal Antibodies
- 7.1.3. Immunotherapies
- 7.1.4. Others
- 7.2. Market Analysis, Insights and Forecast - by Cancer Type
- 7.2.1. Lung Cancer
- 7.2.2. Breast Cancer
- 7.2.3. Colorectal Cancer
- 7.2.4. Blood Cancer
- 7.2.5. Gynecologic Cancer
- 7.2.6. Others
- 7.3. Market Analysis, Insights and Forecast - by End User
- 7.3.1. Hospitals
- 7.3.2. Cancer and Radiation Therapy Centers
- 7.3.3. Specialty Clinics
- 7.1. Market Analysis, Insights and Forecast - by Therapy Type
- 8. Asia Pacific Cancer Biological Therapy Market Analysis, Insights and Forecast, 2019-2031
- 8.1. Market Analysis, Insights and Forecast - by Therapy Type
- 8.1.1. Small Molecule Drugs
- 8.1.2. Monoclonal Antibodies
- 8.1.3. Immunotherapies
- 8.1.4. Others
- 8.2. Market Analysis, Insights and Forecast - by Cancer Type
- 8.2.1. Lung Cancer
- 8.2.2. Breast Cancer
- 8.2.3. Colorectal Cancer
- 8.2.4. Blood Cancer
- 8.2.5. Gynecologic Cancer
- 8.2.6. Others
- 8.3. Market Analysis, Insights and Forecast - by End User
- 8.3.1. Hospitals
- 8.3.2. Cancer and Radiation Therapy Centers
- 8.3.3. Specialty Clinics
- 8.1. Market Analysis, Insights and Forecast - by Therapy Type
- 9. Middle East and Africa Cancer Biological Therapy Market Analysis, Insights and Forecast, 2019-2031
- 9.1. Market Analysis, Insights and Forecast - by Therapy Type
- 9.1.1. Small Molecule Drugs
- 9.1.2. Monoclonal Antibodies
- 9.1.3. Immunotherapies
- 9.1.4. Others
- 9.2. Market Analysis, Insights and Forecast - by Cancer Type
- 9.2.1. Lung Cancer
- 9.2.2. Breast Cancer
- 9.2.3. Colorectal Cancer
- 9.2.4. Blood Cancer
- 9.2.5. Gynecologic Cancer
- 9.2.6. Others
- 9.3. Market Analysis, Insights and Forecast - by End User
- 9.3.1. Hospitals
- 9.3.2. Cancer and Radiation Therapy Centers
- 9.3.3. Specialty Clinics
- 9.1. Market Analysis, Insights and Forecast - by Therapy Type
- 10. South America Cancer Biological Therapy Market Analysis, Insights and Forecast, 2019-2031
- 10.1. Market Analysis, Insights and Forecast - by Therapy Type
- 10.1.1. Small Molecule Drugs
- 10.1.2. Monoclonal Antibodies
- 10.1.3. Immunotherapies
- 10.1.4. Others
- 10.2. Market Analysis, Insights and Forecast - by Cancer Type
- 10.2.1. Lung Cancer
- 10.2.2. Breast Cancer
- 10.2.3. Colorectal Cancer
- 10.2.4. Blood Cancer
- 10.2.5. Gynecologic Cancer
- 10.2.6. Others
- 10.3. Market Analysis, Insights and Forecast - by End User
- 10.3.1. Hospitals
- 10.3.2. Cancer and Radiation Therapy Centers
- 10.3.3. Specialty Clinics
- 10.1. Market Analysis, Insights and Forecast - by Therapy Type
- 11. North America Cancer Biological Therapy Market Analysis, Insights and Forecast, 2019-2031
- 11.1. Market Analysis, Insights and Forecast - By Country/Sub-region
- 11.1.1 United States
- 11.1.2 Canada
- 11.1.3 Mexico
- 12. Europe Cancer Biological Therapy Market Analysis, Insights and Forecast, 2019-2031
- 12.1. Market Analysis, Insights and Forecast - By Country/Sub-region
- 12.1.1 Germany
- 12.1.2 United Kingdom
- 12.1.3 France
- 12.1.4 Italy
- 12.1.5 Spain
- 12.1.6 Rest of Europe
- 13. Asia Pacific Cancer Biological Therapy Market Analysis, Insights and Forecast, 2019-2031
- 13.1. Market Analysis, Insights and Forecast - By Country/Sub-region
- 13.1.1 China
- 13.1.2 Japan
- 13.1.3 India
- 13.1.4 Australia
- 13.1.5 South Korea
- 13.1.6 Rest of Asia Pacific
- 14. Middle East and Africa Cancer Biological Therapy Market Analysis, Insights and Forecast, 2019-2031
- 14.1. Market Analysis, Insights and Forecast - By Country/Sub-region
- 14.1.1 GCC
- 14.1.2 South Africa
- 14.1.3 Rest of Middle East and Africa
- 15. South America Cancer Biological Therapy Market Analysis, Insights and Forecast, 2019-2031
- 15.1. Market Analysis, Insights and Forecast - By Country/Sub-region
- 15.1.1 Brazil
- 15.1.2 Argentina
- 15.1.3 Rest of South America
- 16. Competitive Analysis
- 16.1. Global Market Share Analysis 2024
- 16.2. Company Profiles
- 16.2.1 Bayer AG
- 16.2.1.1. Overview
- 16.2.1.2. Products
- 16.2.1.3. SWOT Analysis
- 16.2.1.4. Recent Developments
- 16.2.1.5. Financials (Based on Availability)
- 16.2.2 Novartis AG
- 16.2.2.1. Overview
- 16.2.2.2. Products
- 16.2.2.3. SWOT Analysis
- 16.2.2.4. Recent Developments
- 16.2.2.5. Financials (Based on Availability)
- 16.2.3 Amgen Inc
- 16.2.3.1. Overview
- 16.2.3.2. Products
- 16.2.3.3. SWOT Analysis
- 16.2.3.4. Recent Developments
- 16.2.3.5. Financials (Based on Availability)
- 16.2.4 ImmunoGen Inc
- 16.2.4.1. Overview
- 16.2.4.2. Products
- 16.2.4.3. SWOT Analysis
- 16.2.4.4. Recent Developments
- 16.2.4.5. Financials (Based on Availability)
- 16.2.5 Merck & Co Inc
- 16.2.5.1. Overview
- 16.2.5.2. Products
- 16.2.5.3. SWOT Analysis
- 16.2.5.4. Recent Developments
- 16.2.5.5. Financials (Based on Availability)
- 16.2.6 F Hoffmann-La Roche Ltd
- 16.2.6.1. Overview
- 16.2.6.2. Products
- 16.2.6.3. SWOT Analysis
- 16.2.6.4. Recent Developments
- 16.2.6.5. Financials (Based on Availability)
- 16.2.7 Mirati Therapeutics Inc
- 16.2.7.1. Overview
- 16.2.7.2. Products
- 16.2.7.3. SWOT Analysis
- 16.2.7.4. Recent Developments
- 16.2.7.5. Financials (Based on Availability)
- 16.2.8 GlaxoSmithKline plc
- 16.2.8.1. Overview
- 16.2.8.2. Products
- 16.2.8.3. SWOT Analysis
- 16.2.8.4. Recent Developments
- 16.2.8.5. Financials (Based on Availability)
- 16.2.9 AstraZeneca plc
- 16.2.9.1. Overview
- 16.2.9.2. Products
- 16.2.9.3. SWOT Analysis
- 16.2.9.4. Recent Developments
- 16.2.9.5. Financials (Based on Availability)
- 16.2.10 Johnson & Johnson
- 16.2.10.1. Overview
- 16.2.10.2. Products
- 16.2.10.3. SWOT Analysis
- 16.2.10.4. Recent Developments
- 16.2.10.5. Financials (Based on Availability)
- 16.2.11 Bristol-Myers Squibb Company
- 16.2.11.1. Overview
- 16.2.11.2. Products
- 16.2.11.3. SWOT Analysis
- 16.2.11.4. Recent Developments
- 16.2.11.5. Financials (Based on Availability)
- 16.2.12 Pfizer Inc
- 16.2.12.1. Overview
- 16.2.12.2. Products
- 16.2.12.3. SWOT Analysis
- 16.2.12.4. Recent Developments
- 16.2.12.5. Financials (Based on Availability)
- 16.2.1 Bayer AG
List of Figures
- Figure 1: Global Cancer Biological Therapy Market Revenue Breakdown (Million, %) by Region 2024 & 2032
- Figure 2: Global Cancer Biological Therapy Market Volume Breakdown (K Unit, %) by Region 2024 & 2032
- Figure 3: North America Cancer Biological Therapy Market Revenue (Million), by Country 2024 & 2032
- Figure 4: North America Cancer Biological Therapy Market Volume (K Unit), by Country 2024 & 2032
- Figure 5: North America Cancer Biological Therapy Market Revenue Share (%), by Country 2024 & 2032
- Figure 6: North America Cancer Biological Therapy Market Volume Share (%), by Country 2024 & 2032
- Figure 7: Europe Cancer Biological Therapy Market Revenue (Million), by Country 2024 & 2032
- Figure 8: Europe Cancer Biological Therapy Market Volume (K Unit), by Country 2024 & 2032
- Figure 9: Europe Cancer Biological Therapy Market Revenue Share (%), by Country 2024 & 2032
- Figure 10: Europe Cancer Biological Therapy Market Volume Share (%), by Country 2024 & 2032
- Figure 11: Asia Pacific Cancer Biological Therapy Market Revenue (Million), by Country 2024 & 2032
- Figure 12: Asia Pacific Cancer Biological Therapy Market Volume (K Unit), by Country 2024 & 2032
- Figure 13: Asia Pacific Cancer Biological Therapy Market Revenue Share (%), by Country 2024 & 2032
- Figure 14: Asia Pacific Cancer Biological Therapy Market Volume Share (%), by Country 2024 & 2032
- Figure 15: Middle East and Africa Cancer Biological Therapy Market Revenue (Million), by Country 2024 & 2032
- Figure 16: Middle East and Africa Cancer Biological Therapy Market Volume (K Unit), by Country 2024 & 2032
- Figure 17: Middle East and Africa Cancer Biological Therapy Market Revenue Share (%), by Country 2024 & 2032
- Figure 18: Middle East and Africa Cancer Biological Therapy Market Volume Share (%), by Country 2024 & 2032
- Figure 19: South America Cancer Biological Therapy Market Revenue (Million), by Country 2024 & 2032
- Figure 20: South America Cancer Biological Therapy Market Volume (K Unit), by Country 2024 & 2032
- Figure 21: South America Cancer Biological Therapy Market Revenue Share (%), by Country 2024 & 2032
- Figure 22: South America Cancer Biological Therapy Market Volume Share (%), by Country 2024 & 2032
- Figure 23: North America Cancer Biological Therapy Market Revenue (Million), by Therapy Type 2024 & 2032
- Figure 24: North America Cancer Biological Therapy Market Volume (K Unit), by Therapy Type 2024 & 2032
- Figure 25: North America Cancer Biological Therapy Market Revenue Share (%), by Therapy Type 2024 & 2032
- Figure 26: North America Cancer Biological Therapy Market Volume Share (%), by Therapy Type 2024 & 2032
- Figure 27: North America Cancer Biological Therapy Market Revenue (Million), by Cancer Type 2024 & 2032
- Figure 28: North America Cancer Biological Therapy Market Volume (K Unit), by Cancer Type 2024 & 2032
- Figure 29: North America Cancer Biological Therapy Market Revenue Share (%), by Cancer Type 2024 & 2032
- Figure 30: North America Cancer Biological Therapy Market Volume Share (%), by Cancer Type 2024 & 2032
- Figure 31: North America Cancer Biological Therapy Market Revenue (Million), by End User 2024 & 2032
- Figure 32: North America Cancer Biological Therapy Market Volume (K Unit), by End User 2024 & 2032
- Figure 33: North America Cancer Biological Therapy Market Revenue Share (%), by End User 2024 & 2032
- Figure 34: North America Cancer Biological Therapy Market Volume Share (%), by End User 2024 & 2032
- Figure 35: North America Cancer Biological Therapy Market Revenue (Million), by Country 2024 & 2032
- Figure 36: North America Cancer Biological Therapy Market Volume (K Unit), by Country 2024 & 2032
- Figure 37: North America Cancer Biological Therapy Market Revenue Share (%), by Country 2024 & 2032
- Figure 38: North America Cancer Biological Therapy Market Volume Share (%), by Country 2024 & 2032
- Figure 39: Europe Cancer Biological Therapy Market Revenue (Million), by Therapy Type 2024 & 2032
- Figure 40: Europe Cancer Biological Therapy Market Volume (K Unit), by Therapy Type 2024 & 2032
- Figure 41: Europe Cancer Biological Therapy Market Revenue Share (%), by Therapy Type 2024 & 2032
- Figure 42: Europe Cancer Biological Therapy Market Volume Share (%), by Therapy Type 2024 & 2032
- Figure 43: Europe Cancer Biological Therapy Market Revenue (Million), by Cancer Type 2024 & 2032
- Figure 44: Europe Cancer Biological Therapy Market Volume (K Unit), by Cancer Type 2024 & 2032
- Figure 45: Europe Cancer Biological Therapy Market Revenue Share (%), by Cancer Type 2024 & 2032
- Figure 46: Europe Cancer Biological Therapy Market Volume Share (%), by Cancer Type 2024 & 2032
- Figure 47: Europe Cancer Biological Therapy Market Revenue (Million), by End User 2024 & 2032
- Figure 48: Europe Cancer Biological Therapy Market Volume (K Unit), by End User 2024 & 2032
- Figure 49: Europe Cancer Biological Therapy Market Revenue Share (%), by End User 2024 & 2032
- Figure 50: Europe Cancer Biological Therapy Market Volume Share (%), by End User 2024 & 2032
- Figure 51: Europe Cancer Biological Therapy Market Revenue (Million), by Country 2024 & 2032
- Figure 52: Europe Cancer Biological Therapy Market Volume (K Unit), by Country 2024 & 2032
- Figure 53: Europe Cancer Biological Therapy Market Revenue Share (%), by Country 2024 & 2032
- Figure 54: Europe Cancer Biological Therapy Market Volume Share (%), by Country 2024 & 2032
- Figure 55: Asia Pacific Cancer Biological Therapy Market Revenue (Million), by Therapy Type 2024 & 2032
- Figure 56: Asia Pacific Cancer Biological Therapy Market Volume (K Unit), by Therapy Type 2024 & 2032
- Figure 57: Asia Pacific Cancer Biological Therapy Market Revenue Share (%), by Therapy Type 2024 & 2032
- Figure 58: Asia Pacific Cancer Biological Therapy Market Volume Share (%), by Therapy Type 2024 & 2032
- Figure 59: Asia Pacific Cancer Biological Therapy Market Revenue (Million), by Cancer Type 2024 & 2032
- Figure 60: Asia Pacific Cancer Biological Therapy Market Volume (K Unit), by Cancer Type 2024 & 2032
- Figure 61: Asia Pacific Cancer Biological Therapy Market Revenue Share (%), by Cancer Type 2024 & 2032
- Figure 62: Asia Pacific Cancer Biological Therapy Market Volume Share (%), by Cancer Type 2024 & 2032
- Figure 63: Asia Pacific Cancer Biological Therapy Market Revenue (Million), by End User 2024 & 2032
- Figure 64: Asia Pacific Cancer Biological Therapy Market Volume (K Unit), by End User 2024 & 2032
- Figure 65: Asia Pacific Cancer Biological Therapy Market Revenue Share (%), by End User 2024 & 2032
- Figure 66: Asia Pacific Cancer Biological Therapy Market Volume Share (%), by End User 2024 & 2032
- Figure 67: Asia Pacific Cancer Biological Therapy Market Revenue (Million), by Country 2024 & 2032
- Figure 68: Asia Pacific Cancer Biological Therapy Market Volume (K Unit), by Country 2024 & 2032
- Figure 69: Asia Pacific Cancer Biological Therapy Market Revenue Share (%), by Country 2024 & 2032
- Figure 70: Asia Pacific Cancer Biological Therapy Market Volume Share (%), by Country 2024 & 2032
- Figure 71: Middle East and Africa Cancer Biological Therapy Market Revenue (Million), by Therapy Type 2024 & 2032
- Figure 72: Middle East and Africa Cancer Biological Therapy Market Volume (K Unit), by Therapy Type 2024 & 2032
- Figure 73: Middle East and Africa Cancer Biological Therapy Market Revenue Share (%), by Therapy Type 2024 & 2032
- Figure 74: Middle East and Africa Cancer Biological Therapy Market Volume Share (%), by Therapy Type 2024 & 2032
- Figure 75: Middle East and Africa Cancer Biological Therapy Market Revenue (Million), by Cancer Type 2024 & 2032
- Figure 76: Middle East and Africa Cancer Biological Therapy Market Volume (K Unit), by Cancer Type 2024 & 2032
- Figure 77: Middle East and Africa Cancer Biological Therapy Market Revenue Share (%), by Cancer Type 2024 & 2032
- Figure 78: Middle East and Africa Cancer Biological Therapy Market Volume Share (%), by Cancer Type 2024 & 2032
- Figure 79: Middle East and Africa Cancer Biological Therapy Market Revenue (Million), by End User 2024 & 2032
- Figure 80: Middle East and Africa Cancer Biological Therapy Market Volume (K Unit), by End User 2024 & 2032
- Figure 81: Middle East and Africa Cancer Biological Therapy Market Revenue Share (%), by End User 2024 & 2032
- Figure 82: Middle East and Africa Cancer Biological Therapy Market Volume Share (%), by End User 2024 & 2032
- Figure 83: Middle East and Africa Cancer Biological Therapy Market Revenue (Million), by Country 2024 & 2032
- Figure 84: Middle East and Africa Cancer Biological Therapy Market Volume (K Unit), by Country 2024 & 2032
- Figure 85: Middle East and Africa Cancer Biological Therapy Market Revenue Share (%), by Country 2024 & 2032
- Figure 86: Middle East and Africa Cancer Biological Therapy Market Volume Share (%), by Country 2024 & 2032
- Figure 87: South America Cancer Biological Therapy Market Revenue (Million), by Therapy Type 2024 & 2032
- Figure 88: South America Cancer Biological Therapy Market Volume (K Unit), by Therapy Type 2024 & 2032
- Figure 89: South America Cancer Biological Therapy Market Revenue Share (%), by Therapy Type 2024 & 2032
- Figure 90: South America Cancer Biological Therapy Market Volume Share (%), by Therapy Type 2024 & 2032
- Figure 91: South America Cancer Biological Therapy Market Revenue (Million), by Cancer Type 2024 & 2032
- Figure 92: South America Cancer Biological Therapy Market Volume (K Unit), by Cancer Type 2024 & 2032
- Figure 93: South America Cancer Biological Therapy Market Revenue Share (%), by Cancer Type 2024 & 2032
- Figure 94: South America Cancer Biological Therapy Market Volume Share (%), by Cancer Type 2024 & 2032
- Figure 95: South America Cancer Biological Therapy Market Revenue (Million), by End User 2024 & 2032
- Figure 96: South America Cancer Biological Therapy Market Volume (K Unit), by End User 2024 & 2032
- Figure 97: South America Cancer Biological Therapy Market Revenue Share (%), by End User 2024 & 2032
- Figure 98: South America Cancer Biological Therapy Market Volume Share (%), by End User 2024 & 2032
- Figure 99: South America Cancer Biological Therapy Market Revenue (Million), by Country 2024 & 2032
- Figure 100: South America Cancer Biological Therapy Market Volume (K Unit), by Country 2024 & 2032
- Figure 101: South America Cancer Biological Therapy Market Revenue Share (%), by Country 2024 & 2032
- Figure 102: South America Cancer Biological Therapy Market Volume Share (%), by Country 2024 & 2032
List of Tables
- Table 1: Global Cancer Biological Therapy Market Revenue Million Forecast, by Region 2019 & 2032
- Table 2: Global Cancer Biological Therapy Market Volume K Unit Forecast, by Region 2019 & 2032
- Table 3: Global Cancer Biological Therapy Market Revenue Million Forecast, by Therapy Type 2019 & 2032
- Table 4: Global Cancer Biological Therapy Market Volume K Unit Forecast, by Therapy Type 2019 & 2032
- Table 5: Global Cancer Biological Therapy Market Revenue Million Forecast, by Cancer Type 2019 & 2032
- Table 6: Global Cancer Biological Therapy Market Volume K Unit Forecast, by Cancer Type 2019 & 2032
- Table 7: Global Cancer Biological Therapy Market Revenue Million Forecast, by End User 2019 & 2032
- Table 8: Global Cancer Biological Therapy Market Volume K Unit Forecast, by End User 2019 & 2032
- Table 9: Global Cancer Biological Therapy Market Revenue Million Forecast, by Region 2019 & 2032
- Table 10: Global Cancer Biological Therapy Market Volume K Unit Forecast, by Region 2019 & 2032
- Table 11: Global Cancer Biological Therapy Market Revenue Million Forecast, by Country 2019 & 2032
- Table 12: Global Cancer Biological Therapy Market Volume K Unit Forecast, by Country 2019 & 2032
- Table 13: United States Cancer Biological Therapy Market Revenue (Million) Forecast, by Application 2019 & 2032
- Table 14: United States Cancer Biological Therapy Market Volume (K Unit) Forecast, by Application 2019 & 2032
- Table 15: Canada Cancer Biological Therapy Market Revenue (Million) Forecast, by Application 2019 & 2032
- Table 16: Canada Cancer Biological Therapy Market Volume (K Unit) Forecast, by Application 2019 & 2032
- Table 17: Mexico Cancer Biological Therapy Market Revenue (Million) Forecast, by Application 2019 & 2032
- Table 18: Mexico Cancer Biological Therapy Market Volume (K Unit) Forecast, by Application 2019 & 2032
- Table 19: Global Cancer Biological Therapy Market Revenue Million Forecast, by Country 2019 & 2032
- Table 20: Global Cancer Biological Therapy Market Volume K Unit Forecast, by Country 2019 & 2032
- Table 21: Germany Cancer Biological Therapy Market Revenue (Million) Forecast, by Application 2019 & 2032
- Table 22: Germany Cancer Biological Therapy Market Volume (K Unit) Forecast, by Application 2019 & 2032
- Table 23: United Kingdom Cancer Biological Therapy Market Revenue (Million) Forecast, by Application 2019 & 2032
- Table 24: United Kingdom Cancer Biological Therapy Market Volume (K Unit) Forecast, by Application 2019 & 2032
- Table 25: France Cancer Biological Therapy Market Revenue (Million) Forecast, by Application 2019 & 2032
- Table 26: France Cancer Biological Therapy Market Volume (K Unit) Forecast, by Application 2019 & 2032
- Table 27: Italy Cancer Biological Therapy Market Revenue (Million) Forecast, by Application 2019 & 2032
- Table 28: Italy Cancer Biological Therapy Market Volume (K Unit) Forecast, by Application 2019 & 2032
- Table 29: Spain Cancer Biological Therapy Market Revenue (Million) Forecast, by Application 2019 & 2032
- Table 30: Spain Cancer Biological Therapy Market Volume (K Unit) Forecast, by Application 2019 & 2032
- Table 31: Rest of Europe Cancer Biological Therapy Market Revenue (Million) Forecast, by Application 2019 & 2032
- Table 32: Rest of Europe Cancer Biological Therapy Market Volume (K Unit) Forecast, by Application 2019 & 2032
- Table 33: Global Cancer Biological Therapy Market Revenue Million Forecast, by Country 2019 & 2032
- Table 34: Global Cancer Biological Therapy Market Volume K Unit Forecast, by Country 2019 & 2032
- Table 35: China Cancer Biological Therapy Market Revenue (Million) Forecast, by Application 2019 & 2032
- Table 36: China Cancer Biological Therapy Market Volume (K Unit) Forecast, by Application 2019 & 2032
- Table 37: Japan Cancer Biological Therapy Market Revenue (Million) Forecast, by Application 2019 & 2032
- Table 38: Japan Cancer Biological Therapy Market Volume (K Unit) Forecast, by Application 2019 & 2032
- Table 39: India Cancer Biological Therapy Market Revenue (Million) Forecast, by Application 2019 & 2032
- Table 40: India Cancer Biological Therapy Market Volume (K Unit) Forecast, by Application 2019 & 2032
- Table 41: Australia Cancer Biological Therapy Market Revenue (Million) Forecast, by Application 2019 & 2032
- Table 42: Australia Cancer Biological Therapy Market Volume (K Unit) Forecast, by Application 2019 & 2032
- Table 43: South Korea Cancer Biological Therapy Market Revenue (Million) Forecast, by Application 2019 & 2032
- Table 44: South Korea Cancer Biological Therapy Market Volume (K Unit) Forecast, by Application 2019 & 2032
- Table 45: Rest of Asia Pacific Cancer Biological Therapy Market Revenue (Million) Forecast, by Application 2019 & 2032
- Table 46: Rest of Asia Pacific Cancer Biological Therapy Market Volume (K Unit) Forecast, by Application 2019 & 2032
- Table 47: Global Cancer Biological Therapy Market Revenue Million Forecast, by Country 2019 & 2032
- Table 48: Global Cancer Biological Therapy Market Volume K Unit Forecast, by Country 2019 & 2032
- Table 49: GCC Cancer Biological Therapy Market Revenue (Million) Forecast, by Application 2019 & 2032
- Table 50: GCC Cancer Biological Therapy Market Volume (K Unit) Forecast, by Application 2019 & 2032
- Table 51: South Africa Cancer Biological Therapy Market Revenue (Million) Forecast, by Application 2019 & 2032
- Table 52: South Africa Cancer Biological Therapy Market Volume (K Unit) Forecast, by Application 2019 & 2032
- Table 53: Rest of Middle East and Africa Cancer Biological Therapy Market Revenue (Million) Forecast, by Application 2019 & 2032
- Table 54: Rest of Middle East and Africa Cancer Biological Therapy Market Volume (K Unit) Forecast, by Application 2019 & 2032
- Table 55: Global Cancer Biological Therapy Market Revenue Million Forecast, by Country 2019 & 2032
- Table 56: Global Cancer Biological Therapy Market Volume K Unit Forecast, by Country 2019 & 2032
- Table 57: Brazil Cancer Biological Therapy Market Revenue (Million) Forecast, by Application 2019 & 2032
- Table 58: Brazil Cancer Biological Therapy Market Volume (K Unit) Forecast, by Application 2019 & 2032
- Table 59: Argentina Cancer Biological Therapy Market Revenue (Million) Forecast, by Application 2019 & 2032
- Table 60: Argentina Cancer Biological Therapy Market Volume (K Unit) Forecast, by Application 2019 & 2032
- Table 61: Rest of South America Cancer Biological Therapy Market Revenue (Million) Forecast, by Application 2019 & 2032
- Table 62: Rest of South America Cancer Biological Therapy Market Volume (K Unit) Forecast, by Application 2019 & 2032
- Table 63: Global Cancer Biological Therapy Market Revenue Million Forecast, by Therapy Type 2019 & 2032
- Table 64: Global Cancer Biological Therapy Market Volume K Unit Forecast, by Therapy Type 2019 & 2032
- Table 65: Global Cancer Biological Therapy Market Revenue Million Forecast, by Cancer Type 2019 & 2032
- Table 66: Global Cancer Biological Therapy Market Volume K Unit Forecast, by Cancer Type 2019 & 2032
- Table 67: Global Cancer Biological Therapy Market Revenue Million Forecast, by End User 2019 & 2032
- Table 68: Global Cancer Biological Therapy Market Volume K Unit Forecast, by End User 2019 & 2032
- Table 69: Global Cancer Biological Therapy Market Revenue Million Forecast, by Country 2019 & 2032
- Table 70: Global Cancer Biological Therapy Market Volume K Unit Forecast, by Country 2019 & 2032
- Table 71: United States Cancer Biological Therapy Market Revenue (Million) Forecast, by Application 2019 & 2032
- Table 72: United States Cancer Biological Therapy Market Volume (K Unit) Forecast, by Application 2019 & 2032
- Table 73: Canada Cancer Biological Therapy Market Revenue (Million) Forecast, by Application 2019 & 2032
- Table 74: Canada Cancer Biological Therapy Market Volume (K Unit) Forecast, by Application 2019 & 2032
- Table 75: Mexico Cancer Biological Therapy Market Revenue (Million) Forecast, by Application 2019 & 2032
- Table 76: Mexico Cancer Biological Therapy Market Volume (K Unit) Forecast, by Application 2019 & 2032
- Table 77: Global Cancer Biological Therapy Market Revenue Million Forecast, by Therapy Type 2019 & 2032
- Table 78: Global Cancer Biological Therapy Market Volume K Unit Forecast, by Therapy Type 2019 & 2032
- Table 79: Global Cancer Biological Therapy Market Revenue Million Forecast, by Cancer Type 2019 & 2032
- Table 80: Global Cancer Biological Therapy Market Volume K Unit Forecast, by Cancer Type 2019 & 2032
- Table 81: Global Cancer Biological Therapy Market Revenue Million Forecast, by End User 2019 & 2032
- Table 82: Global Cancer Biological Therapy Market Volume K Unit Forecast, by End User 2019 & 2032
- Table 83: Global Cancer Biological Therapy Market Revenue Million Forecast, by Country 2019 & 2032
- Table 84: Global Cancer Biological Therapy Market Volume K Unit Forecast, by Country 2019 & 2032
- Table 85: Germany Cancer Biological Therapy Market Revenue (Million) Forecast, by Application 2019 & 2032
- Table 86: Germany Cancer Biological Therapy Market Volume (K Unit) Forecast, by Application 2019 & 2032
- Table 87: United Kingdom Cancer Biological Therapy Market Revenue (Million) Forecast, by Application 2019 & 2032
- Table 88: United Kingdom Cancer Biological Therapy Market Volume (K Unit) Forecast, by Application 2019 & 2032
- Table 89: France Cancer Biological Therapy Market Revenue (Million) Forecast, by Application 2019 & 2032
- Table 90: France Cancer Biological Therapy Market Volume (K Unit) Forecast, by Application 2019 & 2032
- Table 91: Italy Cancer Biological Therapy Market Revenue (Million) Forecast, by Application 2019 & 2032
- Table 92: Italy Cancer Biological Therapy Market Volume (K Unit) Forecast, by Application 2019 & 2032
- Table 93: Spain Cancer Biological Therapy Market Revenue (Million) Forecast, by Application 2019 & 2032
- Table 94: Spain Cancer Biological Therapy Market Volume (K Unit) Forecast, by Application 2019 & 2032
- Table 95: Rest of Europe Cancer Biological Therapy Market Revenue (Million) Forecast, by Application 2019 & 2032
- Table 96: Rest of Europe Cancer Biological Therapy Market Volume (K Unit) Forecast, by Application 2019 & 2032
- Table 97: Global Cancer Biological Therapy Market Revenue Million Forecast, by Therapy Type 2019 & 2032
- Table 98: Global Cancer Biological Therapy Market Volume K Unit Forecast, by Therapy Type 2019 & 2032
- Table 99: Global Cancer Biological Therapy Market Revenue Million Forecast, by Cancer Type 2019 & 2032
- Table 100: Global Cancer Biological Therapy Market Volume K Unit Forecast, by Cancer Type 2019 & 2032
- Table 101: Global Cancer Biological Therapy Market Revenue Million Forecast, by End User 2019 & 2032
- Table 102: Global Cancer Biological Therapy Market Volume K Unit Forecast, by End User 2019 & 2032
- Table 103: Global Cancer Biological Therapy Market Revenue Million Forecast, by Country 2019 & 2032
- Table 104: Global Cancer Biological Therapy Market Volume K Unit Forecast, by Country 2019 & 2032
- Table 105: China Cancer Biological Therapy Market Revenue (Million) Forecast, by Application 2019 & 2032
- Table 106: China Cancer Biological Therapy Market Volume (K Unit) Forecast, by Application 2019 & 2032
- Table 107: Japan Cancer Biological Therapy Market Revenue (Million) Forecast, by Application 2019 & 2032
- Table 108: Japan Cancer Biological Therapy Market Volume (K Unit) Forecast, by Application 2019 & 2032
- Table 109: India Cancer Biological Therapy Market Revenue (Million) Forecast, by Application 2019 & 2032
- Table 110: India Cancer Biological Therapy Market Volume (K Unit) Forecast, by Application 2019 & 2032
- Table 111: Australia Cancer Biological Therapy Market Revenue (Million) Forecast, by Application 2019 & 2032
- Table 112: Australia Cancer Biological Therapy Market Volume (K Unit) Forecast, by Application 2019 & 2032
- Table 113: South Korea Cancer Biological Therapy Market Revenue (Million) Forecast, by Application 2019 & 2032
- Table 114: South Korea Cancer Biological Therapy Market Volume (K Unit) Forecast, by Application 2019 & 2032
- Table 115: Rest of Asia Pacific Cancer Biological Therapy Market Revenue (Million) Forecast, by Application 2019 & 2032
- Table 116: Rest of Asia Pacific Cancer Biological Therapy Market Volume (K Unit) Forecast, by Application 2019 & 2032
- Table 117: Global Cancer Biological Therapy Market Revenue Million Forecast, by Therapy Type 2019 & 2032
- Table 118: Global Cancer Biological Therapy Market Volume K Unit Forecast, by Therapy Type 2019 & 2032
- Table 119: Global Cancer Biological Therapy Market Revenue Million Forecast, by Cancer Type 2019 & 2032
- Table 120: Global Cancer Biological Therapy Market Volume K Unit Forecast, by Cancer Type 2019 & 2032
- Table 121: Global Cancer Biological Therapy Market Revenue Million Forecast, by End User 2019 & 2032
- Table 122: Global Cancer Biological Therapy Market Volume K Unit Forecast, by End User 2019 & 2032
- Table 123: Global Cancer Biological Therapy Market Revenue Million Forecast, by Country 2019 & 2032
- Table 124: Global Cancer Biological Therapy Market Volume K Unit Forecast, by Country 2019 & 2032
- Table 125: GCC Cancer Biological Therapy Market Revenue (Million) Forecast, by Application 2019 & 2032
- Table 126: GCC Cancer Biological Therapy Market Volume (K Unit) Forecast, by Application 2019 & 2032
- Table 127: South Africa Cancer Biological Therapy Market Revenue (Million) Forecast, by Application 2019 & 2032
- Table 128: South Africa Cancer Biological Therapy Market Volume (K Unit) Forecast, by Application 2019 & 2032
- Table 129: Rest of Middle East and Africa Cancer Biological Therapy Market Revenue (Million) Forecast, by Application 2019 & 2032
- Table 130: Rest of Middle East and Africa Cancer Biological Therapy Market Volume (K Unit) Forecast, by Application 2019 & 2032
- Table 131: Global Cancer Biological Therapy Market Revenue Million Forecast, by Therapy Type 2019 & 2032
- Table 132: Global Cancer Biological Therapy Market Volume K Unit Forecast, by Therapy Type 2019 & 2032
- Table 133: Global Cancer Biological Therapy Market Revenue Million Forecast, by Cancer Type 2019 & 2032
- Table 134: Global Cancer Biological Therapy Market Volume K Unit Forecast, by Cancer Type 2019 & 2032
- Table 135: Global Cancer Biological Therapy Market Revenue Million Forecast, by End User 2019 & 2032
- Table 136: Global Cancer Biological Therapy Market Volume K Unit Forecast, by End User 2019 & 2032
- Table 137: Global Cancer Biological Therapy Market Revenue Million Forecast, by Country 2019 & 2032
- Table 138: Global Cancer Biological Therapy Market Volume K Unit Forecast, by Country 2019 & 2032
- Table 139: Brazil Cancer Biological Therapy Market Revenue (Million) Forecast, by Application 2019 & 2032
- Table 140: Brazil Cancer Biological Therapy Market Volume (K Unit) Forecast, by Application 2019 & 2032
- Table 141: Argentina Cancer Biological Therapy Market Revenue (Million) Forecast, by Application 2019 & 2032
- Table 142: Argentina Cancer Biological Therapy Market Volume (K Unit) Forecast, by Application 2019 & 2032
- Table 143: Rest of South America Cancer Biological Therapy Market Revenue (Million) Forecast, by Application 2019 & 2032
- Table 144: Rest of South America Cancer Biological Therapy Market Volume (K Unit) Forecast, by Application 2019 & 2032
Frequently Asked Questions
1. What is the projected Compound Annual Growth Rate (CAGR) of the Cancer Biological Therapy Market?
The projected CAGR is approximately 7.10%.
2. Which companies are prominent players in the Cancer Biological Therapy Market?
Key companies in the market include Bayer AG, Novartis AG, Amgen Inc, ImmunoGen Inc, Merck & Co Inc, F Hoffmann-La Roche Ltd, Mirati Therapeutics Inc, GlaxoSmithKline plc, AstraZeneca plc, Johnson & Johnson, Bristol-Myers Squibb Company, Pfizer Inc.
3. What are the main segments of the Cancer Biological Therapy Market?
The market segments include Therapy Type, Cancer Type, End User.
4. Can you provide details about the market size?
The market size is estimated to be USD XX Million as of 2022.
5. What are some drivers contributing to market growth?
Increasing Prevalence of Various Type of Cancers; Increasing Investment in Research and Development.
6. What are the notable trends driving market growth?
Breast Cancer Segment is Expected to Register a High CAGR in the Market Over the Forecast Period.
7. Are there any restraints impacting market growth?
High Cost and Side Effects Associated with the Targeted Therapies.
8. Can you provide examples of recent developments in the market?
December 2022: Genentech, Inc received approval from United States FDA for Tecentriq (atezolizumab) for adult and pediatric patients two years of age and older with unresectable or metastatic alveolar soft part sarcoma (ASPS).
9. What pricing options are available for accessing the report?
Pricing options include single-user, multi-user, and enterprise licenses priced at USD 4750, USD 5250, and USD 8750 respectively.
10. Is the market size provided in terms of value or volume?
The market size is provided in terms of value, measured in Million and volume, measured in K Unit.
11. Are there any specific market keywords associated with the report?
Yes, the market keyword associated with the report is "Cancer Biological Therapy Market," which aids in identifying and referencing the specific market segment covered.
12. How do I determine which pricing option suits my needs best?
The pricing options vary based on user requirements and access needs. Individual users may opt for single-user licenses, while businesses requiring broader access may choose multi-user or enterprise licenses for cost-effective access to the report.
13. Are there any additional resources or data provided in the Cancer Biological Therapy Market report?
While the report offers comprehensive insights, it's advisable to review the specific contents or supplementary materials provided to ascertain if additional resources or data are available.
14. How can I stay updated on further developments or reports in the Cancer Biological Therapy Market?
To stay informed about further developments, trends, and reports in the Cancer Biological Therapy Market, consider subscribing to industry newsletters, following relevant companies and organizations, or regularly checking reputable industry news sources and publications.
Methodology
Step 1 - Identification of Relevant Samples Size from Population Database


Step 2 - Approaches for Defining Global Market Size (Value, Volume* & Price*)

Note*: In applicable scenarios
Step 3 - Data Sources
Primary Research
- Web Analytics
- Survey Reports
- Research Institute
- Latest Research Reports
- Opinion Leaders
Secondary Research
- Annual Reports
- White Paper
- Latest Press Release
- Industry Association
- Paid Database
- Investor Presentations

Step 4 - Data Triangulation
Involves using different sources of information in order to increase the validity of a study
These sources are likely to be stakeholders in a program - participants, other researchers, program staff, other community members, and so on.
Then we put all data in single framework & apply various statistical tools to find out the dynamic on the market.
During the analysis stage, feedback from the stakeholder groups would be compared to determine areas of agreement as well as areas of divergence
