

Key Insights
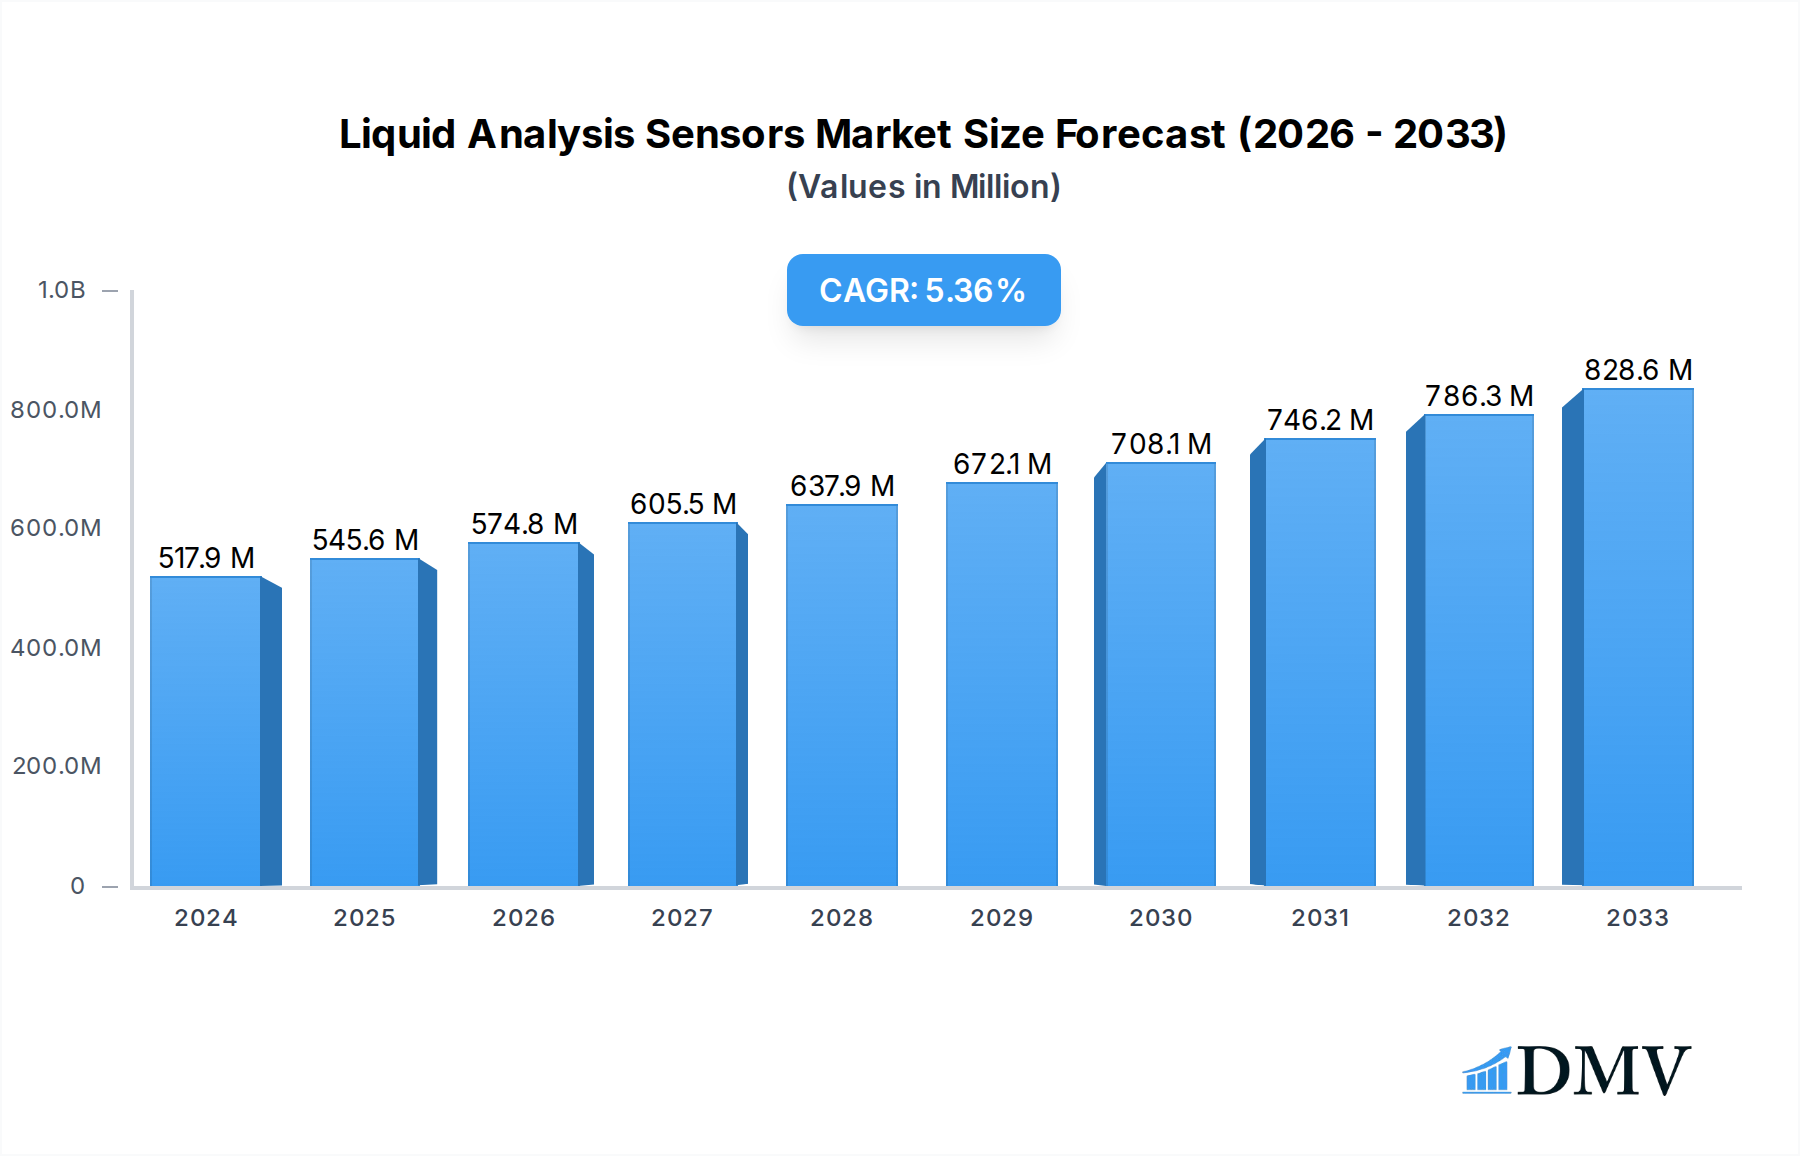
The global market for liquid analysis sensors is poised for significant expansion, driven by an increasing demand for precise and reliable water quality monitoring across various industries. The market, valued at an estimated $517.93 million in 2024, is projected to grow at a Compound Annual Growth Rate (CAGR) of 5.4% through 2033. This robust growth is fueled by stringent environmental regulations, the growing need for process optimization in manufacturing, and advancements in sensor technology leading to more accurate and cost-effective solutions. Key applications benefiting from this trend include energy, refining, food and beverage, pharmaceuticals, and water treatment, where real-time data is crucial for maintaining compliance, ensuring product quality, and enhancing operational efficiency.

Liquid Analysis Sensors Market Size (In Million)
The market segmentation reveals a strong demand for both single and multiple parameter liquid analysis sensors. Multiple parameter sensors are gaining traction due to their ability to provide comprehensive insights from a single measurement point, thereby reducing installation costs and complexity. Geographically, Asia Pacific, led by China and India, is expected to witness the fastest growth due to rapid industrialization and increasing investments in infrastructure, particularly in water and wastewater management. North America and Europe remain mature markets, characterized by high adoption rates of advanced technologies and strict regulatory frameworks. However, emerging economies in South America and the Middle East & Africa present substantial untapped potential, offering opportunities for market players to expand their reach. Key players like KROHNE Group, Honeywell Inc., and Emerson are actively innovating to meet these evolving market demands.
Liquid Analysis Sensors Company Market Share
This in-depth report delivers a strategic analysis of the global Liquid Analysis Sensors market, providing unparalleled insights into its current landscape and future trajectory. Covering the Study Period: 2019–2033, with a Base Year: 2025 and Forecast Period: 2025–2033, this comprehensive document is an indispensable resource for stakeholders seeking to capitalize on the evolving demands for liquid analysis solutions. The report meticulously examines single parameter liquid analysis sensors and multiple parameters liquid analysis sensors across critical Application segments including Energy, Refining, Food, Pharmacy, Water Treatment, and Chemical Industry. Leveraging high-ranking keywords such as water quality monitoring, industrial process control, chemical analysis, environmental sensing, pharmaceutical validation, and petrochemical monitoring, this report will enhance your search visibility and captivate decision-makers. We delve into market composition, industry evolution, regional dominance, product innovations, growth drivers, obstacles, future opportunities, major players, key developments, and strategic market forecasts, offering actionable intelligence for KROHNE Group, Honeywell Inc, Emerson, Yokogawa, ABB, Fraunhofer IPM, Endress+Hauser, Burkert, Turtle Tough Pty Ltd, and JUMO GmbH & Co. KG.
Liquid Analysis Sensors Market Composition & Trends
The Liquid Analysis Sensors market is characterized by a moderate to high level of concentration, with key players like Endress+Hauser, Emerson, and KROHNE Group holding substantial market shares. Innovation serves as a primary catalyst, driven by the increasing demand for real-time, accurate, and cost-effective process monitoring solutions. The regulatory landscape, particularly in water treatment and pharmaceutical industries, mandates stringent quality control, thereby fueling the adoption of advanced liquid analysis technologies. Substitute products, while present in simpler applications, often lack the precision and multi-parameter capabilities of dedicated sensors. End-user profiles span a broad spectrum, from large-scale industrial operations in refining and chemical industries to specialized applications in food and beverage quality assurance and pharmacy validation. Mergers and acquisitions (M&A) have played a significant role in market consolidation and the expansion of product portfolios, with estimated deal values reaching several hundred million. For instance, recent M&A activities have seen strategic acquisitions aimed at enhancing IoT integration and cloud-based data analytics for liquid analysis sensors. The market's growth is intrinsically linked to advancements in sensor technology, miniaturization, and the development of more robust and user-friendly interfaces.
Liquid Analysis Sensors Industry Evolution
The liquid analysis sensors industry has witnessed a remarkable evolution over the Historical Period: 2019–2024 and is poised for substantial growth through the Forecast Period: 2025–2033. Market growth trajectories have been consistently upward, propelled by an increasing global emphasis on efficient resource management, stringent environmental regulations, and the ever-growing need for precise industrial process control. Technological advancements have been at the forefront of this evolution. Early generations of sensors primarily focused on single-parameter measurements like pH, conductivity, and dissolved oxygen. However, the market has progressively shifted towards sophisticated multiple parameters liquid analysis sensors, offering comprehensive real-time data on a wider range of analytes. This advancement allows for a more holistic understanding and control of complex liquid processes across various applications. For example, advancements in optical sensing technologies and electrochemical techniques have enabled the development of highly sensitive and selective sensors capable of detecting trace contaminants with unprecedented accuracy.
Consumer demand has mirrored these technological shifts, with end-users increasingly seeking integrated smart sensor solutions that offer remote monitoring capabilities, predictive maintenance features, and seamless integration with existing industrial automation systems. The adoption of IoT (Internet of Things) and AI (Artificial Intelligence) in liquid analysis has become a significant trend, facilitating data-driven decision-making and operational optimization. This has led to a projected compound annual growth rate (CAGR) of approximately 7.5% for the liquid analysis sensors market during the forecast period. The Energy and Water Treatment sectors, in particular, have seen a significant surge in adoption due to stringent environmental compliance requirements and the need for efficient operational management. The Chemical Industry and Refining sectors also continue to be major consumers, driven by process optimization and safety mandates. The Pharmacy sector, with its unwavering focus on product purity and validation, represents a high-value, albeit niche, segment demanding the highest levels of accuracy and reliability. The evolution is not merely about sensing capabilities but also about the entire ecosystem surrounding the sensor, including data acquisition, transmission, and analysis.
Leading Regions, Countries, or Segments in Liquid Analysis Sensors
Within the dynamic Liquid Analysis Sensors market, North America currently stands as a leading region, propelled by significant investments in water treatment infrastructure and the robust presence of the chemical industry and refining sectors. Key drivers for this dominance include stringent environmental regulations, a strong emphasis on industrial automation, and the presence of major technology developers and adopters. The United States, in particular, contributes a substantial portion of the regional market share, driven by its advanced manufacturing capabilities and ongoing modernization of industrial processes.
- North America (Dominant Region):
- Key Drivers: Significant government initiatives for water resource management and infrastructure upgrades, coupled with substantial private sector investment in advanced manufacturing and petrochemical industries.
- Investment Trends: High levels of R&D expenditure in sensor technology and a growing demand for smart, connected devices for real-time monitoring.
- Regulatory Support: Strict environmental protection agencies (e.g., EPA) enforce rigorous standards for wastewater discharge and industrial emissions, necessitating advanced liquid analysis.
- Technological Adoption: Rapid adoption of IoT and AI-enabled liquid analysis sensors for predictive maintenance and process optimization.
Among the Application segments, Water Treatment emerges as a pivotal area for liquid analysis sensors. The increasing global demand for clean water, coupled with growing concerns about water pollution and the need for efficient wastewater management, fuels this segment's expansion. Governments worldwide are investing heavily in upgrading water and wastewater treatment facilities, directly impacting the demand for reliable liquid analysis solutions.
- Water Treatment (Dominant Application Segment):
- Investment Trends: Billions of dollars allocated globally for the construction and upgrading of municipal and industrial wastewater treatment plants.
- Regulatory Support: Stringent discharge limits for pollutants necessitate continuous monitoring of various water parameters.
- Consumer Demand: Growing public awareness and demand for safe and accessible drinking water.
- Technological Adoption: High demand for multiple parameters liquid analysis sensors to monitor parameters like pH, ORP, turbidity, dissolved oxygen, chlorine, and various ions in real-time.
In terms of Type, Multiple Parameters Liquid Analysis Sensors are exhibiting a more pronounced growth trajectory compared to Single Parameter Liquid Analysis Sensors. This is attributed to the industry's move towards integrated solutions that provide a comprehensive understanding of liquid composition and process conditions, leading to greater efficiency and accuracy in decision-making.
- Multiple Parameters Liquid Analysis Sensors (Dominant Type):
- Innovation Catalysts: Development of advanced sensor arrays and multi-channel data acquisition systems.
- End-User Value Proposition: Enhanced process control, reduced downtime, and improved product quality through simultaneous measurement of various parameters.
- Market Trend: Increasing integration with digital platforms for data analytics and remote diagnostics.
The Chemical Industry also represents a substantial segment due to its inherent need for precise control over chemical reactions and quality assurance. The Energy sector, particularly in upstream and downstream operations, relies heavily on liquid analysis sensors for monitoring process fluids, ensuring safety, and optimizing extraction and refining processes.
Liquid Analysis Sensors Product Innovations
Product innovation in the Liquid Analysis Sensors market is heavily focused on enhancing accuracy, miniaturization, and connectivity. Recent advancements include the development of novel electrochemical sensors with extended lifespan and improved resistance to fouling, as well as optical sensors capable of real-time, non-contact measurements of specific chemical species. The integration of IoT capabilities, allowing for wireless data transmission and cloud-based analytics, is a significant USP for many new products, enabling remote monitoring and predictive maintenance. Furthermore, innovations in multi-parameter sensor platforms are offering users the ability to simultaneously measure up to ten different parameters, providing a holistic view of liquid quality and process health.
Propelling Factors for Liquid Analysis Sensors Growth
The Liquid Analysis Sensors market is experiencing robust growth driven by several key factors. Foremost is the increasing stringency of environmental regulations worldwide, mandating precise monitoring of water and wastewater quality, thereby boosting demand for water treatment sensors. Technological advancements, particularly in sensor miniaturization, accuracy, and the development of multiple parameters liquid analysis sensors, are enabling more sophisticated applications. The growing emphasis on industrial automation and process optimization across sectors like chemical industry and refining also propels adoption. Furthermore, the burgeoning demand for safe and high-quality products in the food and pharmacy industries necessitates reliable liquid analysis solutions for quality control and validation. Economic factors, such as rising global industrial output and investment in infrastructure, further contribute to market expansion.
Obstacles in the Liquid Analysis Sensors Market
Despite strong growth prospects, the Liquid Analysis Sensors market faces several obstacles. High initial investment costs for advanced multiple parameters liquid analysis sensors and integrated systems can be a barrier for smaller enterprises. Regulatory complexities and the need for frequent recalibration in certain applications can also pose challenges. Supply chain disruptions, as experienced globally, can impact the availability of critical components and raw materials, leading to production delays and increased costs. Intense competition among established players and emerging manufacturers can also lead to price pressures. Moreover, the need for skilled personnel to operate and maintain sophisticated liquid analysis systems can limit widespread adoption in regions with less developed technical expertise.
Future Opportunities in Liquid Analysis Sensors
The future for liquid analysis sensors is ripe with opportunities. The growing demand for real-time water quality monitoring in developing economies presents a significant market expansion potential. The increasing focus on sustainability and circular economy principles will drive innovation in sensors for resource recovery and pollution prevention. Advancements in nanotechnology and biosensors are poised to enable the development of highly sensitive and specific sensors for detecting even trace contaminants. The expansion of the pharmaceutical and biotechnology sectors, with their stringent quality control requirements, offers a high-value opportunity. Furthermore, the integration of AI and machine learning with liquid analysis data will unlock predictive analytics capabilities, optimizing industrial processes and enhancing operational efficiency across all application segments.
Major Players in the Liquid Analysis Sensors Ecosystem
- KROHNE Group
- Honeywell Inc
- Emerson
- Yokogawa
- ABB
- Fraunhofer IPM
- Endress+Hauser
- Burkert
- Turtle Tough Pty Ltd
- JUMO GmbH & Co. KG
Key Developments in Liquid Analysis Sensors Industry
- 2024 (Ongoing): Increased focus on IoT-enabled sensors with advanced data analytics and predictive maintenance capabilities across all segments.
- 2023 Q4: Launch of new ultra-low power multi-parameter sensors for remote water quality monitoring applications.
- 2023 Q3: Significant R&D investment by major players in AI-driven sensor calibration and diagnostics.
- 2023 Q2: Expansion of sensor portfolios for the burgeoning biopharmaceutical industry, emphasizing high-purity applications.
- 2023 Q1: Mergers and acquisitions aimed at consolidating market share and expanding geographic reach.
- 2022: Introduction of novel optical sensing technologies for faster and more accurate detection of specific chemical compounds.
- 2021: Enhanced focus on ruggedized sensor designs for harsh industrial environments in the Energy and Refining sectors.
- 2020: Development of cost-effective single-parameter sensors for broader adoption in the Water Treatment segment.
- 2019: Initial integration of wireless communication protocols into industrial liquid analysis sensors.
Strategic Liquid Analysis Sensors Market Forecast
The Liquid Analysis Sensors market is projected for sustained and significant growth, driven by a confluence of technological innovation, stringent regulatory frameworks, and escalating global demand for precise monitoring. The continued evolution towards multiple parameters liquid analysis sensors, coupled with the pervasive integration of IoT and AI, will unlock unprecedented levels of process optimization and data-driven decision-making across the Energy, Refining, Food, Pharmacy, Water Treatment, and Chemical Industry sectors. Emerging markets and novel applications in areas like advanced materials and environmental remediation represent substantial future opportunities. Strategic investments in research and development, coupled with strategic partnerships and M&A activities, will be crucial for market players to capitalize on this promising outlook, ensuring an estimated market value exceeding several billion in the coming years.
Liquid Analysis Sensors Segmentation
-
1. Application
- 1.1. Energe
- 1.2. Refining
- 1.3. Food
- 1.4. Pharmacy
- 1.5. Water Treatment
- 1.6. Chemical Industry
- 1.7. Other
-
2. Type
- 2.1. Single Parameter Liquid Analysis Sensors
- 2.2. Multiple Parameters Liquid Analysis Sensors
Liquid Analysis Sensors Segmentation By Geography
-
1. North America
- 1.1. United States
- 1.2. Canada
- 1.3. Mexico
-
2. South America
- 2.1. Brazil
- 2.2. Argentina
- 2.3. Rest of South America
-
3. Europe
- 3.1. United Kingdom
- 3.2. Germany
- 3.3. France
- 3.4. Italy
- 3.5. Spain
- 3.6. Russia
- 3.7. Benelux
- 3.8. Nordics
- 3.9. Rest of Europe
-
4. Middle East & Africa
- 4.1. Turkey
- 4.2. Israel
- 4.3. GCC
- 4.4. North Africa
- 4.5. South Africa
- 4.6. Rest of Middle East & Africa
-
5. Asia Pacific
- 5.1. China
- 5.2. India
- 5.3. Japan
- 5.4. South Korea
- 5.5. ASEAN
- 5.6. Oceania
- 5.7. Rest of Asia Pacific
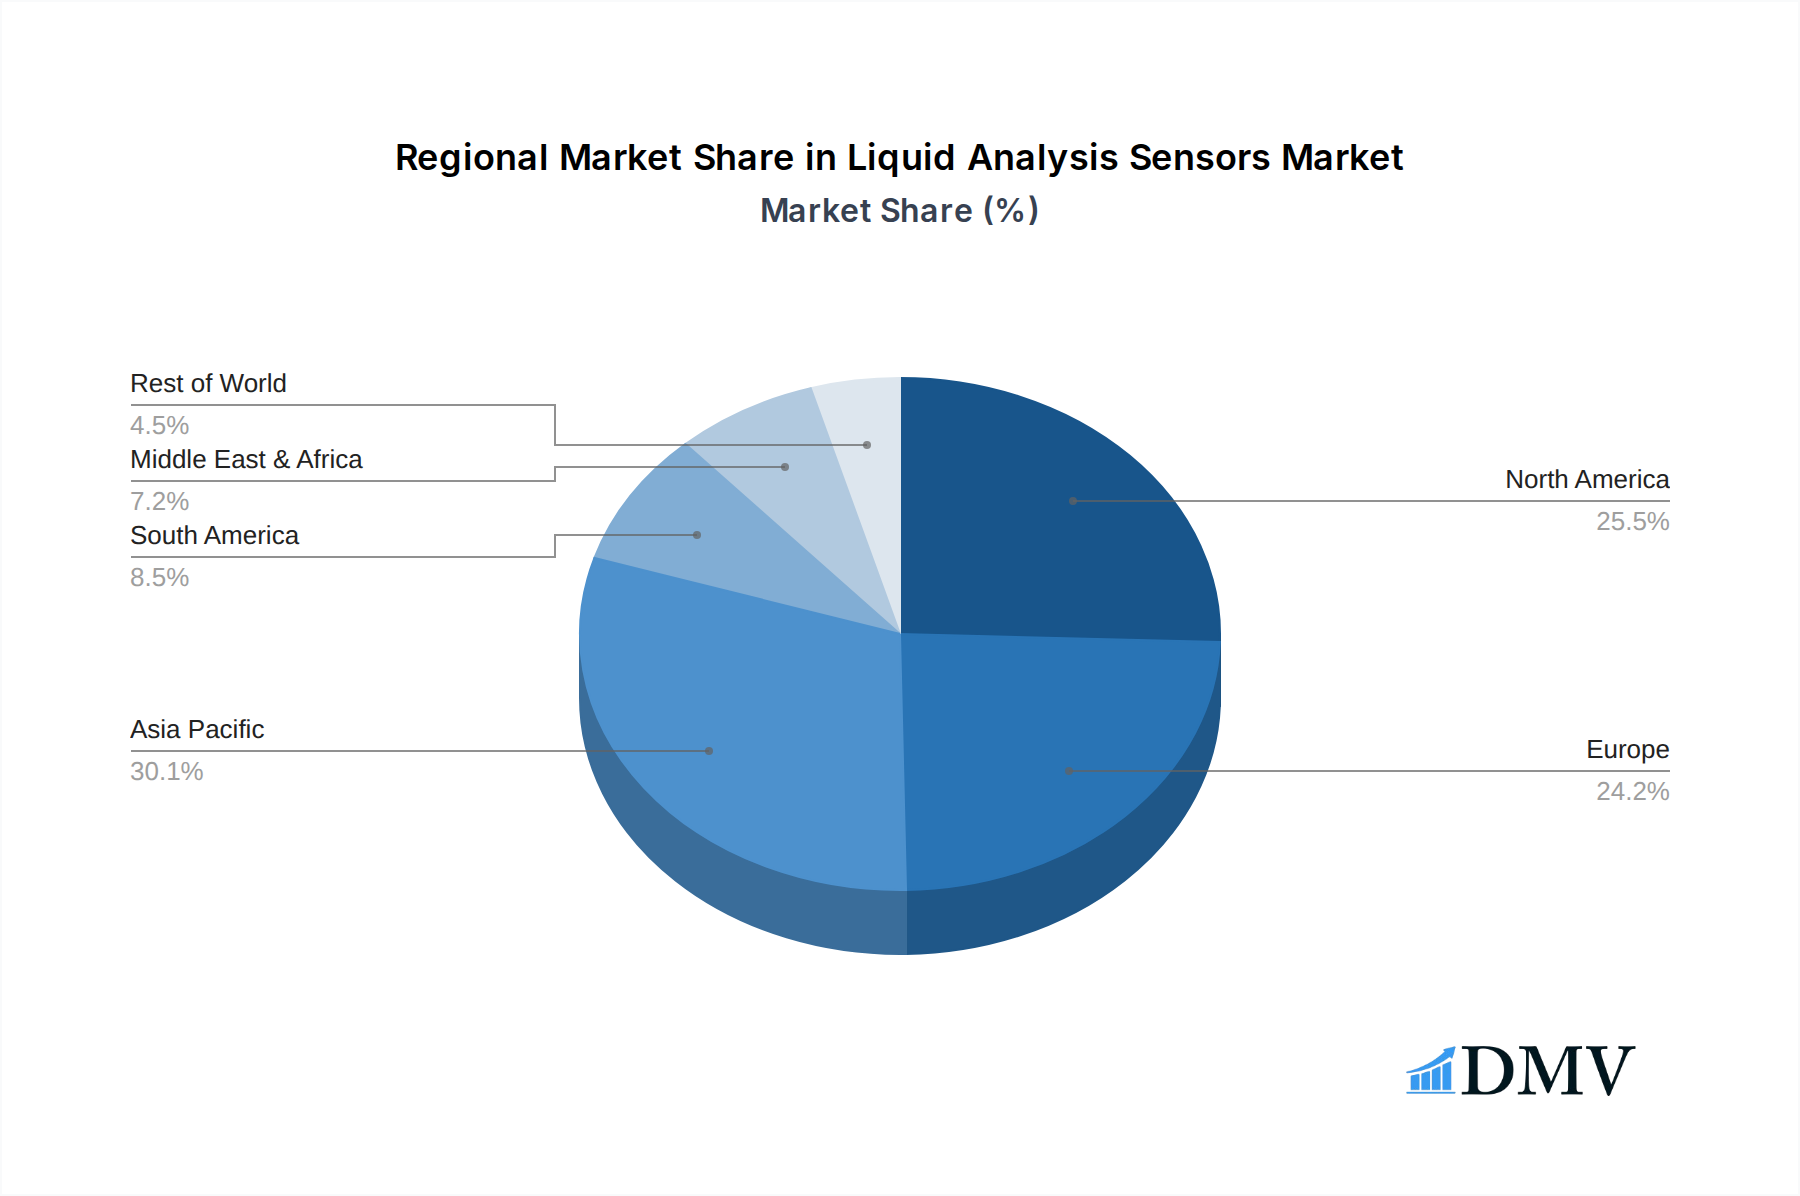
Liquid Analysis Sensors Regional Market Share
Geographic Coverage of Liquid Analysis Sensors
Liquid Analysis Sensors REPORT HIGHLIGHTS
| Aspects | Details |
|---|---|
| Study Period | 2020-2034 |
| Base Year | 2025 |
| Estimated Year | 2026 |
| Forecast Period | 2026-2034 |
| Historical Period | 2020-2025 |
| Growth Rate | CAGR of 4.5% from 2020-2034 |
| Segmentation |
|
Table of Contents
- 1. Introduction
- 1.1. Research Scope
- 1.2. Market Segmentation
- 1.3. Research Objective
- 1.4. Definitions and Assumptions
- 2. Executive Summary
- 2.1. Market Snapshot
- 3. Market Dynamics
- 3.1. Market Drivers
- 3.2. Market Restrains
- 3.3. Market Trends
- 3.4. Market Opportunities
- 4. Market Factor Analysis
- 4.1. Porters Five Forces
- 4.1.1. Bargaining Power of Suppliers
- 4.1.2. Bargaining Power of Buyers
- 4.1.3. Threat of New Entrants
- 4.1.4. Threat of Substitutes
- 4.1.5. Competitive Rivalry
- 4.2. PESTEL analysis
- 4.3. BCG Analysis
- 4.3.1. Stars (High Growth, High Market Share)
- 4.3.2. Cash Cows (Low Growth, High Market Share)
- 4.3.3. Question Mark (High Growth, Low Market Share)
- 4.3.4. Dogs (Low Growth, Low Market Share)
- 4.4. Ansoff Matrix Analysis
- 4.5. Supply Chain Analysis
- 4.6. Regulatory Landscape
- 4.7. Current Market Potential and Opportunity Assessment (TAM–SAM–SOM Framework)
- 4.8. DMV Analyst Note
- 4.1. Porters Five Forces
- 5. Market Analysis, Insights and Forecast 2021-2033
- 5.1. Market Analysis, Insights and Forecast - by Application
- 5.1.1. Energe
- 5.1.2. Refining
- 5.1.3. Food
- 5.1.4. Pharmacy
- 5.1.5. Water Treatment
- 5.1.6. Chemical Industry
- 5.1.7. Other
- 5.2. Market Analysis, Insights and Forecast - by Type
- 5.2.1. Single Parameter Liquid Analysis Sensors
- 5.2.2. Multiple Parameters Liquid Analysis Sensors
- 5.3. Market Analysis, Insights and Forecast - by Region
- 5.3.1. North America
- 5.3.2. South America
- 5.3.3. Europe
- 5.3.4. Middle East & Africa
- 5.3.5. Asia Pacific
- 5.1. Market Analysis, Insights and Forecast - by Application
- 6. Global Liquid Analysis Sensors Analysis, Insights and Forecast, 2021-2033
- 6.1. Market Analysis, Insights and Forecast - by Application
- 6.1.1. Energe
- 6.1.2. Refining
- 6.1.3. Food
- 6.1.4. Pharmacy
- 6.1.5. Water Treatment
- 6.1.6. Chemical Industry
- 6.1.7. Other
- 6.2. Market Analysis, Insights and Forecast - by Type
- 6.2.1. Single Parameter Liquid Analysis Sensors
- 6.2.2. Multiple Parameters Liquid Analysis Sensors
- 6.1. Market Analysis, Insights and Forecast - by Application
- 7. North America Liquid Analysis Sensors Analysis, Insights and Forecast, 2020-2032
- 7.1. Market Analysis, Insights and Forecast - by Application
- 7.1.1. Energe
- 7.1.2. Refining
- 7.1.3. Food
- 7.1.4. Pharmacy
- 7.1.5. Water Treatment
- 7.1.6. Chemical Industry
- 7.1.7. Other
- 7.2. Market Analysis, Insights and Forecast - by Type
- 7.2.1. Single Parameter Liquid Analysis Sensors
- 7.2.2. Multiple Parameters Liquid Analysis Sensors
- 7.1. Market Analysis, Insights and Forecast - by Application
- 8. South America Liquid Analysis Sensors Analysis, Insights and Forecast, 2020-2032
- 8.1. Market Analysis, Insights and Forecast - by Application
- 8.1.1. Energe
- 8.1.2. Refining
- 8.1.3. Food
- 8.1.4. Pharmacy
- 8.1.5. Water Treatment
- 8.1.6. Chemical Industry
- 8.1.7. Other
- 8.2. Market Analysis, Insights and Forecast - by Type
- 8.2.1. Single Parameter Liquid Analysis Sensors
- 8.2.2. Multiple Parameters Liquid Analysis Sensors
- 8.1. Market Analysis, Insights and Forecast - by Application
- 9. Europe Liquid Analysis Sensors Analysis, Insights and Forecast, 2020-2032
- 9.1. Market Analysis, Insights and Forecast - by Application
- 9.1.1. Energe
- 9.1.2. Refining
- 9.1.3. Food
- 9.1.4. Pharmacy
- 9.1.5. Water Treatment
- 9.1.6. Chemical Industry
- 9.1.7. Other
- 9.2. Market Analysis, Insights and Forecast - by Type
- 9.2.1. Single Parameter Liquid Analysis Sensors
- 9.2.2. Multiple Parameters Liquid Analysis Sensors
- 9.1. Market Analysis, Insights and Forecast - by Application
- 10. Middle East & Africa Liquid Analysis Sensors Analysis, Insights and Forecast, 2020-2032
- 10.1. Market Analysis, Insights and Forecast - by Application
- 10.1.1. Energe
- 10.1.2. Refining
- 10.1.3. Food
- 10.1.4. Pharmacy
- 10.1.5. Water Treatment
- 10.1.6. Chemical Industry
- 10.1.7. Other
- 10.2. Market Analysis, Insights and Forecast - by Type
- 10.2.1. Single Parameter Liquid Analysis Sensors
- 10.2.2. Multiple Parameters Liquid Analysis Sensors
- 10.1. Market Analysis, Insights and Forecast - by Application
- 11. Asia Pacific Liquid Analysis Sensors Analysis, Insights and Forecast, 2020-2032
- 11.1. Market Analysis, Insights and Forecast - by Application
- 11.1.1. Energe
- 11.1.2. Refining
- 11.1.3. Food
- 11.1.4. Pharmacy
- 11.1.5. Water Treatment
- 11.1.6. Chemical Industry
- 11.1.7. Other
- 11.2. Market Analysis, Insights and Forecast - by Type
- 11.2.1. Single Parameter Liquid Analysis Sensors
- 11.2.2. Multiple Parameters Liquid Analysis Sensors
- 11.1. Market Analysis, Insights and Forecast - by Application
- 12. Competitive Analysis
- 12.1. Company Profiles
- 12.1.1 KROHNE Group
- 12.1.1.1. Company Overview
- 12.1.1.2. Products
- 12.1.1.3. Company Financials
- 12.1.1.4. SWOT Analysis
- 12.1.2 Honeywell Inc
- 12.1.2.1. Company Overview
- 12.1.2.2. Products
- 12.1.2.3. Company Financials
- 12.1.2.4. SWOT Analysis
- 12.1.3 Emerson
- 12.1.3.1. Company Overview
- 12.1.3.2. Products
- 12.1.3.3. Company Financials
- 12.1.3.4. SWOT Analysis
- 12.1.4 Yokogawa
- 12.1.4.1. Company Overview
- 12.1.4.2. Products
- 12.1.4.3. Company Financials
- 12.1.4.4. SWOT Analysis
- 12.1.5 ABB
- 12.1.5.1. Company Overview
- 12.1.5.2. Products
- 12.1.5.3. Company Financials
- 12.1.5.4. SWOT Analysis
- 12.1.6 Fraunhofer IPM
- 12.1.6.1. Company Overview
- 12.1.6.2. Products
- 12.1.6.3. Company Financials
- 12.1.6.4. SWOT Analysis
- 12.1.7 Endress+Hauser
- 12.1.7.1. Company Overview
- 12.1.7.2. Products
- 12.1.7.3. Company Financials
- 12.1.7.4. SWOT Analysis
- 12.1.8 Burkert
- 12.1.8.1. Company Overview
- 12.1.8.2. Products
- 12.1.8.3. Company Financials
- 12.1.8.4. SWOT Analysis
- 12.1.9 Turtle Tough Pty Ltd
- 12.1.9.1. Company Overview
- 12.1.9.2. Products
- 12.1.9.3. Company Financials
- 12.1.9.4. SWOT Analysis
- 12.1.10 JUMO GmbH & Co. KG
- 12.1.10.1. Company Overview
- 12.1.10.2. Products
- 12.1.10.3. Company Financials
- 12.1.10.4. SWOT Analysis
- 12.1.1 KROHNE Group
- 12.2. Market Entropy
- 12.2.1 Company's Key Areas Served
- 12.2.2 Recent Developments
- 12.3. Company Market Share Analysis 2025
- 12.3.1 Top 5 Companies Market Share Analysis
- 12.3.2 Top 3 Companies Market Share Analysis
- 12.4. List of Potential Customers
- 13. Research Methodology
List of Figures
- Figure 1: Global Liquid Analysis Sensors Revenue Breakdown (undefined, %) by Region 2025 & 2033
- Figure 2: North America Liquid Analysis Sensors Revenue (undefined), by Application 2025 & 2033
- Figure 3: North America Liquid Analysis Sensors Revenue Share (%), by Application 2025 & 2033
- Figure 4: North America Liquid Analysis Sensors Revenue (undefined), by Type 2025 & 2033
- Figure 5: North America Liquid Analysis Sensors Revenue Share (%), by Type 2025 & 2033
- Figure 6: North America Liquid Analysis Sensors Revenue (undefined), by Country 2025 & 2033
- Figure 7: North America Liquid Analysis Sensors Revenue Share (%), by Country 2025 & 2033
- Figure 8: South America Liquid Analysis Sensors Revenue (undefined), by Application 2025 & 2033
- Figure 9: South America Liquid Analysis Sensors Revenue Share (%), by Application 2025 & 2033
- Figure 10: South America Liquid Analysis Sensors Revenue (undefined), by Type 2025 & 2033
- Figure 11: South America Liquid Analysis Sensors Revenue Share (%), by Type 2025 & 2033
- Figure 12: South America Liquid Analysis Sensors Revenue (undefined), by Country 2025 & 2033
- Figure 13: South America Liquid Analysis Sensors Revenue Share (%), by Country 2025 & 2033
- Figure 14: Europe Liquid Analysis Sensors Revenue (undefined), by Application 2025 & 2033
- Figure 15: Europe Liquid Analysis Sensors Revenue Share (%), by Application 2025 & 2033
- Figure 16: Europe Liquid Analysis Sensors Revenue (undefined), by Type 2025 & 2033
- Figure 17: Europe Liquid Analysis Sensors Revenue Share (%), by Type 2025 & 2033
- Figure 18: Europe Liquid Analysis Sensors Revenue (undefined), by Country 2025 & 2033
- Figure 19: Europe Liquid Analysis Sensors Revenue Share (%), by Country 2025 & 2033
- Figure 20: Middle East & Africa Liquid Analysis Sensors Revenue (undefined), by Application 2025 & 2033
- Figure 21: Middle East & Africa Liquid Analysis Sensors Revenue Share (%), by Application 2025 & 2033
- Figure 22: Middle East & Africa Liquid Analysis Sensors Revenue (undefined), by Type 2025 & 2033
- Figure 23: Middle East & Africa Liquid Analysis Sensors Revenue Share (%), by Type 2025 & 2033
- Figure 24: Middle East & Africa Liquid Analysis Sensors Revenue (undefined), by Country 2025 & 2033
- Figure 25: Middle East & Africa Liquid Analysis Sensors Revenue Share (%), by Country 2025 & 2033
- Figure 26: Asia Pacific Liquid Analysis Sensors Revenue (undefined), by Application 2025 & 2033
- Figure 27: Asia Pacific Liquid Analysis Sensors Revenue Share (%), by Application 2025 & 2033
- Figure 28: Asia Pacific Liquid Analysis Sensors Revenue (undefined), by Type 2025 & 2033
- Figure 29: Asia Pacific Liquid Analysis Sensors Revenue Share (%), by Type 2025 & 2033
- Figure 30: Asia Pacific Liquid Analysis Sensors Revenue (undefined), by Country 2025 & 2033
- Figure 31: Asia Pacific Liquid Analysis Sensors Revenue Share (%), by Country 2025 & 2033
List of Tables
- Table 1: Global Liquid Analysis Sensors Revenue undefined Forecast, by Application 2020 & 2033
- Table 2: Global Liquid Analysis Sensors Revenue undefined Forecast, by Type 2020 & 2033
- Table 3: Global Liquid Analysis Sensors Revenue undefined Forecast, by Region 2020 & 2033
- Table 4: Global Liquid Analysis Sensors Revenue undefined Forecast, by Application 2020 & 2033
- Table 5: Global Liquid Analysis Sensors Revenue undefined Forecast, by Type 2020 & 2033
- Table 6: Global Liquid Analysis Sensors Revenue undefined Forecast, by Country 2020 & 2033
- Table 7: United States Liquid Analysis Sensors Revenue (undefined) Forecast, by Application 2020 & 2033
- Table 8: Canada Liquid Analysis Sensors Revenue (undefined) Forecast, by Application 2020 & 2033
- Table 9: Mexico Liquid Analysis Sensors Revenue (undefined) Forecast, by Application 2020 & 2033
- Table 10: Global Liquid Analysis Sensors Revenue undefined Forecast, by Application 2020 & 2033
- Table 11: Global Liquid Analysis Sensors Revenue undefined Forecast, by Type 2020 & 2033
- Table 12: Global Liquid Analysis Sensors Revenue undefined Forecast, by Country 2020 & 2033
- Table 13: Brazil Liquid Analysis Sensors Revenue (undefined) Forecast, by Application 2020 & 2033
- Table 14: Argentina Liquid Analysis Sensors Revenue (undefined) Forecast, by Application 2020 & 2033
- Table 15: Rest of South America Liquid Analysis Sensors Revenue (undefined) Forecast, by Application 2020 & 2033
- Table 16: Global Liquid Analysis Sensors Revenue undefined Forecast, by Application 2020 & 2033
- Table 17: Global Liquid Analysis Sensors Revenue undefined Forecast, by Type 2020 & 2033
- Table 18: Global Liquid Analysis Sensors Revenue undefined Forecast, by Country 2020 & 2033
- Table 19: United Kingdom Liquid Analysis Sensors Revenue (undefined) Forecast, by Application 2020 & 2033
- Table 20: Germany Liquid Analysis Sensors Revenue (undefined) Forecast, by Application 2020 & 2033
- Table 21: France Liquid Analysis Sensors Revenue (undefined) Forecast, by Application 2020 & 2033
- Table 22: Italy Liquid Analysis Sensors Revenue (undefined) Forecast, by Application 2020 & 2033
- Table 23: Spain Liquid Analysis Sensors Revenue (undefined) Forecast, by Application 2020 & 2033
- Table 24: Russia Liquid Analysis Sensors Revenue (undefined) Forecast, by Application 2020 & 2033
- Table 25: Benelux Liquid Analysis Sensors Revenue (undefined) Forecast, by Application 2020 & 2033
- Table 26: Nordics Liquid Analysis Sensors Revenue (undefined) Forecast, by Application 2020 & 2033
- Table 27: Rest of Europe Liquid Analysis Sensors Revenue (undefined) Forecast, by Application 2020 & 2033
- Table 28: Global Liquid Analysis Sensors Revenue undefined Forecast, by Application 2020 & 2033
- Table 29: Global Liquid Analysis Sensors Revenue undefined Forecast, by Type 2020 & 2033
- Table 30: Global Liquid Analysis Sensors Revenue undefined Forecast, by Country 2020 & 2033
- Table 31: Turkey Liquid Analysis Sensors Revenue (undefined) Forecast, by Application 2020 & 2033
- Table 32: Israel Liquid Analysis Sensors Revenue (undefined) Forecast, by Application 2020 & 2033
- Table 33: GCC Liquid Analysis Sensors Revenue (undefined) Forecast, by Application 2020 & 2033
- Table 34: North Africa Liquid Analysis Sensors Revenue (undefined) Forecast, by Application 2020 & 2033
- Table 35: South Africa Liquid Analysis Sensors Revenue (undefined) Forecast, by Application 2020 & 2033
- Table 36: Rest of Middle East & Africa Liquid Analysis Sensors Revenue (undefined) Forecast, by Application 2020 & 2033
- Table 37: Global Liquid Analysis Sensors Revenue undefined Forecast, by Application 2020 & 2033
- Table 38: Global Liquid Analysis Sensors Revenue undefined Forecast, by Type 2020 & 2033
- Table 39: Global Liquid Analysis Sensors Revenue undefined Forecast, by Country 2020 & 2033
- Table 40: China Liquid Analysis Sensors Revenue (undefined) Forecast, by Application 2020 & 2033
- Table 41: India Liquid Analysis Sensors Revenue (undefined) Forecast, by Application 2020 & 2033
- Table 42: Japan Liquid Analysis Sensors Revenue (undefined) Forecast, by Application 2020 & 2033
- Table 43: South Korea Liquid Analysis Sensors Revenue (undefined) Forecast, by Application 2020 & 2033
- Table 44: ASEAN Liquid Analysis Sensors Revenue (undefined) Forecast, by Application 2020 & 2033
- Table 45: Oceania Liquid Analysis Sensors Revenue (undefined) Forecast, by Application 2020 & 2033
- Table 46: Rest of Asia Pacific Liquid Analysis Sensors Revenue (undefined) Forecast, by Application 2020 & 2033
Frequently Asked Questions
1. What is the projected Compound Annual Growth Rate (CAGR) of the Liquid Analysis Sensors?
The projected CAGR is approximately 4.5%.
2. Which companies are prominent players in the Liquid Analysis Sensors?
Key companies in the market include KROHNE Group, Honeywell Inc, Emerson, Yokogawa, ABB, Fraunhofer IPM, Endress+Hauser, Burkert, Turtle Tough Pty Ltd, JUMO GmbH & Co. KG.
3. What are the main segments of the Liquid Analysis Sensors?
The market segments include Application, Type.
4. Can you provide details about the market size?
The market size is estimated to be USD XXX N/A as of 2022.
5. What are some drivers contributing to market growth?
N/A
6. What are the notable trends driving market growth?
N/A
7. Are there any restraints impacting market growth?
N/A
8. Can you provide examples of recent developments in the market?
N/A
9. What pricing options are available for accessing the report?
Pricing options include single-user, multi-user, and enterprise licenses priced at USD 2900.00, USD 4350.00, and USD 5800.00 respectively.
10. Is the market size provided in terms of value or volume?
The market size is provided in terms of value, measured in N/A.
11. Are there any specific market keywords associated with the report?
Yes, the market keyword associated with the report is "Liquid Analysis Sensors," which aids in identifying and referencing the specific market segment covered.
12. How do I determine which pricing option suits my needs best?
The pricing options vary based on user requirements and access needs. Individual users may opt for single-user licenses, while businesses requiring broader access may choose multi-user or enterprise licenses for cost-effective access to the report.
13. Are there any additional resources or data provided in the Liquid Analysis Sensors report?
While the report offers comprehensive insights, it's advisable to review the specific contents or supplementary materials provided to ascertain if additional resources or data are available.
14. How can I stay updated on further developments or reports in the Liquid Analysis Sensors?
To stay informed about further developments, trends, and reports in the Liquid Analysis Sensors, consider subscribing to industry newsletters, following relevant companies and organizations, or regularly checking reputable industry news sources and publications.
Methodology
Step 1 - Identification of Relevant Samples Size from Population Database


Step 2 - Approaches for Defining Global Market Size (Value, Volume* & Price*)

Note*: In applicable scenarios
Step 3 - Data Sources
Primary Research
- Web Analytics
- Survey Reports
- Research Institute
- Latest Research Reports
- Opinion Leaders
Secondary Research
- Annual Reports
- White Paper
- Latest Press Release
- Industry Association
- Paid Database
- Investor Presentations

Step 4 - Data Triangulation
Involves using different sources of information in order to increase the validity of a study
These sources are likely to be stakeholders in a program - participants, other researchers, program staff, other community members, and so on.
Then we put all data in single framework & apply various statistical tools to find out the dynamic on the market.
During the analysis stage, feedback from the stakeholder groups would be compared to determine areas of agreement as well as areas of divergence