

Key Insights
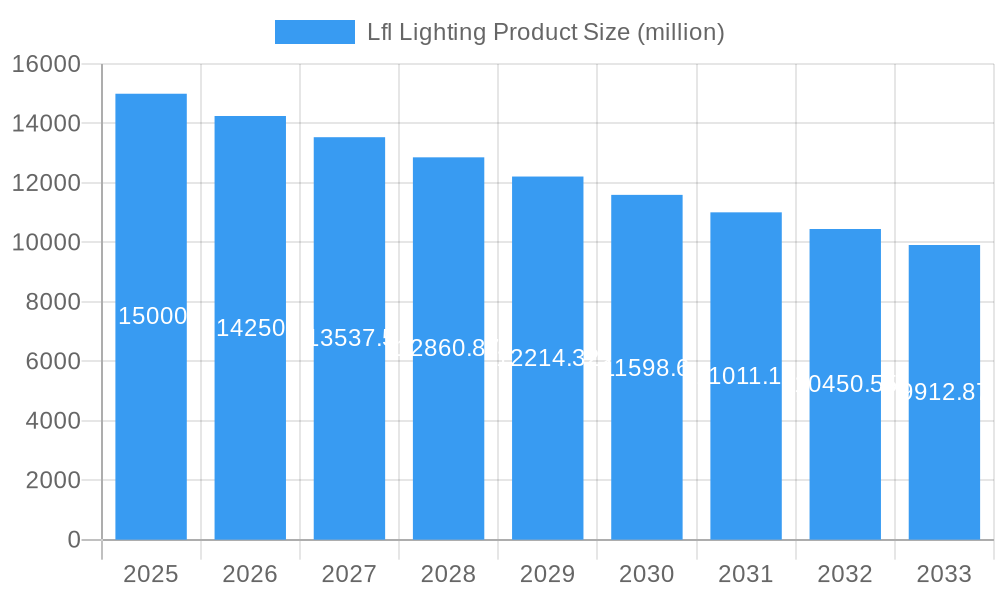
The LFL (Linear Fluorescent Lamp) lighting market, while facing decline due to the rise of LEDs, still maintains a significant presence, particularly in sectors resistant to rapid technological adoption. Our analysis suggests a market size of approximately $15 billion in 2025, considering the historical data and the ongoing transition to more energy-efficient alternatives. A conservative Compound Annual Growth Rate (CAGR) of -5% is projected for the forecast period (2025-2033), reflecting the continued market share erosion by LED technology. Key drivers influencing the remaining market include the lower initial cost of LFLs compared to LEDs, their familiarity and ease of installation in existing infrastructure, and their continued use in certain industrial applications requiring specific light characteristics. However, stringent government regulations promoting energy efficiency and the increasing availability of cost-competitive LEDs are significant restraints, pushing the market toward contraction. Market segmentation includes various wattages and tube lengths catering to diverse applications, with key players like GE Lighting, Philips, and Osram continuing to compete, though their focus is shifting towards LED technologies. Regional differences will persist, with developing economies showing comparatively higher LFL market share due to cost sensitivity.
Lfl Lighting Product Market Size (In Billion)
Despite the predicted decline, niche markets are sustaining LFL sales. These include applications demanding specific spectral properties not yet perfectly replicated by LED alternatives, as well as older buildings with existing LFL infrastructure where replacement costs outweigh the benefits of immediate upgrading. The shift towards energy efficiency is driving innovation in LFL technology itself, with manufacturers developing more energy-efficient LFLs to extend their market lifespan. However, the long-term outlook remains bearish, with the market likely to continue shrinking as LED adoption accelerates across all segments. Maintaining market share will hinge on strategic pricing, focusing on niche applications, and potentially exploring opportunities in refurbishment and maintenance services for existing LFL installations. The industry is anticipated to undergo significant consolidation as companies prioritize investments in more profitable LED-based lighting solutions.
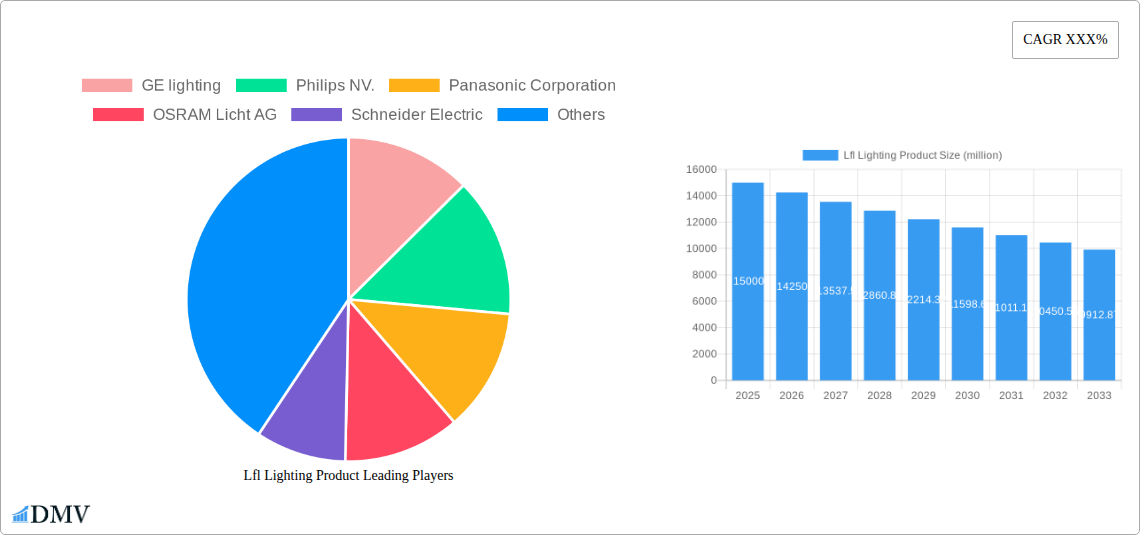
Lfl Lighting Product Company Market Share
Lfl Lighting Product Market Report: 2019-2033 - A Comprehensive Analysis of a Multi-Billion Dollar Industry
This comprehensive report provides a detailed analysis of the Lfl Lighting Product market, projecting a multi-million dollar valuation by 2033. It examines market dynamics, competitive landscapes, technological advancements, and future growth opportunities, offering invaluable insights for stakeholders across the industry. The study period covers 2019-2033, with 2025 as the base and estimated year. The forecast period spans 2025-2033, while the historical period encompasses 2019-2024.
Lfl Lighting Product Market Composition & Trends
This section delves into the intricate structure of the Lfl Lighting Product market, evaluating its concentration, innovation drivers, regulatory hurdles, substitute products, end-user demographics, and mergers & acquisitions (M&A) activity. The analysis incorporates detailed market share distributions, revealing the dominance of key players such as GE Lighting, Philips NV, and Panasonic Corporation. The report also assesses the financial implications of M&A deals, quantifying their values in millions of dollars. Specific examples are provided demonstrating the interplay between these factors, impacting the overall market growth and evolution. The global market size in 2024 is estimated at $XX million. The market is projected to reach $XXX million by 2033.
- Market Concentration: High concentration in the hands of a few major players, with GE Lighting and Philips NV holding a combined XX% market share in 2024.
- Innovation Catalysts: Advancements in LED technology, smart lighting solutions, and energy-efficient designs are driving innovation.
- Regulatory Landscape: Stringent energy efficiency regulations in several regions are impacting product development and adoption rates.
- Substitute Products: The emergence of alternative lighting technologies presents a competitive threat.
- End-User Profiles: The report segments end-users by industry sectors, highlighting key applications within each segment.
- M&A Activities: Analysis of major M&A deals concluded since 2019, with deal values ranging from $XX million to $XXX million, impacting market consolidation.
Lfl Lighting Product Industry Evolution
This section provides a detailed account of the Lfl Lighting Product market's evolution, charting its growth trajectory, documenting technological innovations, and analyzing shifting consumer preferences. The report utilizes specific data points, including compound annual growth rates (CAGRs) and technology adoption rates, to illustrate the market's dynamic nature. The analysis considers the impact of macroeconomic factors and evolving consumer demands, providing a comprehensive perspective on the industry's transformation. The market experienced a CAGR of XX% during 2019-2024. The forecast indicates a CAGR of YY% from 2025-2033.
Leading Regions, Countries, or Segments in Lfl Lighting Product
This section identifies the leading geographical regions, countries, and market segments within the Lfl Lighting Product industry. The analysis pinpoints the key drivers behind their dominance, including factors such as investment trends, government support, and favorable regulatory environments.
- Dominant Region: North America (with the US being the most significant contributor) maintains its leading position driven by strong demand for energy-efficient lighting and technological advancements.
- Key Drivers for North American Dominance:
- High investments in infrastructure development.
- Government initiatives promoting energy efficiency.
- High adoption of smart lighting technologies.
- Other significant regions: Europe, Asia-Pacific, and others are also analyzed, outlining their unique market characteristics and growth potential.
Lfl Lighting Product Product Innovations
This section highlights recent product innovations, application expansions, and key performance indicators (KPIs) within the Lfl Lighting Product sector. It focuses on unique selling propositions (USPs) and technological breakthroughs that distinguish these products. Improvements in efficacy, lifespan, and smart functionalities are driving market growth. New product categories, such as integrated smart lighting solutions with improved color rendering and IoT capabilities, are emerging.
Propelling Factors for Lfl Lighting Product Growth
This section details the crucial drivers fueling the growth of the Lfl Lighting Product market.
- Technological Advancements: LED technology improvements leading to higher efficacy, longer lifespans, and diverse color options.
- Economic Factors: Government incentives for energy-efficient lighting solutions, bolstering adoption.
- Regulatory Influences: Stringent energy efficiency standards are compelling the transition to more sustainable lighting technologies.
Obstacles in the Lfl Lighting Product Market
This section analyzes the challenges impacting the Lfl Lighting Product market.
- Regulatory Challenges: Varying standards and certification processes across different regions increase market entry barriers.
- Supply Chain Disruptions: Global supply chain vulnerabilities affecting component availability and pricing.
- Competitive Pressures: Intense competition from established players and new entrants exerts downward pressure on margins.
Future Opportunities in Lfl Lighting Product
This section outlines the promising opportunities emerging in the Lfl Lighting Product market.
- New Markets: Expanding into developing economies offers significant growth potential.
- Technological Advancements: Exploring new lighting technologies, such as LiFi, for enhanced functionalities.
- Consumer Trends: Meeting the growing demand for smart and sustainable lighting solutions.
Major Players in the Lfl Lighting Product Ecosystem
- GE Lighting
- Philips NV
- Panasonic Corporation
- OSRAM Licht AG
- Schneider Electric
- Cree INC.
- Citizen Electronics
- Lumerica
- Havells India Pvt
- LEDtronics, Inc.
- Patriot LED
- Acuity Brands
Key Developments in Lfl Lighting Product Industry
- 2022 Q3: GE Lighting launched a new line of smart LED bulbs with enhanced energy efficiency.
- 2023 Q1: Philips NV acquired a smaller lighting technology company, expanding its product portfolio.
- 2024 Q2: New energy-efficiency regulations were implemented in the European Union.
Strategic Lfl Lighting Product Market Forecast
The Lfl Lighting Product market is poised for significant growth, driven by technological innovations, stringent environmental regulations, and rising demand for energy-efficient lighting solutions. The market's evolution will be shaped by continuous technological advancements, increasing penetration of smart lighting, and the expansion into new and developing markets. The forecast suggests a strong trajectory of growth throughout the forecast period, presenting substantial opportunities for market participants.
Lfl Lighting Product Segmentation
-
1. Application
- 1.1. Residential
- 1.2. Commercial
- 1.3. Industrial
- 1.4. Outdoor
- 1.5. Others
-
2. Type
- 2.1. General Lighting
- 2.2. Automotive Lighting
- 2.3. Others
Lfl Lighting Product Segmentation By Geography
-
1. North America
- 1.1. United States
- 1.2. Canada
- 1.3. Mexico
-
2. South America
- 2.1. Brazil
- 2.2. Argentina
- 2.3. Rest of South America
-
3. Europe
- 3.1. United Kingdom
- 3.2. Germany
- 3.3. France
- 3.4. Italy
- 3.5. Spain
- 3.6. Russia
- 3.7. Benelux
- 3.8. Nordics
- 3.9. Rest of Europe
-
4. Middle East & Africa
- 4.1. Turkey
- 4.2. Israel
- 4.3. GCC
- 4.4. North Africa
- 4.5. South Africa
- 4.6. Rest of Middle East & Africa
-
5. Asia Pacific
- 5.1. China
- 5.2. India
- 5.3. Japan
- 5.4. South Korea
- 5.5. ASEAN
- 5.6. Oceania
- 5.7. Rest of Asia Pacific
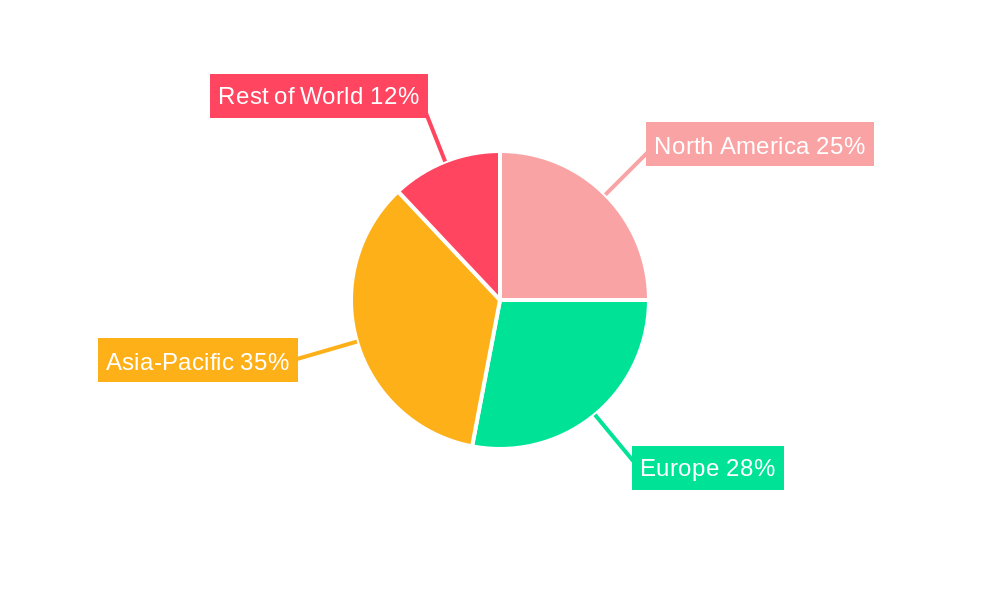
Lfl Lighting Product Regional Market Share
Geographic Coverage of Lfl Lighting Product
Lfl Lighting Product REPORT HIGHLIGHTS
| Aspects | Details |
|---|---|
| Study Period | 2020-2034 |
| Base Year | 2025 |
| Estimated Year | 2026 |
| Forecast Period | 2026-2034 |
| Historical Period | 2020-2025 |
| Growth Rate | CAGR of XXX% from 2020-2034 |
| Segmentation |
|
Table of Contents
- 1. Introduction
- 1.1. Research Scope
- 1.2. Market Segmentation
- 1.3. Research Objective
- 1.4. Definitions and Assumptions
- 2. Executive Summary
- 2.1. Market Snapshot
- 3. Market Dynamics
- 3.1. Market Drivers
- 3.2. Market Restrains
- 3.3. Market Trends
- 3.4. Market Opportunities
- 4. Market Factor Analysis
- 4.1. Porters Five Forces
- 4.1.1. Bargaining Power of Suppliers
- 4.1.2. Bargaining Power of Buyers
- 4.1.3. Threat of New Entrants
- 4.1.4. Threat of Substitutes
- 4.1.5. Competitive Rivalry
- 4.2. PESTEL analysis
- 4.3. BCG Analysis
- 4.3.1. Stars (High Growth, High Market Share)
- 4.3.2. Cash Cows (Low Growth, High Market Share)
- 4.3.3. Question Mark (High Growth, Low Market Share)
- 4.3.4. Dogs (Low Growth, Low Market Share)
- 4.4. Ansoff Matrix Analysis
- 4.5. Supply Chain Analysis
- 4.6. Regulatory Landscape
- 4.7. Current Market Potential and Opportunity Assessment (TAM–SAM–SOM Framework)
- 4.8. DMV Analyst Note
- 4.1. Porters Five Forces
- 5. Market Analysis, Insights and Forecast 2021-2033
- 5.1. Market Analysis, Insights and Forecast - by Application
- 5.1.1. Residential
- 5.1.2. Commercial
- 5.1.3. Industrial
- 5.1.4. Outdoor
- 5.1.5. Others
- 5.2. Market Analysis, Insights and Forecast - by Type
- 5.2.1. General Lighting
- 5.2.2. Automotive Lighting
- 5.2.3. Others
- 5.3. Market Analysis, Insights and Forecast - by Region
- 5.3.1. North America
- 5.3.2. South America
- 5.3.3. Europe
- 5.3.4. Middle East & Africa
- 5.3.5. Asia Pacific
- 5.1. Market Analysis, Insights and Forecast - by Application
- 6. Global Lfl Lighting Product Analysis, Insights and Forecast, 2021-2033
- 6.1. Market Analysis, Insights and Forecast - by Application
- 6.1.1. Residential
- 6.1.2. Commercial
- 6.1.3. Industrial
- 6.1.4. Outdoor
- 6.1.5. Others
- 6.2. Market Analysis, Insights and Forecast - by Type
- 6.2.1. General Lighting
- 6.2.2. Automotive Lighting
- 6.2.3. Others
- 6.1. Market Analysis, Insights and Forecast - by Application
- 7. North America Lfl Lighting Product Analysis, Insights and Forecast, 2020-2032
- 7.1. Market Analysis, Insights and Forecast - by Application
- 7.1.1. Residential
- 7.1.2. Commercial
- 7.1.3. Industrial
- 7.1.4. Outdoor
- 7.1.5. Others
- 7.2. Market Analysis, Insights and Forecast - by Type
- 7.2.1. General Lighting
- 7.2.2. Automotive Lighting
- 7.2.3. Others
- 7.1. Market Analysis, Insights and Forecast - by Application
- 8. South America Lfl Lighting Product Analysis, Insights and Forecast, 2020-2032
- 8.1. Market Analysis, Insights and Forecast - by Application
- 8.1.1. Residential
- 8.1.2. Commercial
- 8.1.3. Industrial
- 8.1.4. Outdoor
- 8.1.5. Others
- 8.2. Market Analysis, Insights and Forecast - by Type
- 8.2.1. General Lighting
- 8.2.2. Automotive Lighting
- 8.2.3. Others
- 8.1. Market Analysis, Insights and Forecast - by Application
- 9. Europe Lfl Lighting Product Analysis, Insights and Forecast, 2020-2032
- 9.1. Market Analysis, Insights and Forecast - by Application
- 9.1.1. Residential
- 9.1.2. Commercial
- 9.1.3. Industrial
- 9.1.4. Outdoor
- 9.1.5. Others
- 9.2. Market Analysis, Insights and Forecast - by Type
- 9.2.1. General Lighting
- 9.2.2. Automotive Lighting
- 9.2.3. Others
- 9.1. Market Analysis, Insights and Forecast - by Application
- 10. Middle East & Africa Lfl Lighting Product Analysis, Insights and Forecast, 2020-2032
- 10.1. Market Analysis, Insights and Forecast - by Application
- 10.1.1. Residential
- 10.1.2. Commercial
- 10.1.3. Industrial
- 10.1.4. Outdoor
- 10.1.5. Others
- 10.2. Market Analysis, Insights and Forecast - by Type
- 10.2.1. General Lighting
- 10.2.2. Automotive Lighting
- 10.2.3. Others
- 10.1. Market Analysis, Insights and Forecast - by Application
- 11. Asia Pacific Lfl Lighting Product Analysis, Insights and Forecast, 2020-2032
- 11.1. Market Analysis, Insights and Forecast - by Application
- 11.1.1. Residential
- 11.1.2. Commercial
- 11.1.3. Industrial
- 11.1.4. Outdoor
- 11.1.5. Others
- 11.2. Market Analysis, Insights and Forecast - by Type
- 11.2.1. General Lighting
- 11.2.2. Automotive Lighting
- 11.2.3. Others
- 11.1. Market Analysis, Insights and Forecast - by Application
- 12. Competitive Analysis
- 12.1. Company Profiles
- 12.1.1 GE lighting
- 12.1.1.1. Company Overview
- 12.1.1.2. Products
- 12.1.1.3. Company Financials
- 12.1.1.4. SWOT Analysis
- 12.1.2 Philips NV.
- 12.1.2.1. Company Overview
- 12.1.2.2. Products
- 12.1.2.3. Company Financials
- 12.1.2.4. SWOT Analysis
- 12.1.3 Panasonic Corporation
- 12.1.3.1. Company Overview
- 12.1.3.2. Products
- 12.1.3.3. Company Financials
- 12.1.3.4. SWOT Analysis
- 12.1.4 OSRAM Licht AG
- 12.1.4.1. Company Overview
- 12.1.4.2. Products
- 12.1.4.3. Company Financials
- 12.1.4.4. SWOT Analysis
- 12.1.5 Schneider Electric
- 12.1.5.1. Company Overview
- 12.1.5.2. Products
- 12.1.5.3. Company Financials
- 12.1.5.4. SWOT Analysis
- 12.1.6 Cree INC.
- 12.1.6.1. Company Overview
- 12.1.6.2. Products
- 12.1.6.3. Company Financials
- 12.1.6.4. SWOT Analysis
- 12.1.7 Citizen Electronics
- 12.1.7.1. Company Overview
- 12.1.7.2. Products
- 12.1.7.3. Company Financials
- 12.1.7.4. SWOT Analysis
- 12.1.8 Lumerica
- 12.1.8.1. Company Overview
- 12.1.8.2. Products
- 12.1.8.3. Company Financials
- 12.1.8.4. SWOT Analysis
- 12.1.9 Havells India Pvt
- 12.1.9.1. Company Overview
- 12.1.9.2. Products
- 12.1.9.3. Company Financials
- 12.1.9.4. SWOT Analysis
- 12.1.10 LEDtronics Inc.
- 12.1.10.1. Company Overview
- 12.1.10.2. Products
- 12.1.10.3. Company Financials
- 12.1.10.4. SWOT Analysis
- 12.1.11 Patriot LED
- 12.1.11.1. Company Overview
- 12.1.11.2. Products
- 12.1.11.3. Company Financials
- 12.1.11.4. SWOT Analysis
- 12.1.12 Acuity Brands
- 12.1.12.1. Company Overview
- 12.1.12.2. Products
- 12.1.12.3. Company Financials
- 12.1.12.4. SWOT Analysis
- 12.1.1 GE lighting
- 12.2. Market Entropy
- 12.2.1 Company's Key Areas Served
- 12.2.2 Recent Developments
- 12.3. Company Market Share Analysis 2025
- 12.3.1 Top 5 Companies Market Share Analysis
- 12.3.2 Top 3 Companies Market Share Analysis
- 12.4. List of Potential Customers
- 13. Research Methodology
List of Figures
- Figure 1: Global Lfl Lighting Product Revenue Breakdown (million, %) by Region 2025 & 2033
- Figure 2: Global Lfl Lighting Product Volume Breakdown (K, %) by Region 2025 & 2033
- Figure 3: North America Lfl Lighting Product Revenue (million), by Application 2025 & 2033
- Figure 4: North America Lfl Lighting Product Volume (K), by Application 2025 & 2033
- Figure 5: North America Lfl Lighting Product Revenue Share (%), by Application 2025 & 2033
- Figure 6: North America Lfl Lighting Product Volume Share (%), by Application 2025 & 2033
- Figure 7: North America Lfl Lighting Product Revenue (million), by Type 2025 & 2033
- Figure 8: North America Lfl Lighting Product Volume (K), by Type 2025 & 2033
- Figure 9: North America Lfl Lighting Product Revenue Share (%), by Type 2025 & 2033
- Figure 10: North America Lfl Lighting Product Volume Share (%), by Type 2025 & 2033
- Figure 11: North America Lfl Lighting Product Revenue (million), by Country 2025 & 2033
- Figure 12: North America Lfl Lighting Product Volume (K), by Country 2025 & 2033
- Figure 13: North America Lfl Lighting Product Revenue Share (%), by Country 2025 & 2033
- Figure 14: North America Lfl Lighting Product Volume Share (%), by Country 2025 & 2033
- Figure 15: South America Lfl Lighting Product Revenue (million), by Application 2025 & 2033
- Figure 16: South America Lfl Lighting Product Volume (K), by Application 2025 & 2033
- Figure 17: South America Lfl Lighting Product Revenue Share (%), by Application 2025 & 2033
- Figure 18: South America Lfl Lighting Product Volume Share (%), by Application 2025 & 2033
- Figure 19: South America Lfl Lighting Product Revenue (million), by Type 2025 & 2033
- Figure 20: South America Lfl Lighting Product Volume (K), by Type 2025 & 2033
- Figure 21: South America Lfl Lighting Product Revenue Share (%), by Type 2025 & 2033
- Figure 22: South America Lfl Lighting Product Volume Share (%), by Type 2025 & 2033
- Figure 23: South America Lfl Lighting Product Revenue (million), by Country 2025 & 2033
- Figure 24: South America Lfl Lighting Product Volume (K), by Country 2025 & 2033
- Figure 25: South America Lfl Lighting Product Revenue Share (%), by Country 2025 & 2033
- Figure 26: South America Lfl Lighting Product Volume Share (%), by Country 2025 & 2033
- Figure 27: Europe Lfl Lighting Product Revenue (million), by Application 2025 & 2033
- Figure 28: Europe Lfl Lighting Product Volume (K), by Application 2025 & 2033
- Figure 29: Europe Lfl Lighting Product Revenue Share (%), by Application 2025 & 2033
- Figure 30: Europe Lfl Lighting Product Volume Share (%), by Application 2025 & 2033
- Figure 31: Europe Lfl Lighting Product Revenue (million), by Type 2025 & 2033
- Figure 32: Europe Lfl Lighting Product Volume (K), by Type 2025 & 2033
- Figure 33: Europe Lfl Lighting Product Revenue Share (%), by Type 2025 & 2033
- Figure 34: Europe Lfl Lighting Product Volume Share (%), by Type 2025 & 2033
- Figure 35: Europe Lfl Lighting Product Revenue (million), by Country 2025 & 2033
- Figure 36: Europe Lfl Lighting Product Volume (K), by Country 2025 & 2033
- Figure 37: Europe Lfl Lighting Product Revenue Share (%), by Country 2025 & 2033
- Figure 38: Europe Lfl Lighting Product Volume Share (%), by Country 2025 & 2033
- Figure 39: Middle East & Africa Lfl Lighting Product Revenue (million), by Application 2025 & 2033
- Figure 40: Middle East & Africa Lfl Lighting Product Volume (K), by Application 2025 & 2033
- Figure 41: Middle East & Africa Lfl Lighting Product Revenue Share (%), by Application 2025 & 2033
- Figure 42: Middle East & Africa Lfl Lighting Product Volume Share (%), by Application 2025 & 2033
- Figure 43: Middle East & Africa Lfl Lighting Product Revenue (million), by Type 2025 & 2033
- Figure 44: Middle East & Africa Lfl Lighting Product Volume (K), by Type 2025 & 2033
- Figure 45: Middle East & Africa Lfl Lighting Product Revenue Share (%), by Type 2025 & 2033
- Figure 46: Middle East & Africa Lfl Lighting Product Volume Share (%), by Type 2025 & 2033
- Figure 47: Middle East & Africa Lfl Lighting Product Revenue (million), by Country 2025 & 2033
- Figure 48: Middle East & Africa Lfl Lighting Product Volume (K), by Country 2025 & 2033
- Figure 49: Middle East & Africa Lfl Lighting Product Revenue Share (%), by Country 2025 & 2033
- Figure 50: Middle East & Africa Lfl Lighting Product Volume Share (%), by Country 2025 & 2033
- Figure 51: Asia Pacific Lfl Lighting Product Revenue (million), by Application 2025 & 2033
- Figure 52: Asia Pacific Lfl Lighting Product Volume (K), by Application 2025 & 2033
- Figure 53: Asia Pacific Lfl Lighting Product Revenue Share (%), by Application 2025 & 2033
- Figure 54: Asia Pacific Lfl Lighting Product Volume Share (%), by Application 2025 & 2033
- Figure 55: Asia Pacific Lfl Lighting Product Revenue (million), by Type 2025 & 2033
- Figure 56: Asia Pacific Lfl Lighting Product Volume (K), by Type 2025 & 2033
- Figure 57: Asia Pacific Lfl Lighting Product Revenue Share (%), by Type 2025 & 2033
- Figure 58: Asia Pacific Lfl Lighting Product Volume Share (%), by Type 2025 & 2033
- Figure 59: Asia Pacific Lfl Lighting Product Revenue (million), by Country 2025 & 2033
- Figure 60: Asia Pacific Lfl Lighting Product Volume (K), by Country 2025 & 2033
- Figure 61: Asia Pacific Lfl Lighting Product Revenue Share (%), by Country 2025 & 2033
- Figure 62: Asia Pacific Lfl Lighting Product Volume Share (%), by Country 2025 & 2033
List of Tables
- Table 1: Global Lfl Lighting Product Revenue million Forecast, by Application 2020 & 2033
- Table 2: Global Lfl Lighting Product Volume K Forecast, by Application 2020 & 2033
- Table 3: Global Lfl Lighting Product Revenue million Forecast, by Type 2020 & 2033
- Table 4: Global Lfl Lighting Product Volume K Forecast, by Type 2020 & 2033
- Table 5: Global Lfl Lighting Product Revenue million Forecast, by Region 2020 & 2033
- Table 6: Global Lfl Lighting Product Volume K Forecast, by Region 2020 & 2033
- Table 7: Global Lfl Lighting Product Revenue million Forecast, by Application 2020 & 2033
- Table 8: Global Lfl Lighting Product Volume K Forecast, by Application 2020 & 2033
- Table 9: Global Lfl Lighting Product Revenue million Forecast, by Type 2020 & 2033
- Table 10: Global Lfl Lighting Product Volume K Forecast, by Type 2020 & 2033
- Table 11: Global Lfl Lighting Product Revenue million Forecast, by Country 2020 & 2033
- Table 12: Global Lfl Lighting Product Volume K Forecast, by Country 2020 & 2033
- Table 13: United States Lfl Lighting Product Revenue (million) Forecast, by Application 2020 & 2033
- Table 14: United States Lfl Lighting Product Volume (K) Forecast, by Application 2020 & 2033
- Table 15: Canada Lfl Lighting Product Revenue (million) Forecast, by Application 2020 & 2033
- Table 16: Canada Lfl Lighting Product Volume (K) Forecast, by Application 2020 & 2033
- Table 17: Mexico Lfl Lighting Product Revenue (million) Forecast, by Application 2020 & 2033
- Table 18: Mexico Lfl Lighting Product Volume (K) Forecast, by Application 2020 & 2033
- Table 19: Global Lfl Lighting Product Revenue million Forecast, by Application 2020 & 2033
- Table 20: Global Lfl Lighting Product Volume K Forecast, by Application 2020 & 2033
- Table 21: Global Lfl Lighting Product Revenue million Forecast, by Type 2020 & 2033
- Table 22: Global Lfl Lighting Product Volume K Forecast, by Type 2020 & 2033
- Table 23: Global Lfl Lighting Product Revenue million Forecast, by Country 2020 & 2033
- Table 24: Global Lfl Lighting Product Volume K Forecast, by Country 2020 & 2033
- Table 25: Brazil Lfl Lighting Product Revenue (million) Forecast, by Application 2020 & 2033
- Table 26: Brazil Lfl Lighting Product Volume (K) Forecast, by Application 2020 & 2033
- Table 27: Argentina Lfl Lighting Product Revenue (million) Forecast, by Application 2020 & 2033
- Table 28: Argentina Lfl Lighting Product Volume (K) Forecast, by Application 2020 & 2033
- Table 29: Rest of South America Lfl Lighting Product Revenue (million) Forecast, by Application 2020 & 2033
- Table 30: Rest of South America Lfl Lighting Product Volume (K) Forecast, by Application 2020 & 2033
- Table 31: Global Lfl Lighting Product Revenue million Forecast, by Application 2020 & 2033
- Table 32: Global Lfl Lighting Product Volume K Forecast, by Application 2020 & 2033
- Table 33: Global Lfl Lighting Product Revenue million Forecast, by Type 2020 & 2033
- Table 34: Global Lfl Lighting Product Volume K Forecast, by Type 2020 & 2033
- Table 35: Global Lfl Lighting Product Revenue million Forecast, by Country 2020 & 2033
- Table 36: Global Lfl Lighting Product Volume K Forecast, by Country 2020 & 2033
- Table 37: United Kingdom Lfl Lighting Product Revenue (million) Forecast, by Application 2020 & 2033
- Table 38: United Kingdom Lfl Lighting Product Volume (K) Forecast, by Application 2020 & 2033
- Table 39: Germany Lfl Lighting Product Revenue (million) Forecast, by Application 2020 & 2033
- Table 40: Germany Lfl Lighting Product Volume (K) Forecast, by Application 2020 & 2033
- Table 41: France Lfl Lighting Product Revenue (million) Forecast, by Application 2020 & 2033
- Table 42: France Lfl Lighting Product Volume (K) Forecast, by Application 2020 & 2033
- Table 43: Italy Lfl Lighting Product Revenue (million) Forecast, by Application 2020 & 2033
- Table 44: Italy Lfl Lighting Product Volume (K) Forecast, by Application 2020 & 2033
- Table 45: Spain Lfl Lighting Product Revenue (million) Forecast, by Application 2020 & 2033
- Table 46: Spain Lfl Lighting Product Volume (K) Forecast, by Application 2020 & 2033
- Table 47: Russia Lfl Lighting Product Revenue (million) Forecast, by Application 2020 & 2033
- Table 48: Russia Lfl Lighting Product Volume (K) Forecast, by Application 2020 & 2033
- Table 49: Benelux Lfl Lighting Product Revenue (million) Forecast, by Application 2020 & 2033
- Table 50: Benelux Lfl Lighting Product Volume (K) Forecast, by Application 2020 & 2033
- Table 51: Nordics Lfl Lighting Product Revenue (million) Forecast, by Application 2020 & 2033
- Table 52: Nordics Lfl Lighting Product Volume (K) Forecast, by Application 2020 & 2033
- Table 53: Rest of Europe Lfl Lighting Product Revenue (million) Forecast, by Application 2020 & 2033
- Table 54: Rest of Europe Lfl Lighting Product Volume (K) Forecast, by Application 2020 & 2033
- Table 55: Global Lfl Lighting Product Revenue million Forecast, by Application 2020 & 2033
- Table 56: Global Lfl Lighting Product Volume K Forecast, by Application 2020 & 2033
- Table 57: Global Lfl Lighting Product Revenue million Forecast, by Type 2020 & 2033
- Table 58: Global Lfl Lighting Product Volume K Forecast, by Type 2020 & 2033
- Table 59: Global Lfl Lighting Product Revenue million Forecast, by Country 2020 & 2033
- Table 60: Global Lfl Lighting Product Volume K Forecast, by Country 2020 & 2033
- Table 61: Turkey Lfl Lighting Product Revenue (million) Forecast, by Application 2020 & 2033
- Table 62: Turkey Lfl Lighting Product Volume (K) Forecast, by Application 2020 & 2033
- Table 63: Israel Lfl Lighting Product Revenue (million) Forecast, by Application 2020 & 2033
- Table 64: Israel Lfl Lighting Product Volume (K) Forecast, by Application 2020 & 2033
- Table 65: GCC Lfl Lighting Product Revenue (million) Forecast, by Application 2020 & 2033
- Table 66: GCC Lfl Lighting Product Volume (K) Forecast, by Application 2020 & 2033
- Table 67: North Africa Lfl Lighting Product Revenue (million) Forecast, by Application 2020 & 2033
- Table 68: North Africa Lfl Lighting Product Volume (K) Forecast, by Application 2020 & 2033
- Table 69: South Africa Lfl Lighting Product Revenue (million) Forecast, by Application 2020 & 2033
- Table 70: South Africa Lfl Lighting Product Volume (K) Forecast, by Application 2020 & 2033
- Table 71: Rest of Middle East & Africa Lfl Lighting Product Revenue (million) Forecast, by Application 2020 & 2033
- Table 72: Rest of Middle East & Africa Lfl Lighting Product Volume (K) Forecast, by Application 2020 & 2033
- Table 73: Global Lfl Lighting Product Revenue million Forecast, by Application 2020 & 2033
- Table 74: Global Lfl Lighting Product Volume K Forecast, by Application 2020 & 2033
- Table 75: Global Lfl Lighting Product Revenue million Forecast, by Type 2020 & 2033
- Table 76: Global Lfl Lighting Product Volume K Forecast, by Type 2020 & 2033
- Table 77: Global Lfl Lighting Product Revenue million Forecast, by Country 2020 & 2033
- Table 78: Global Lfl Lighting Product Volume K Forecast, by Country 2020 & 2033
- Table 79: China Lfl Lighting Product Revenue (million) Forecast, by Application 2020 & 2033
- Table 80: China Lfl Lighting Product Volume (K) Forecast, by Application 2020 & 2033
- Table 81: India Lfl Lighting Product Revenue (million) Forecast, by Application 2020 & 2033
- Table 82: India Lfl Lighting Product Volume (K) Forecast, by Application 2020 & 2033
- Table 83: Japan Lfl Lighting Product Revenue (million) Forecast, by Application 2020 & 2033
- Table 84: Japan Lfl Lighting Product Volume (K) Forecast, by Application 2020 & 2033
- Table 85: South Korea Lfl Lighting Product Revenue (million) Forecast, by Application 2020 & 2033
- Table 86: South Korea Lfl Lighting Product Volume (K) Forecast, by Application 2020 & 2033
- Table 87: ASEAN Lfl Lighting Product Revenue (million) Forecast, by Application 2020 & 2033
- Table 88: ASEAN Lfl Lighting Product Volume (K) Forecast, by Application 2020 & 2033
- Table 89: Oceania Lfl Lighting Product Revenue (million) Forecast, by Application 2020 & 2033
- Table 90: Oceania Lfl Lighting Product Volume (K) Forecast, by Application 2020 & 2033
- Table 91: Rest of Asia Pacific Lfl Lighting Product Revenue (million) Forecast, by Application 2020 & 2033
- Table 92: Rest of Asia Pacific Lfl Lighting Product Volume (K) Forecast, by Application 2020 & 2033
Frequently Asked Questions
1. What is the projected Compound Annual Growth Rate (CAGR) of the Lfl Lighting Product?
The projected CAGR is approximately XXX%.
2. Which companies are prominent players in the Lfl Lighting Product?
Key companies in the market include GE lighting, Philips NV., Panasonic Corporation, OSRAM Licht AG, Schneider Electric, Cree INC., Citizen Electronics, Lumerica, Havells India Pvt, LEDtronics, Inc., Patriot LED, Acuity Brands.
3. What are the main segments of the Lfl Lighting Product?
The market segments include Application, Type.
4. Can you provide details about the market size?
The market size is estimated to be USD XXX million as of 2022.
5. What are some drivers contributing to market growth?
N/A
6. What are the notable trends driving market growth?
N/A
7. Are there any restraints impacting market growth?
N/A
8. Can you provide examples of recent developments in the market?
N/A
9. What pricing options are available for accessing the report?
Pricing options include single-user, multi-user, and enterprise licenses priced at USD 3950.00, USD 5925.00, and USD 7900.00 respectively.
10. Is the market size provided in terms of value or volume?
The market size is provided in terms of value, measured in million and volume, measured in K.
11. Are there any specific market keywords associated with the report?
Yes, the market keyword associated with the report is "Lfl Lighting Product," which aids in identifying and referencing the specific market segment covered.
12. How do I determine which pricing option suits my needs best?
The pricing options vary based on user requirements and access needs. Individual users may opt for single-user licenses, while businesses requiring broader access may choose multi-user or enterprise licenses for cost-effective access to the report.
13. Are there any additional resources or data provided in the Lfl Lighting Product report?
While the report offers comprehensive insights, it's advisable to review the specific contents or supplementary materials provided to ascertain if additional resources or data are available.
14. How can I stay updated on further developments or reports in the Lfl Lighting Product?
To stay informed about further developments, trends, and reports in the Lfl Lighting Product, consider subscribing to industry newsletters, following relevant companies and organizations, or regularly checking reputable industry news sources and publications.
Methodology
Step 1 - Identification of Relevant Samples Size from Population Database


Step 2 - Approaches for Defining Global Market Size (Value, Volume* & Price*)

Note*: In applicable scenarios
Step 3 - Data Sources
Primary Research
- Web Analytics
- Survey Reports
- Research Institute
- Latest Research Reports
- Opinion Leaders
Secondary Research
- Annual Reports
- White Paper
- Latest Press Release
- Industry Association
- Paid Database
- Investor Presentations

Step 4 - Data Triangulation
Involves using different sources of information in order to increase the validity of a study
These sources are likely to be stakeholders in a program - participants, other researchers, program staff, other community members, and so on.
Then we put all data in single framework & apply various statistical tools to find out the dynamic on the market.
During the analysis stage, feedback from the stakeholder groups would be compared to determine areas of agreement as well as areas of divergence