

Key Insights
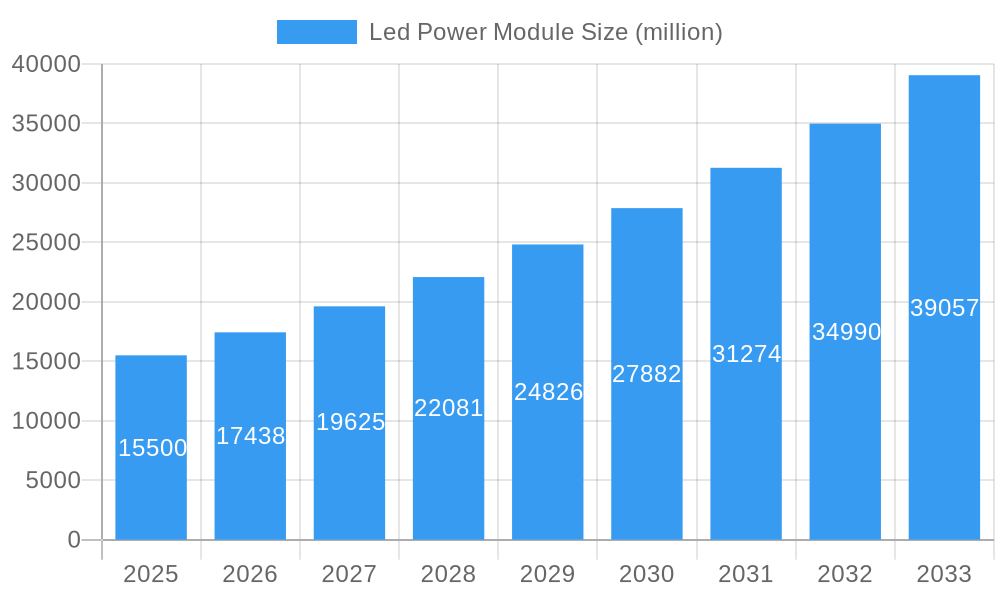
The global LED Power Module market is poised for significant expansion, projected to reach an estimated USD 15,500 million by 2025, with a robust Compound Annual Growth Rate (CAGR) of 12.5% over the forecast period of 2025-2033. This growth is primarily fueled by the escalating adoption of LED technology across diverse applications, driven by its inherent energy efficiency, extended lifespan, and superior illumination quality. The automotive sector, in particular, is a substantial contributor, with increasing demand for advanced LED lighting solutions for headlights, taillights, and interior illumination, aligning with stringent fuel efficiency regulations and the pursuit of enhanced vehicle aesthetics and safety. Consumer electronics, including smartphones, televisions, and wearables, also represent a substantial segment, leveraging the compact size and brightness of LED power modules. Furthermore, the burgeoning smart home trend and the continuous innovation in home appliances are creating sustained demand.
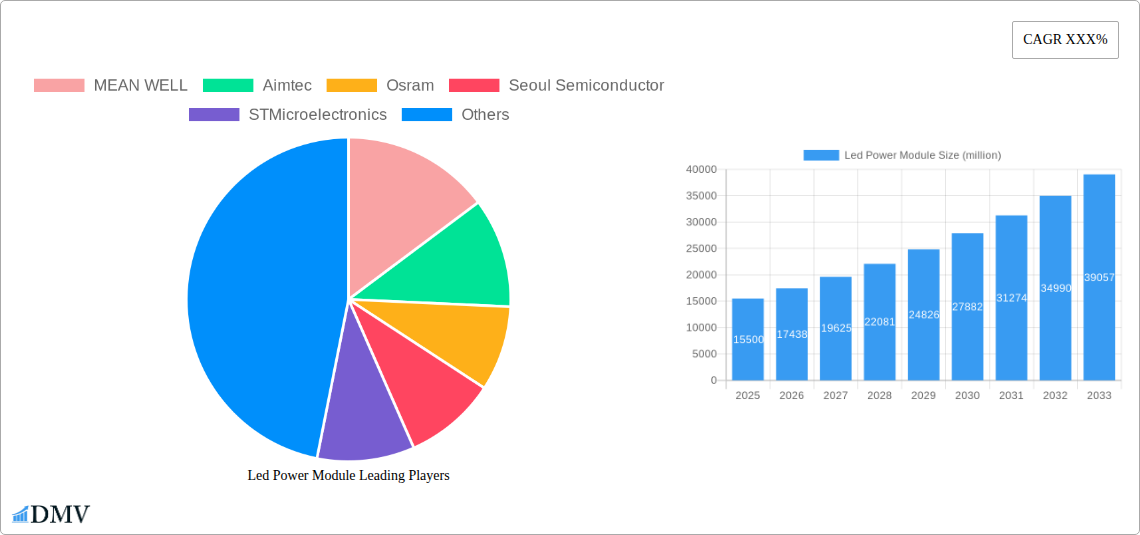
Led Power Module Market Size (In Billion)
The market's trajectory is also influenced by ongoing technological advancements, such as the development of higher-efficiency and more compact LED power modules, alongside the integration of smart features like dimming and color tuning capabilities. The industrial sector, encompassing lighting for factories, warehouses, and infrastructure, is experiencing a shift towards LED solutions for improved visibility and reduced operational costs. While the market exhibits strong growth potential, certain restraints, such as the initial high cost of some advanced LED power modules and the need for specialized installation expertise in certain applications, could temper immediate widespread adoption. However, the increasing availability of cost-effective solutions and the long-term operational savings associated with LEDs are expected to mitigate these challenges, ensuring a dynamic and expanding market landscape.
Led Power Module Company Market Share
Led Power Module Market Composition & Trends
The global Led Power Module market is characterized by dynamic evolution, driven by rapid technological advancements and increasing demand across diverse applications. Market concentration is moderate, with key players like MEAN WELL, Aimtec, Osram, Seoul Semiconductor, and STMicroelectronics holding significant shares. Innovation catalysts include the miniaturization of components, enhanced energy efficiency, and the development of smart functionalities for IoT integration. Regulatory landscapes, particularly concerning energy efficiency standards and safety certifications, play a crucial role in shaping market entry and product development. Substitute products, such as traditional lighting solutions, are steadily losing ground to the superior performance and longevity of LED technology. End-user profiles are broadening, encompassing automotive manufacturers seeking advanced lighting solutions, consumer electronics companies integrating LEDs into their devices, and industrial sectors demanding robust and reliable power management. Merger and acquisition (M&A) activities are anticipated to intensify as larger players seek to consolidate market positions and acquire specialized technologies. M&A deal values are projected to range from tens of millions to hundreds of millions of dollars, with strategic acquisitions focusing on companies with expertise in high-voltage modules or advanced driver ICs. The market share distribution indicates a growing prominence of integrated LED power solutions, catering to simplified design and installation processes.
- Market Concentration: Moderate, with increasing consolidation predicted.
- Innovation Catalysts: Miniaturization, energy efficiency, smart features, IoT integration.
- Regulatory Landscapes: Energy efficiency standards (e.g., Energy Star), safety certifications.
- Substitute Products: Traditional lighting, halogen lamps.
- End-User Profiles: Automotive, consumer electronics, home appliance, industrial, signage, architectural lighting.
- M&A Activities: Expected to rise, targeting technology acquisition and market share expansion.
- M&A Deal Values (Estimated): Up to $XXX million.
- Market Share Distribution: Growing share for integrated and intelligent LED power modules.
Led Power Module Industry Evolution
The Led Power Module industry has witnessed a transformative journey throughout the study period of 2019–2033, marked by consistent growth and technological breakthroughs. During the historical period (2019–2024), the market was primarily fueled by the increasing adoption of LED lighting in general illumination, automotive applications, and consumer electronics. This era saw significant strides in improving the luminous efficacy of LEDs and the development of more sophisticated driver circuits, leading to a projected market size expansion from approximately $XX,XXX million in 2019 to an estimated $XX,XXX million by 2024. The base year, 2025, serves as a crucial pivot point, with the market poised for accelerated growth driven by emerging technologies and expanding application areas.
Technological advancements have been the cornerstone of this evolution. The shift from discrete components to integrated LED power modules has simplified system design, reduced manufacturing costs, and enhanced reliability. Key innovations include the development of high-voltage LED power modules, catering to applications requiring higher operating voltages and fewer parallel strings of LEDs, thereby improving system efficiency and reducing component count. Medium-voltage and low-voltage modules continue to be significant, with advancements focusing on tighter regulation, improved thermal management, and increased power density. The emergence of smart lighting solutions, enabled by IoT connectivity and advanced control ICs, has further propelled the market. These intelligent modules allow for dimming, color tuning, and remote monitoring, meeting the growing demand for energy-efficient and customizable lighting environments.
Shifting consumer demands have also played a pivotal role. Consumers and businesses are increasingly prioritizing energy savings, longevity, and enhanced user experiences. This has translated into a higher demand for LED power modules that offer superior performance, lower energy consumption, and greater control over lighting output. The automotive sector, in particular, has been a major driver, with LED lighting becoming standard for headlights, taillights, and interior illumination, necessitating specialized, robust, and highly efficient LED power modules. Consumer electronics, from smart home devices to displays, are also witnessing a surge in LED power module integration, driven by the pursuit of compact designs and improved visual experiences.
Looking towards the forecast period (2025–2033), the market growth trajectory is projected to remain robust, with an estimated Compound Annual Growth Rate (CAGR) of XX.X% from 2025 to 2033. This growth will be underpinned by continued innovation in areas such as GaN-based power devices for higher efficiency, advanced thermal management techniques, and the integration of artificial intelligence for predictive maintenance and optimized performance. The adoption of LED power modules in emerging applications like solid-state lighting in horticulture, advanced driver-assistance systems (ADAS) in vehicles, and specialized industrial lighting solutions will further fuel market expansion. The estimated market size is expected to reach upwards of $XXX,XXX million by 2033, a testament to the enduring and expanding relevance of Led Power Modules across a multitude of industries.
Leading Regions, Countries, or Segments in Led Power Module
The global Led Power Module market exhibits distinct regional dominance and segment leadership, driven by a confluence of technological adoption, industrial development, and regulatory support. Asia Pacific stands out as the leading region, primarily due to its robust manufacturing capabilities, significant investments in infrastructure, and a rapidly growing demand for energy-efficient lighting solutions across diverse sectors. Countries within this region, particularly China, South Korea, and Japan, are at the forefront of both production and consumption. China, with its vast manufacturing base and government initiatives promoting LED adoption, plays a pivotal role in driving down costs and increasing accessibility. South Korea and Japan are recognized for their technological innovation and high adoption rates in consumer electronics and automotive applications, respectively.
Within the Application segment, Consumer Electronics and Industrial applications are expected to dominate. Consumer electronics, including smartphones, televisions, and home appliances, represent a massive and consistent demand for low-voltage and medium-voltage LED power modules. The proliferation of smart home devices, where LED lighting plays an integral role in ambiance and functionality, further strengthens this segment. The Industrial segment, encompassing factory automation, intelligent street lighting, and specialized machinery, requires durable, high-performance, and reliable LED power solutions, often operating under demanding conditions. The trend towards smart factories and the increasing need for energy-efficient operational lighting in industrial settings are significant growth drivers.
The Automotive application segment is also exhibiting substantial growth. The electrification of vehicles and the increasing sophistication of automotive lighting systems, including adaptive headlights and complex interior lighting schemes, necessitate advanced LED power modules. Regulatory mandates for improved vehicle safety and efficiency are further accelerating the adoption of LED technology in this sector.
In terms of Type, Low Voltage modules continue to hold a significant market share due to their widespread use in consumer electronics and general lighting. However, High Voltage LED power modules are experiencing a more rapid growth rate. This is attributed to their suitability for applications requiring higher power density, reduced component count, and enhanced system efficiency, such as large-scale architectural lighting, commercial displays, and certain industrial lighting scenarios. The increasing complexity and power requirements of modern LED installations are pushing the demand for high-voltage solutions.
- Dominant Region: Asia Pacific
- Key Drivers in Asia Pacific:
- Strong manufacturing base and supply chain.
- Government initiatives promoting energy efficiency.
- Rapid urbanization and infrastructure development.
- High consumer demand for smart and efficient electronics.
- Key Drivers in Asia Pacific:
- Leading Application Segments:
- Consumer Electronics: Ubiquitous integration in devices, growing smart home market.
- Key Drivers: Miniaturization, energy efficiency, aesthetic appeal, IoT integration.
- Industrial: Demand for robust, reliable, and energy-efficient lighting in factories and infrastructure.
- Key Drivers: Automation, operational efficiency, safety regulations, smart city initiatives.
- Automotive: Sophisticated lighting systems, safety mandates, EV growth.
- Key Drivers: Advanced driver-assistance systems (ADAS), design flexibility, energy savings.
- Consumer Electronics: Ubiquitous integration in devices, growing smart home market.
- Dominant Voltage Type:
- Low Voltage: Continued high demand due to broad application.
- High Voltage: Fastest-growing segment driven by power density and system efficiency needs.
- Key Drivers: Architectural lighting, large-scale displays, commercial installations.
Led Power Module Product Innovations
Recent product innovations in the Led Power Module market are characterized by a relentless pursuit of higher efficiency, increased intelligence, and enhanced reliability. Companies like MEAN WELL are introducing highly efficient, compact power supplies with advanced protection features for industrial applications. Aimtec is focusing on isolated and non-isolated DC-DC converters optimized for LED driving with superior thermal performance. Seoul Semiconductor is pushing the boundaries of LED chip technology, which directly impacts the performance and efficiency of the power modules designed to drive them. Innovations are also seen in the integration of communication protocols like DALI and Bluetooth for smart lighting control, enabling features such as dimming, color temperature adjustment, and remote diagnostics. Furthermore, the development of modules with integrated surge protection and enhanced electromagnetic compatibility (EMC) is crucial for applications in harsh environments and automotive settings. Performance metrics such as power conversion efficiency exceeding 95%, reduced standby power consumption below 0.5W, and extended operating temperature ranges are becoming standard benchmarks for new product introductions.
Propelling Factors for Led Power Module Growth
The growth of the Led Power Module market is propelled by a synergistic interplay of technological advancements, economic drivers, and favorable regulatory environments. Technological innovations, such as the development of GaN-based power semiconductors, are leading to higher efficiency and smaller form factors for LED power modules. The increasing demand for energy-efficient lighting solutions across residential, commercial, and industrial sectors is a significant economic driver, translating into substantial cost savings on electricity bills. Government initiatives and stringent energy efficiency standards worldwide are mandating the adoption of LED lighting, thereby creating a robust market for associated power modules. Furthermore, the expanding applications of LED technology in emerging fields like automotive lighting, horticultural lighting, and advanced displays are creating new avenues for market expansion. The continuous drive towards smart cities and the integration of IoT devices further necessitates intelligent and connected LED power modules, fueling sustained growth.
- Technological Advancements: High-efficiency semiconductors (e.g., GaN), miniaturization, smart control integration.
- Economic Drivers: Demand for energy savings and cost reduction, growing smart home market.
- Regulatory Influences: Energy efficiency mandates, environmental regulations, government incentives for LED adoption.
- Emerging Applications: Automotive lighting (ADAS, EVs), horticultural lighting, digital signage, architectural lighting.
Obstacles in the Led Power Module Market
Despite the robust growth, the Led Power Module market faces several obstacles that could temper its expansion. Supply chain disruptions, exacerbated by geopolitical events and raw material shortages, can lead to increased manufacturing costs and lead times, impacting product availability and pricing. Intensifying price competition among manufacturers, particularly in commoditized segments, puts pressure on profit margins and can hinder investment in research and development. Evolving and complex regulatory landscapes across different regions can create compliance challenges and add to product development costs. Furthermore, the initial upfront cost of LED lighting systems, although offset by long-term energy savings, can still be a barrier for some consumers and businesses, especially in price-sensitive markets. Technological obsolescence is another concern, as rapid innovation can render older module designs outdated, requiring continuous investment in R&D to remain competitive.
- Supply Chain Disruptions: Raw material shortages, logistics challenges.
- Price Competition: Pressure on profit margins, commoditization of certain segments.
- Regulatory Complexity: Varying standards across regions, compliance costs.
- Initial Investment Costs: Higher upfront cost compared to traditional lighting.
- Technological Obsolescence: Rapid innovation cycles requiring continuous R&D.
Future Opportunities in Led Power Module
The future of the Led Power Module market is replete with emerging opportunities driven by innovation and evolving market needs. The burgeoning Internet of Things (IoT) ecosystem presents a significant opportunity for smart and connected LED power modules that can integrate seamlessly with smart home and building management systems. The automotive sector, with its increasing electrification and demand for advanced lighting functionalities, will continue to be a major growth area. Innovations in biologically-friendly lighting and horticultural lighting are opening up new niche markets with high growth potential. Furthermore, the ongoing development of more efficient and sustainable materials in LED and power module manufacturing, coupled with advancements in wireless power transfer for LED lighting, could unlock entirely new application paradigms and market segments. The demand for customized and application-specific power solutions will also continue to drive opportunities for specialized manufacturers.
- IoT Integration: Smart lighting, connected homes, smart buildings.
- Automotive Sector: Advanced lighting, EVs, ADAS.
- Niche Markets: Horticultural lighting, biologically-friendly lighting.
- Sustainable Technologies: Eco-friendly materials, wireless power transfer for LEDs.
- Customized Solutions: Application-specific power module development.
Major Players in the Led Power Module Ecosystem
The Led Power Module ecosystem is comprised of a diverse range of manufacturers, component suppliers, and system integrators. Key players driving innovation and market growth include:
- MEAN WELL
- Aimtec
- Osram
- Seoul Semiconductor
- STMicroelectronics
- Luminus Devices
- Delta Group
- Bridge Lux
- Fulham
- ERP Power
- Adafruit Industries
- XP Power
- Molex
- Lumex Opto
- Hatch Lighting
- Carlo Gavazzi
Key Developments in Led Power Module Industry
- 2023 Q4: STMicroelectronics launched a new series of highly integrated LED drivers with advanced dimming capabilities, targeting the consumer electronics market.
- 2024 Q1: MEAN WELL expanded its industrial power supply portfolio with ultra-high efficiency modules designed for demanding environments, contributing to significant energy savings.
- 2024 Q2: Osram announced advancements in their LED chip technology, promising higher luminous efficacy and improved color rendering, directly impacting LED power module requirements.
- 2024 Q3: Seoul Semiconductor unveiled innovative solutions for automotive adaptive lighting, requiring specialized LED power modules with precise control and high reliability.
- 2024 Q4: Aimtec introduced a new range of compact, isolated DC-DC converters optimized for LED drivers, enabling smaller and more robust lighting designs.
- 2025 Q1 (Estimated): Anticipated increase in M&A activity, with companies focusing on acquiring specialized expertise in high-voltage LED power management.
- 2025 Q2 (Estimated): Launch of new smart LED power modules with enhanced IoT connectivity and AI-driven predictive maintenance features.
Strategic Led Power Module Market Forecast
The strategic forecast for the Led Power Module market is overwhelmingly positive, driven by continued technological innovation and expanding application horizons. The robust demand for energy-efficient solutions, coupled with supportive government policies, will continue to fuel market growth. Key growth catalysts include the increasing adoption of smart lighting systems powered by IoT, the burgeoning electric vehicle market's need for advanced automotive lighting, and the expansion of LED technology into novel areas like horticulture and biophotonics. As the market matures, we anticipate further consolidation through strategic mergers and acquisitions, leading to a more streamlined competitive landscape. The focus will remain on developing higher efficiency, more intelligent, and cost-effective LED power modules to meet the evolving demands of a global market committed to sustainable and advanced lighting solutions. The overall market potential remains substantial, with consistent year-over-year growth projected throughout the forecast period.
Led Power Module Segmentation
-
1. Application
- 1.1. Automotive
- 1.2. Consumer Electronics
- 1.3. Home Appliance
- 1.4. Industrial
- 1.5. Others
-
2. Type
- 2.1. High Voltage
- 2.2. Medium Voltage
- 2.3. Low Voltage
Led Power Module Segmentation By Geography
-
1. North America
- 1.1. United States
- 1.2. Canada
- 1.3. Mexico
-
2. South America
- 2.1. Brazil
- 2.2. Argentina
- 2.3. Rest of South America
-
3. Europe
- 3.1. United Kingdom
- 3.2. Germany
- 3.3. France
- 3.4. Italy
- 3.5. Spain
- 3.6. Russia
- 3.7. Benelux
- 3.8. Nordics
- 3.9. Rest of Europe
-
4. Middle East & Africa
- 4.1. Turkey
- 4.2. Israel
- 4.3. GCC
- 4.4. North Africa
- 4.5. South Africa
- 4.6. Rest of Middle East & Africa
-
5. Asia Pacific
- 5.1. China
- 5.2. India
- 5.3. Japan
- 5.4. South Korea
- 5.5. ASEAN
- 5.6. Oceania
- 5.7. Rest of Asia Pacific
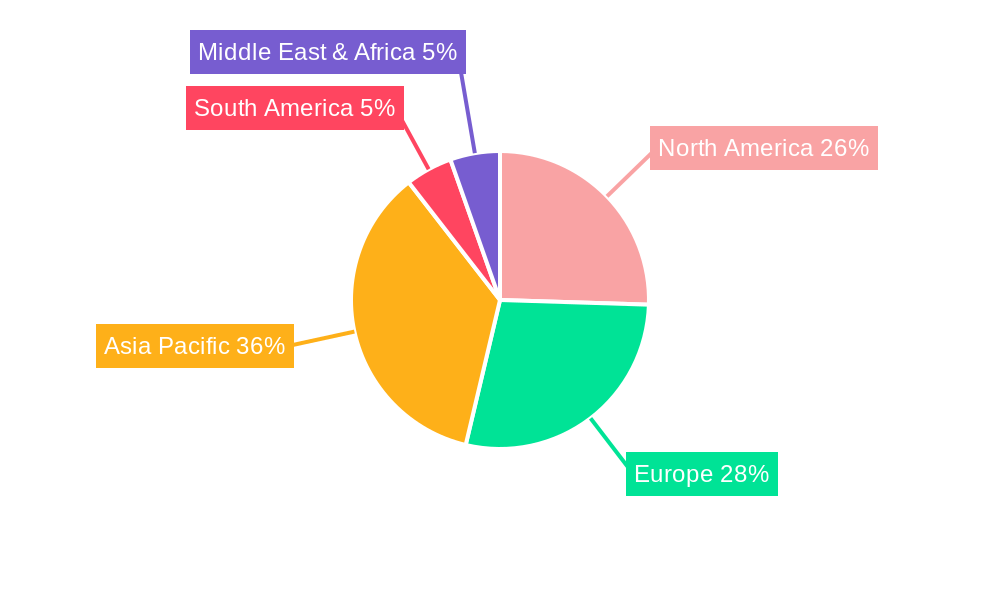
Led Power Module Regional Market Share
Geographic Coverage of Led Power Module
Led Power Module REPORT HIGHLIGHTS
| Aspects | Details |
|---|---|
| Study Period | 2020-2034 |
| Base Year | 2025 |
| Estimated Year | 2026 |
| Forecast Period | 2026-2034 |
| Historical Period | 2020-2025 |
| Growth Rate | CAGR of XXX% from 2020-2034 |
| Segmentation |
|
Table of Contents
- 1. Introduction
- 1.1. Research Scope
- 1.2. Market Segmentation
- 1.3. Research Objective
- 1.4. Definitions and Assumptions
- 2. Executive Summary
- 2.1. Market Snapshot
- 3. Market Dynamics
- 3.1. Market Drivers
- 3.2. Market Restrains
- 3.3. Market Trends
- 3.4. Market Opportunities
- 4. Market Factor Analysis
- 4.1. Porters Five Forces
- 4.1.1. Bargaining Power of Suppliers
- 4.1.2. Bargaining Power of Buyers
- 4.1.3. Threat of New Entrants
- 4.1.4. Threat of Substitutes
- 4.1.5. Competitive Rivalry
- 4.2. PESTEL analysis
- 4.3. BCG Analysis
- 4.3.1. Stars (High Growth, High Market Share)
- 4.3.2. Cash Cows (Low Growth, High Market Share)
- 4.3.3. Question Mark (High Growth, Low Market Share)
- 4.3.4. Dogs (Low Growth, Low Market Share)
- 4.4. Ansoff Matrix Analysis
- 4.5. Supply Chain Analysis
- 4.6. Regulatory Landscape
- 4.7. Current Market Potential and Opportunity Assessment (TAM–SAM–SOM Framework)
- 4.8. DMV Analyst Note
- 4.1. Porters Five Forces
- 5. Market Analysis, Insights and Forecast 2021-2033
- 5.1. Market Analysis, Insights and Forecast - by Application
- 5.1.1. Automotive
- 5.1.2. Consumer Electronics
- 5.1.3. Home Appliance
- 5.1.4. Industrial
- 5.1.5. Others
- 5.2. Market Analysis, Insights and Forecast - by Type
- 5.2.1. High Voltage
- 5.2.2. Medium Voltage
- 5.2.3. Low Voltage
- 5.3. Market Analysis, Insights and Forecast - by Region
- 5.3.1. North America
- 5.3.2. South America
- 5.3.3. Europe
- 5.3.4. Middle East & Africa
- 5.3.5. Asia Pacific
- 5.1. Market Analysis, Insights and Forecast - by Application
- 6. Global Led Power Module Analysis, Insights and Forecast, 2021-2033
- 6.1. Market Analysis, Insights and Forecast - by Application
- 6.1.1. Automotive
- 6.1.2. Consumer Electronics
- 6.1.3. Home Appliance
- 6.1.4. Industrial
- 6.1.5. Others
- 6.2. Market Analysis, Insights and Forecast - by Type
- 6.2.1. High Voltage
- 6.2.2. Medium Voltage
- 6.2.3. Low Voltage
- 6.1. Market Analysis, Insights and Forecast - by Application
- 7. North America Led Power Module Analysis, Insights and Forecast, 2020-2032
- 7.1. Market Analysis, Insights and Forecast - by Application
- 7.1.1. Automotive
- 7.1.2. Consumer Electronics
- 7.1.3. Home Appliance
- 7.1.4. Industrial
- 7.1.5. Others
- 7.2. Market Analysis, Insights and Forecast - by Type
- 7.2.1. High Voltage
- 7.2.2. Medium Voltage
- 7.2.3. Low Voltage
- 7.1. Market Analysis, Insights and Forecast - by Application
- 8. South America Led Power Module Analysis, Insights and Forecast, 2020-2032
- 8.1. Market Analysis, Insights and Forecast - by Application
- 8.1.1. Automotive
- 8.1.2. Consumer Electronics
- 8.1.3. Home Appliance
- 8.1.4. Industrial
- 8.1.5. Others
- 8.2. Market Analysis, Insights and Forecast - by Type
- 8.2.1. High Voltage
- 8.2.2. Medium Voltage
- 8.2.3. Low Voltage
- 8.1. Market Analysis, Insights and Forecast - by Application
- 9. Europe Led Power Module Analysis, Insights and Forecast, 2020-2032
- 9.1. Market Analysis, Insights and Forecast - by Application
- 9.1.1. Automotive
- 9.1.2. Consumer Electronics
- 9.1.3. Home Appliance
- 9.1.4. Industrial
- 9.1.5. Others
- 9.2. Market Analysis, Insights and Forecast - by Type
- 9.2.1. High Voltage
- 9.2.2. Medium Voltage
- 9.2.3. Low Voltage
- 9.1. Market Analysis, Insights and Forecast - by Application
- 10. Middle East & Africa Led Power Module Analysis, Insights and Forecast, 2020-2032
- 10.1. Market Analysis, Insights and Forecast - by Application
- 10.1.1. Automotive
- 10.1.2. Consumer Electronics
- 10.1.3. Home Appliance
- 10.1.4. Industrial
- 10.1.5. Others
- 10.2. Market Analysis, Insights and Forecast - by Type
- 10.2.1. High Voltage
- 10.2.2. Medium Voltage
- 10.2.3. Low Voltage
- 10.1. Market Analysis, Insights and Forecast - by Application
- 11. Asia Pacific Led Power Module Analysis, Insights and Forecast, 2020-2032
- 11.1. Market Analysis, Insights and Forecast - by Application
- 11.1.1. Automotive
- 11.1.2. Consumer Electronics
- 11.1.3. Home Appliance
- 11.1.4. Industrial
- 11.1.5. Others
- 11.2. Market Analysis, Insights and Forecast - by Type
- 11.2.1. High Voltage
- 11.2.2. Medium Voltage
- 11.2.3. Low Voltage
- 11.1. Market Analysis, Insights and Forecast - by Application
- 12. Competitive Analysis
- 12.1. Company Profiles
- 12.1.1 MEAN WELL
- 12.1.1.1. Company Overview
- 12.1.1.2. Products
- 12.1.1.3. Company Financials
- 12.1.1.4. SWOT Analysis
- 12.1.2 Aimtec
- 12.1.2.1. Company Overview
- 12.1.2.2. Products
- 12.1.2.3. Company Financials
- 12.1.2.4. SWOT Analysis
- 12.1.3 Osram
- 12.1.3.1. Company Overview
- 12.1.3.2. Products
- 12.1.3.3. Company Financials
- 12.1.3.4. SWOT Analysis
- 12.1.4 Seoul Semiconductor
- 12.1.4.1. Company Overview
- 12.1.4.2. Products
- 12.1.4.3. Company Financials
- 12.1.4.4. SWOT Analysis
- 12.1.5 STMicroelectronics
- 12.1.5.1. Company Overview
- 12.1.5.2. Products
- 12.1.5.3. Company Financials
- 12.1.5.4. SWOT Analysis
- 12.1.6 Luminus Devices
- 12.1.6.1. Company Overview
- 12.1.6.2. Products
- 12.1.6.3. Company Financials
- 12.1.6.4. SWOT Analysis
- 12.1.7 Delta Group
- 12.1.7.1. Company Overview
- 12.1.7.2. Products
- 12.1.7.3. Company Financials
- 12.1.7.4. SWOT Analysis
- 12.1.8 Bridge Lux
- 12.1.8.1. Company Overview
- 12.1.8.2. Products
- 12.1.8.3. Company Financials
- 12.1.8.4. SWOT Analysis
- 12.1.9 Fulham
- 12.1.9.1. Company Overview
- 12.1.9.2. Products
- 12.1.9.3. Company Financials
- 12.1.9.4. SWOT Analysis
- 12.1.10 ERP Power
- 12.1.10.1. Company Overview
- 12.1.10.2. Products
- 12.1.10.3. Company Financials
- 12.1.10.4. SWOT Analysis
- 12.1.11 Adafruit Industries
- 12.1.11.1. Company Overview
- 12.1.11.2. Products
- 12.1.11.3. Company Financials
- 12.1.11.4. SWOT Analysis
- 12.1.12 XP Power
- 12.1.12.1. Company Overview
- 12.1.12.2. Products
- 12.1.12.3. Company Financials
- 12.1.12.4. SWOT Analysis
- 12.1.13 Molex
- 12.1.13.1. Company Overview
- 12.1.13.2. Products
- 12.1.13.3. Company Financials
- 12.1.13.4. SWOT Analysis
- 12.1.14 Lumex Opto
- 12.1.14.1. Company Overview
- 12.1.14.2. Products
- 12.1.14.3. Company Financials
- 12.1.14.4. SWOT Analysis
- 12.1.15 Hatch Lighting
- 12.1.15.1. Company Overview
- 12.1.15.2. Products
- 12.1.15.3. Company Financials
- 12.1.15.4. SWOT Analysis
- 12.1.16 Carlo Gavazzi
- 12.1.16.1. Company Overview
- 12.1.16.2. Products
- 12.1.16.3. Company Financials
- 12.1.16.4. SWOT Analysis
- 12.1.1 MEAN WELL
- 12.2. Market Entropy
- 12.2.1 Company's Key Areas Served
- 12.2.2 Recent Developments
- 12.3. Company Market Share Analysis 2025
- 12.3.1 Top 5 Companies Market Share Analysis
- 12.3.2 Top 3 Companies Market Share Analysis
- 12.4. List of Potential Customers
- 13. Research Methodology
List of Figures
- Figure 1: Global Led Power Module Revenue Breakdown (million, %) by Region 2025 & 2033
- Figure 2: Global Led Power Module Volume Breakdown (K, %) by Region 2025 & 2033
- Figure 3: North America Led Power Module Revenue (million), by Application 2025 & 2033
- Figure 4: North America Led Power Module Volume (K), by Application 2025 & 2033
- Figure 5: North America Led Power Module Revenue Share (%), by Application 2025 & 2033
- Figure 6: North America Led Power Module Volume Share (%), by Application 2025 & 2033
- Figure 7: North America Led Power Module Revenue (million), by Type 2025 & 2033
- Figure 8: North America Led Power Module Volume (K), by Type 2025 & 2033
- Figure 9: North America Led Power Module Revenue Share (%), by Type 2025 & 2033
- Figure 10: North America Led Power Module Volume Share (%), by Type 2025 & 2033
- Figure 11: North America Led Power Module Revenue (million), by Country 2025 & 2033
- Figure 12: North America Led Power Module Volume (K), by Country 2025 & 2033
- Figure 13: North America Led Power Module Revenue Share (%), by Country 2025 & 2033
- Figure 14: North America Led Power Module Volume Share (%), by Country 2025 & 2033
- Figure 15: South America Led Power Module Revenue (million), by Application 2025 & 2033
- Figure 16: South America Led Power Module Volume (K), by Application 2025 & 2033
- Figure 17: South America Led Power Module Revenue Share (%), by Application 2025 & 2033
- Figure 18: South America Led Power Module Volume Share (%), by Application 2025 & 2033
- Figure 19: South America Led Power Module Revenue (million), by Type 2025 & 2033
- Figure 20: South America Led Power Module Volume (K), by Type 2025 & 2033
- Figure 21: South America Led Power Module Revenue Share (%), by Type 2025 & 2033
- Figure 22: South America Led Power Module Volume Share (%), by Type 2025 & 2033
- Figure 23: South America Led Power Module Revenue (million), by Country 2025 & 2033
- Figure 24: South America Led Power Module Volume (K), by Country 2025 & 2033
- Figure 25: South America Led Power Module Revenue Share (%), by Country 2025 & 2033
- Figure 26: South America Led Power Module Volume Share (%), by Country 2025 & 2033
- Figure 27: Europe Led Power Module Revenue (million), by Application 2025 & 2033
- Figure 28: Europe Led Power Module Volume (K), by Application 2025 & 2033
- Figure 29: Europe Led Power Module Revenue Share (%), by Application 2025 & 2033
- Figure 30: Europe Led Power Module Volume Share (%), by Application 2025 & 2033
- Figure 31: Europe Led Power Module Revenue (million), by Type 2025 & 2033
- Figure 32: Europe Led Power Module Volume (K), by Type 2025 & 2033
- Figure 33: Europe Led Power Module Revenue Share (%), by Type 2025 & 2033
- Figure 34: Europe Led Power Module Volume Share (%), by Type 2025 & 2033
- Figure 35: Europe Led Power Module Revenue (million), by Country 2025 & 2033
- Figure 36: Europe Led Power Module Volume (K), by Country 2025 & 2033
- Figure 37: Europe Led Power Module Revenue Share (%), by Country 2025 & 2033
- Figure 38: Europe Led Power Module Volume Share (%), by Country 2025 & 2033
- Figure 39: Middle East & Africa Led Power Module Revenue (million), by Application 2025 & 2033
- Figure 40: Middle East & Africa Led Power Module Volume (K), by Application 2025 & 2033
- Figure 41: Middle East & Africa Led Power Module Revenue Share (%), by Application 2025 & 2033
- Figure 42: Middle East & Africa Led Power Module Volume Share (%), by Application 2025 & 2033
- Figure 43: Middle East & Africa Led Power Module Revenue (million), by Type 2025 & 2033
- Figure 44: Middle East & Africa Led Power Module Volume (K), by Type 2025 & 2033
- Figure 45: Middle East & Africa Led Power Module Revenue Share (%), by Type 2025 & 2033
- Figure 46: Middle East & Africa Led Power Module Volume Share (%), by Type 2025 & 2033
- Figure 47: Middle East & Africa Led Power Module Revenue (million), by Country 2025 & 2033
- Figure 48: Middle East & Africa Led Power Module Volume (K), by Country 2025 & 2033
- Figure 49: Middle East & Africa Led Power Module Revenue Share (%), by Country 2025 & 2033
- Figure 50: Middle East & Africa Led Power Module Volume Share (%), by Country 2025 & 2033
- Figure 51: Asia Pacific Led Power Module Revenue (million), by Application 2025 & 2033
- Figure 52: Asia Pacific Led Power Module Volume (K), by Application 2025 & 2033
- Figure 53: Asia Pacific Led Power Module Revenue Share (%), by Application 2025 & 2033
- Figure 54: Asia Pacific Led Power Module Volume Share (%), by Application 2025 & 2033
- Figure 55: Asia Pacific Led Power Module Revenue (million), by Type 2025 & 2033
- Figure 56: Asia Pacific Led Power Module Volume (K), by Type 2025 & 2033
- Figure 57: Asia Pacific Led Power Module Revenue Share (%), by Type 2025 & 2033
- Figure 58: Asia Pacific Led Power Module Volume Share (%), by Type 2025 & 2033
- Figure 59: Asia Pacific Led Power Module Revenue (million), by Country 2025 & 2033
- Figure 60: Asia Pacific Led Power Module Volume (K), by Country 2025 & 2033
- Figure 61: Asia Pacific Led Power Module Revenue Share (%), by Country 2025 & 2033
- Figure 62: Asia Pacific Led Power Module Volume Share (%), by Country 2025 & 2033
List of Tables
- Table 1: Global Led Power Module Revenue million Forecast, by Application 2020 & 2033
- Table 2: Global Led Power Module Volume K Forecast, by Application 2020 & 2033
- Table 3: Global Led Power Module Revenue million Forecast, by Type 2020 & 2033
- Table 4: Global Led Power Module Volume K Forecast, by Type 2020 & 2033
- Table 5: Global Led Power Module Revenue million Forecast, by Region 2020 & 2033
- Table 6: Global Led Power Module Volume K Forecast, by Region 2020 & 2033
- Table 7: Global Led Power Module Revenue million Forecast, by Application 2020 & 2033
- Table 8: Global Led Power Module Volume K Forecast, by Application 2020 & 2033
- Table 9: Global Led Power Module Revenue million Forecast, by Type 2020 & 2033
- Table 10: Global Led Power Module Volume K Forecast, by Type 2020 & 2033
- Table 11: Global Led Power Module Revenue million Forecast, by Country 2020 & 2033
- Table 12: Global Led Power Module Volume K Forecast, by Country 2020 & 2033
- Table 13: United States Led Power Module Revenue (million) Forecast, by Application 2020 & 2033
- Table 14: United States Led Power Module Volume (K) Forecast, by Application 2020 & 2033
- Table 15: Canada Led Power Module Revenue (million) Forecast, by Application 2020 & 2033
- Table 16: Canada Led Power Module Volume (K) Forecast, by Application 2020 & 2033
- Table 17: Mexico Led Power Module Revenue (million) Forecast, by Application 2020 & 2033
- Table 18: Mexico Led Power Module Volume (K) Forecast, by Application 2020 & 2033
- Table 19: Global Led Power Module Revenue million Forecast, by Application 2020 & 2033
- Table 20: Global Led Power Module Volume K Forecast, by Application 2020 & 2033
- Table 21: Global Led Power Module Revenue million Forecast, by Type 2020 & 2033
- Table 22: Global Led Power Module Volume K Forecast, by Type 2020 & 2033
- Table 23: Global Led Power Module Revenue million Forecast, by Country 2020 & 2033
- Table 24: Global Led Power Module Volume K Forecast, by Country 2020 & 2033
- Table 25: Brazil Led Power Module Revenue (million) Forecast, by Application 2020 & 2033
- Table 26: Brazil Led Power Module Volume (K) Forecast, by Application 2020 & 2033
- Table 27: Argentina Led Power Module Revenue (million) Forecast, by Application 2020 & 2033
- Table 28: Argentina Led Power Module Volume (K) Forecast, by Application 2020 & 2033
- Table 29: Rest of South America Led Power Module Revenue (million) Forecast, by Application 2020 & 2033
- Table 30: Rest of South America Led Power Module Volume (K) Forecast, by Application 2020 & 2033
- Table 31: Global Led Power Module Revenue million Forecast, by Application 2020 & 2033
- Table 32: Global Led Power Module Volume K Forecast, by Application 2020 & 2033
- Table 33: Global Led Power Module Revenue million Forecast, by Type 2020 & 2033
- Table 34: Global Led Power Module Volume K Forecast, by Type 2020 & 2033
- Table 35: Global Led Power Module Revenue million Forecast, by Country 2020 & 2033
- Table 36: Global Led Power Module Volume K Forecast, by Country 2020 & 2033
- Table 37: United Kingdom Led Power Module Revenue (million) Forecast, by Application 2020 & 2033
- Table 38: United Kingdom Led Power Module Volume (K) Forecast, by Application 2020 & 2033
- Table 39: Germany Led Power Module Revenue (million) Forecast, by Application 2020 & 2033
- Table 40: Germany Led Power Module Volume (K) Forecast, by Application 2020 & 2033
- Table 41: France Led Power Module Revenue (million) Forecast, by Application 2020 & 2033
- Table 42: France Led Power Module Volume (K) Forecast, by Application 2020 & 2033
- Table 43: Italy Led Power Module Revenue (million) Forecast, by Application 2020 & 2033
- Table 44: Italy Led Power Module Volume (K) Forecast, by Application 2020 & 2033
- Table 45: Spain Led Power Module Revenue (million) Forecast, by Application 2020 & 2033
- Table 46: Spain Led Power Module Volume (K) Forecast, by Application 2020 & 2033
- Table 47: Russia Led Power Module Revenue (million) Forecast, by Application 2020 & 2033
- Table 48: Russia Led Power Module Volume (K) Forecast, by Application 2020 & 2033
- Table 49: Benelux Led Power Module Revenue (million) Forecast, by Application 2020 & 2033
- Table 50: Benelux Led Power Module Volume (K) Forecast, by Application 2020 & 2033
- Table 51: Nordics Led Power Module Revenue (million) Forecast, by Application 2020 & 2033
- Table 52: Nordics Led Power Module Volume (K) Forecast, by Application 2020 & 2033
- Table 53: Rest of Europe Led Power Module Revenue (million) Forecast, by Application 2020 & 2033
- Table 54: Rest of Europe Led Power Module Volume (K) Forecast, by Application 2020 & 2033
- Table 55: Global Led Power Module Revenue million Forecast, by Application 2020 & 2033
- Table 56: Global Led Power Module Volume K Forecast, by Application 2020 & 2033
- Table 57: Global Led Power Module Revenue million Forecast, by Type 2020 & 2033
- Table 58: Global Led Power Module Volume K Forecast, by Type 2020 & 2033
- Table 59: Global Led Power Module Revenue million Forecast, by Country 2020 & 2033
- Table 60: Global Led Power Module Volume K Forecast, by Country 2020 & 2033
- Table 61: Turkey Led Power Module Revenue (million) Forecast, by Application 2020 & 2033
- Table 62: Turkey Led Power Module Volume (K) Forecast, by Application 2020 & 2033
- Table 63: Israel Led Power Module Revenue (million) Forecast, by Application 2020 & 2033
- Table 64: Israel Led Power Module Volume (K) Forecast, by Application 2020 & 2033
- Table 65: GCC Led Power Module Revenue (million) Forecast, by Application 2020 & 2033
- Table 66: GCC Led Power Module Volume (K) Forecast, by Application 2020 & 2033
- Table 67: North Africa Led Power Module Revenue (million) Forecast, by Application 2020 & 2033
- Table 68: North Africa Led Power Module Volume (K) Forecast, by Application 2020 & 2033
- Table 69: South Africa Led Power Module Revenue (million) Forecast, by Application 2020 & 2033
- Table 70: South Africa Led Power Module Volume (K) Forecast, by Application 2020 & 2033
- Table 71: Rest of Middle East & Africa Led Power Module Revenue (million) Forecast, by Application 2020 & 2033
- Table 72: Rest of Middle East & Africa Led Power Module Volume (K) Forecast, by Application 2020 & 2033
- Table 73: Global Led Power Module Revenue million Forecast, by Application 2020 & 2033
- Table 74: Global Led Power Module Volume K Forecast, by Application 2020 & 2033
- Table 75: Global Led Power Module Revenue million Forecast, by Type 2020 & 2033
- Table 76: Global Led Power Module Volume K Forecast, by Type 2020 & 2033
- Table 77: Global Led Power Module Revenue million Forecast, by Country 2020 & 2033
- Table 78: Global Led Power Module Volume K Forecast, by Country 2020 & 2033
- Table 79: China Led Power Module Revenue (million) Forecast, by Application 2020 & 2033
- Table 80: China Led Power Module Volume (K) Forecast, by Application 2020 & 2033
- Table 81: India Led Power Module Revenue (million) Forecast, by Application 2020 & 2033
- Table 82: India Led Power Module Volume (K) Forecast, by Application 2020 & 2033
- Table 83: Japan Led Power Module Revenue (million) Forecast, by Application 2020 & 2033
- Table 84: Japan Led Power Module Volume (K) Forecast, by Application 2020 & 2033
- Table 85: South Korea Led Power Module Revenue (million) Forecast, by Application 2020 & 2033
- Table 86: South Korea Led Power Module Volume (K) Forecast, by Application 2020 & 2033
- Table 87: ASEAN Led Power Module Revenue (million) Forecast, by Application 2020 & 2033
- Table 88: ASEAN Led Power Module Volume (K) Forecast, by Application 2020 & 2033
- Table 89: Oceania Led Power Module Revenue (million) Forecast, by Application 2020 & 2033
- Table 90: Oceania Led Power Module Volume (K) Forecast, by Application 2020 & 2033
- Table 91: Rest of Asia Pacific Led Power Module Revenue (million) Forecast, by Application 2020 & 2033
- Table 92: Rest of Asia Pacific Led Power Module Volume (K) Forecast, by Application 2020 & 2033
Frequently Asked Questions
1. What is the projected Compound Annual Growth Rate (CAGR) of the Led Power Module?
The projected CAGR is approximately XXX%.
2. Which companies are prominent players in the Led Power Module?
Key companies in the market include MEAN WELL, Aimtec, Osram, Seoul Semiconductor, STMicroelectronics, Luminus Devices, Delta Group, Bridge Lux, Fulham, ERP Power, Adafruit Industries, XP Power, Molex, Lumex Opto, Hatch Lighting, Carlo Gavazzi.
3. What are the main segments of the Led Power Module?
The market segments include Application, Type.
4. Can you provide details about the market size?
The market size is estimated to be USD XXX million as of 2022.
5. What are some drivers contributing to market growth?
N/A
6. What are the notable trends driving market growth?
N/A
7. Are there any restraints impacting market growth?
N/A
8. Can you provide examples of recent developments in the market?
N/A
9. What pricing options are available for accessing the report?
Pricing options include single-user, multi-user, and enterprise licenses priced at USD 3950.00, USD 5925.00, and USD 7900.00 respectively.
10. Is the market size provided in terms of value or volume?
The market size is provided in terms of value, measured in million and volume, measured in K.
11. Are there any specific market keywords associated with the report?
Yes, the market keyword associated with the report is "Led Power Module," which aids in identifying and referencing the specific market segment covered.
12. How do I determine which pricing option suits my needs best?
The pricing options vary based on user requirements and access needs. Individual users may opt for single-user licenses, while businesses requiring broader access may choose multi-user or enterprise licenses for cost-effective access to the report.
13. Are there any additional resources or data provided in the Led Power Module report?
While the report offers comprehensive insights, it's advisable to review the specific contents or supplementary materials provided to ascertain if additional resources or data are available.
14. How can I stay updated on further developments or reports in the Led Power Module?
To stay informed about further developments, trends, and reports in the Led Power Module, consider subscribing to industry newsletters, following relevant companies and organizations, or regularly checking reputable industry news sources and publications.
Methodology
Step 1 - Identification of Relevant Samples Size from Population Database


Step 2 - Approaches for Defining Global Market Size (Value, Volume* & Price*)

Note*: In applicable scenarios
Step 3 - Data Sources
Primary Research
- Web Analytics
- Survey Reports
- Research Institute
- Latest Research Reports
- Opinion Leaders
Secondary Research
- Annual Reports
- White Paper
- Latest Press Release
- Industry Association
- Paid Database
- Investor Presentations

Step 4 - Data Triangulation
Involves using different sources of information in order to increase the validity of a study
These sources are likely to be stakeholders in a program - participants, other researchers, program staff, other community members, and so on.
Then we put all data in single framework & apply various statistical tools to find out the dynamic on the market.
During the analysis stage, feedback from the stakeholder groups would be compared to determine areas of agreement as well as areas of divergence