

Key Insights
The laptop graphics card market, while experiencing a period of consolidation amongst key players like Intel, Nvidia, AMD, and Samsung, is projected for robust growth. Driven by increasing demand for high-performance computing in portable devices, particularly for gaming, content creation, and professional applications, the market is expected to witness a Compound Annual Growth Rate (CAGR) of approximately 15% between 2025 and 2033. This growth is fueled by several key trends: the rising adoption of advanced display technologies like high-resolution and high-refresh-rate screens, the increasing sophistication of mobile games, and the growing need for powerful GPUs to handle demanding creative software. The market is segmented by various factors including card type (integrated vs. dedicated), performance level (entry-level, mid-range, high-end), and target consumer (gamers, professionals, general users). While factors such as component shortages and fluctuating prices pose some restraint, the overall outlook remains positive, driven by technological advancements and increased consumer spending on premium laptops.

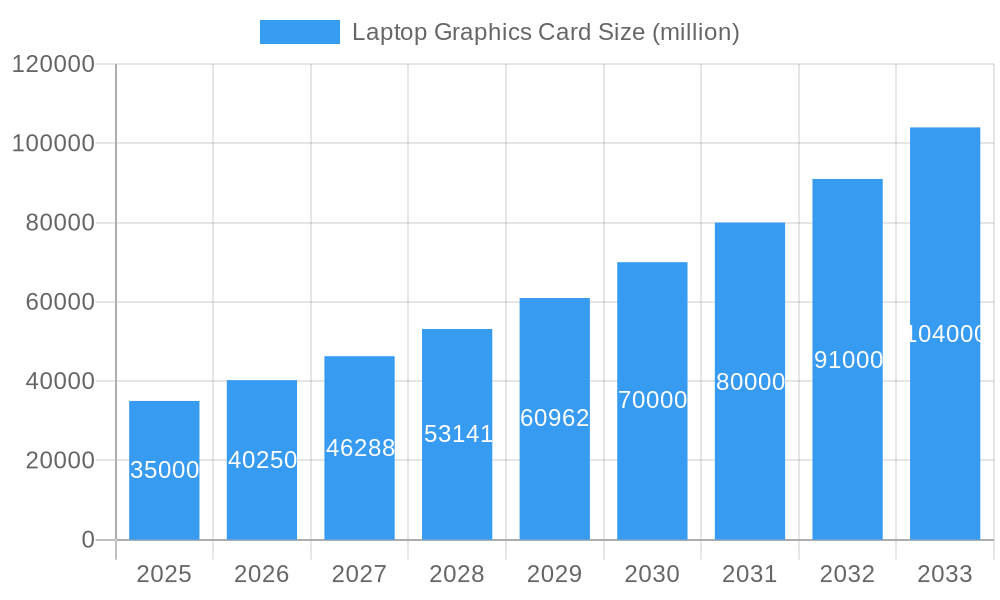
Laptop Graphics Card Market Size (In Billion)
The competitive landscape is marked by intense rivalry among established players. Nvidia and AMD are currently leading the dedicated GPU segment, leveraging their technological expertise and extensive marketing efforts. Intel, with its integrated graphics solutions, continues to hold a significant market share, particularly in the budget-friendly laptop market. Other significant players like Samsung and Toshiba focus on supplying key components within the supply chain, impacting the overall market dynamics. The forecast for 2033 anticipates a market size exceeding $50 billion USD, reflecting the projected CAGR and continued market penetration. Future growth will likely depend on the successful integration of advanced technologies such as ray tracing and AI acceleration into mobile GPUs, making laptops capable of handling ever more demanding applications.
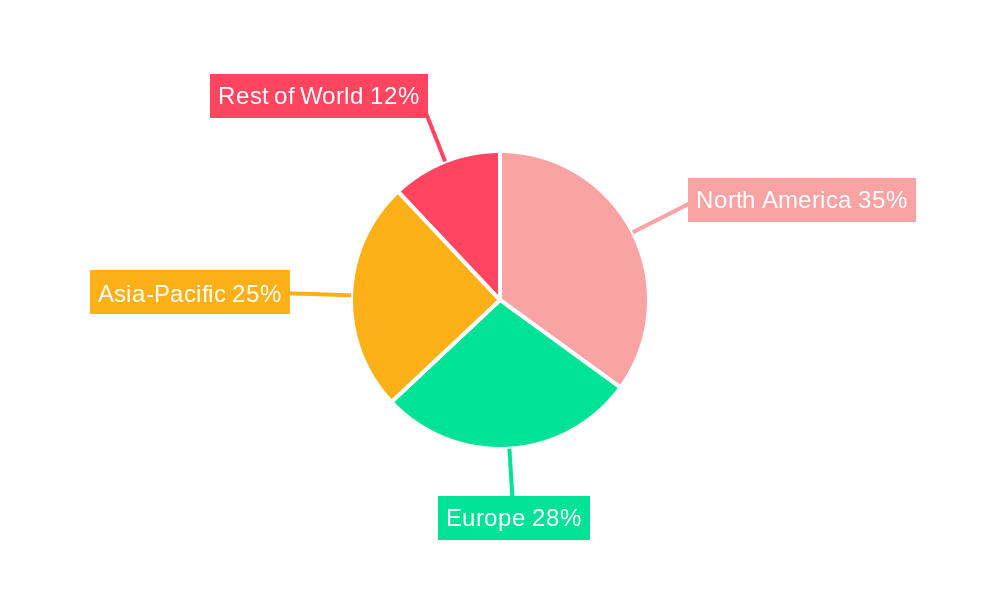
Laptop Graphics Card Company Market Share
Laptop Graphics Card Market: A Comprehensive Report (2019-2033)
This insightful report provides a detailed analysis of the global laptop graphics card market, encompassing historical performance (2019-2024), current market dynamics (Base Year: 2025), and future projections (Forecast Period: 2025-2033). The report unveils crucial market trends, competitive landscapes, and future growth opportunities, valued in millions. This comprehensive study is essential for stakeholders seeking a thorough understanding of this dynamic and rapidly evolving market.
Laptop Graphics Card Market Composition & Trends
The laptop graphics card market, valued at $XX million in 2025, exhibits a moderately concentrated structure, with key players like Nvidia, AMD, and Intel holding significant market share. Nvidia's dominance stems from its superior high-end offerings, while AMD is gaining traction in the mid-range segment. Intel's integrated graphics solutions cater to a distinct budget-conscious market segment. The market is experiencing significant innovation, driven by advancements in ray tracing, AI processing, and power efficiency. Regulatory compliance concerning energy consumption and e-waste management influences market dynamics. Substitute products, such as cloud gaming services, pose a growing challenge. The end-user profile comprises gamers, professionals (e.g., designers, engineers), and general consumers, with varying needs and purchasing power. M&A activities, with total deal values exceeding $XX million in the last five years, indicate consolidation and a drive towards vertical integration within the supply chain.
- Market Share Distribution (2025): Nvidia: XX%, AMD: XX%, Intel: XX%, Others: XX%
- M&A Deal Values (2019-2024): >$XX million
- Key Innovation Catalysts: Ray Tracing, AI acceleration, Power Efficiency improvements
- Major Regulatory Considerations: Energy Efficiency Standards, E-waste regulations
Laptop Graphics Card Industry Evolution
The laptop graphics card market has witnessed robust growth throughout the historical period (2019-2024), exhibiting a Compound Annual Growth Rate (CAGR) of XX%. This growth is largely attributed to rising demand for high-performance computing in laptops, fueled by factors such as the increasing popularity of gaming, the rise of remote work and online learning, and the growing adoption of advanced graphics-intensive applications. Technological advancements, such as the shift towards higher memory bandwidths (GDDR6X, GDDR7), improved processing power (e.g., RT Cores, Tensor Cores), and miniaturization techniques, have continuously propelled market expansion. Consumer demand for better visual fidelity, smoother frame rates, and enhanced portable gaming experiences drives the need for more powerful and efficient graphics solutions. The forecast period (2025-2033) projects a CAGR of XX%, driven by continued technological innovations and expansion into emerging markets.
Leading Regions, Countries, or Segments in Laptop Graphics Card
North America currently dominates the global laptop graphics card market, driven by high consumer spending on premium laptops, a strong gaming culture, and a robust technology ecosystem. Asia-Pacific is also experiencing rapid growth, propelled by increasing smartphone and laptop penetration, especially in developing economies.
- Key Drivers for North America's Dominance: High disposable income, strong gaming community, early adoption of new technologies, robust research and development infrastructure.
- Key Drivers for Asia-Pacific Growth: Increasing smartphone and laptop adoption, expanding middle class, government initiatives to foster technological advancement.
The high-end gaming segment represents the most lucrative market segment, followed by the professional workstation segment, due to the higher price points and greater demand for superior performance capabilities.
Laptop Graphics Card Product Innovations
Recent innovations focus on maximizing performance-per-watt, integrating AI-assisted upscaling technologies, and incorporating advanced ray tracing cores for realistic lighting effects. This translates into superior visual experiences, improved battery life for mobile devices, and enhanced capabilities for gaming and professional applications. Unique selling propositions include superior ray tracing capabilities, advanced AI features, and optimized power consumption, catering to the specific needs of different user segments.
Propelling Factors for Laptop Graphics Card Growth
Technological advancements in GPU architecture, memory, and power efficiency are primary drivers. The growing popularity of gaming, virtual reality (VR), and augmented reality (AR) applications significantly boosts market growth. Economic factors, such as rising disposable incomes and increased affordability of laptops, further contribute to expansion. Favorable government policies and incentives promoting technological development in certain regions also support market growth.
Obstacles in the Laptop Graphics Card Market
Supply chain disruptions, particularly the impact of geopolitical events and component shortages, represent a major obstacle. The high cost of advanced GPUs can limit market accessibility for budget-conscious consumers. Intense competition among manufacturers, leading to price wars and reduced profit margins, presents another significant challenge. Furthermore, regulatory restrictions and environmental concerns regarding e-waste management impose limitations on market expansion.
Future Opportunities in Laptop Graphics Card
The emergence of new markets in developing countries and the growth of cloud gaming offer significant opportunities. Advancements in miniaturization, resulting in more compact and energy-efficient GPUs, open avenues for innovation. Emerging technologies like AI-powered game enhancement features and VR/AR integration are poised to further expand the market.
Key Developments in Laptop Graphics Card Industry
- 2022 Q4: Nvidia launches the RTX 40 series mobile GPUs, setting a new benchmark for performance.
- 2023 Q1: AMD announces its Ryzen 7000 series mobile processors with integrated Radeon graphics, improving integrated graphics capabilities significantly.
- 2023 Q3: Several major manufacturers announce partnerships to improve supply chain resilience.
Strategic Laptop Graphics Card Market Forecast
The laptop graphics card market is poised for continued growth, fueled by ongoing technological innovation, expanding applications, and increasing consumer demand. The market's future potential is significant, driven by emerging markets, new technologies, and the ongoing evolution of gaming and professional computing. Continued investment in research and development, alongside strategic partnerships and acquisitions, will further shape the market's trajectory.
Laptop Graphics Card Segmentation
-
1. Application
- 1.1. Laptops under 13.3 Inches
- 1.2. Laptops 13.3 to 15.6 Inches
- 1.3. Laptops above 15.6 Inches
-
2. Type
- 2.1. Integrated
- 2.2. Dedicated (Discrete)
Laptop Graphics Card Segmentation By Geography
-
1. North America
- 1.1. United States
- 1.2. Canada
- 1.3. Mexico
-
2. South America
- 2.1. Brazil
- 2.2. Argentina
- 2.3. Rest of South America
-
3. Europe
- 3.1. United Kingdom
- 3.2. Germany
- 3.3. France
- 3.4. Italy
- 3.5. Spain
- 3.6. Russia
- 3.7. Benelux
- 3.8. Nordics
- 3.9. Rest of Europe
-
4. Middle East & Africa
- 4.1. Turkey
- 4.2. Israel
- 4.3. GCC
- 4.4. North Africa
- 4.5. South Africa
- 4.6. Rest of Middle East & Africa
-
5. Asia Pacific
- 5.1. China
- 5.2. India
- 5.3. Japan
- 5.4. South Korea
- 5.5. ASEAN
- 5.6. Oceania
- 5.7. Rest of Asia Pacific
Laptop Graphics Card Regional Market Share
Geographic Coverage of Laptop Graphics Card
Laptop Graphics Card REPORT HIGHLIGHTS
| Aspects | Details |
|---|---|
| Study Period | 2020-2034 |
| Base Year | 2025 |
| Estimated Year | 2026 |
| Forecast Period | 2026-2034 |
| Historical Period | 2020-2025 |
| Growth Rate | CAGR of 17.05% from 2020-2034 |
| Segmentation |
|
Table of Contents
- 1. Introduction
- 1.1. Research Scope
- 1.2. Market Segmentation
- 1.3. Research Objective
- 1.4. Definitions and Assumptions
- 2. Executive Summary
- 2.1. Market Snapshot
- 3. Market Dynamics
- 3.1. Market Drivers
- 3.2. Market Restrains
- 3.3. Market Trends
- 3.4. Market Opportunities
- 4. Market Factor Analysis
- 4.1. Porters Five Forces
- 4.1.1. Bargaining Power of Suppliers
- 4.1.2. Bargaining Power of Buyers
- 4.1.3. Threat of New Entrants
- 4.1.4. Threat of Substitutes
- 4.1.5. Competitive Rivalry
- 4.2. PESTEL analysis
- 4.3. BCG Analysis
- 4.3.1. Stars (High Growth, High Market Share)
- 4.3.2. Cash Cows (Low Growth, High Market Share)
- 4.3.3. Question Mark (High Growth, Low Market Share)
- 4.3.4. Dogs (Low Growth, Low Market Share)
- 4.4. Ansoff Matrix Analysis
- 4.5. Supply Chain Analysis
- 4.6. Regulatory Landscape
- 4.7. Current Market Potential and Opportunity Assessment (TAM–SAM–SOM Framework)
- 4.8. DMV Analyst Note
- 4.1. Porters Five Forces
- 5. Market Analysis, Insights and Forecast 2021-2033
- 5.1. Market Analysis, Insights and Forecast - by Application
- 5.1.1. Laptops under 13.3 Inches
- 5.1.2. Laptops 13.3 to 15.6 Inches
- 5.1.3. Laptops above 15.6 Inches
- 5.2. Market Analysis, Insights and Forecast - by Type
- 5.2.1. Integrated
- 5.2.2. Dedicated (Discrete)
- 5.3. Market Analysis, Insights and Forecast - by Region
- 5.3.1. North America
- 5.3.2. South America
- 5.3.3. Europe
- 5.3.4. Middle East & Africa
- 5.3.5. Asia Pacific
- 5.1. Market Analysis, Insights and Forecast - by Application
- 6. Global Laptop Graphics Card Analysis, Insights and Forecast, 2021-2033
- 6.1. Market Analysis, Insights and Forecast - by Application
- 6.1.1. Laptops under 13.3 Inches
- 6.1.2. Laptops 13.3 to 15.6 Inches
- 6.1.3. Laptops above 15.6 Inches
- 6.2. Market Analysis, Insights and Forecast - by Type
- 6.2.1. Integrated
- 6.2.2. Dedicated (Discrete)
- 6.1. Market Analysis, Insights and Forecast - by Application
- 7. North America Laptop Graphics Card Analysis, Insights and Forecast, 2020-2032
- 7.1. Market Analysis, Insights and Forecast - by Application
- 7.1.1. Laptops under 13.3 Inches
- 7.1.2. Laptops 13.3 to 15.6 Inches
- 7.1.3. Laptops above 15.6 Inches
- 7.2. Market Analysis, Insights and Forecast - by Type
- 7.2.1. Integrated
- 7.2.2. Dedicated (Discrete)
- 7.1. Market Analysis, Insights and Forecast - by Application
- 8. South America Laptop Graphics Card Analysis, Insights and Forecast, 2020-2032
- 8.1. Market Analysis, Insights and Forecast - by Application
- 8.1.1. Laptops under 13.3 Inches
- 8.1.2. Laptops 13.3 to 15.6 Inches
- 8.1.3. Laptops above 15.6 Inches
- 8.2. Market Analysis, Insights and Forecast - by Type
- 8.2.1. Integrated
- 8.2.2. Dedicated (Discrete)
- 8.1. Market Analysis, Insights and Forecast - by Application
- 9. Europe Laptop Graphics Card Analysis, Insights and Forecast, 2020-2032
- 9.1. Market Analysis, Insights and Forecast - by Application
- 9.1.1. Laptops under 13.3 Inches
- 9.1.2. Laptops 13.3 to 15.6 Inches
- 9.1.3. Laptops above 15.6 Inches
- 9.2. Market Analysis, Insights and Forecast - by Type
- 9.2.1. Integrated
- 9.2.2. Dedicated (Discrete)
- 9.1. Market Analysis, Insights and Forecast - by Application
- 10. Middle East & Africa Laptop Graphics Card Analysis, Insights and Forecast, 2020-2032
- 10.1. Market Analysis, Insights and Forecast - by Application
- 10.1.1. Laptops under 13.3 Inches
- 10.1.2. Laptops 13.3 to 15.6 Inches
- 10.1.3. Laptops above 15.6 Inches
- 10.2. Market Analysis, Insights and Forecast - by Type
- 10.2.1. Integrated
- 10.2.2. Dedicated (Discrete)
- 10.1. Market Analysis, Insights and Forecast - by Application
- 11. Asia Pacific Laptop Graphics Card Analysis, Insights and Forecast, 2020-2032
- 11.1. Market Analysis, Insights and Forecast - by Application
- 11.1.1. Laptops under 13.3 Inches
- 11.1.2. Laptops 13.3 to 15.6 Inches
- 11.1.3. Laptops above 15.6 Inches
- 11.2. Market Analysis, Insights and Forecast - by Type
- 11.2.1. Integrated
- 11.2.2. Dedicated (Discrete)
- 11.1. Market Analysis, Insights and Forecast - by Application
- 12. Competitive Analysis
- 12.1. Company Profiles
- 12.1.1 Intel
- 12.1.1.1. Company Overview
- 12.1.1.2. Products
- 12.1.1.3. Company Financials
- 12.1.1.4. SWOT Analysis
- 12.1.2 Nvidia
- 12.1.2.1. Company Overview
- 12.1.2.2. Products
- 12.1.2.3. Company Financials
- 12.1.2.4. SWOT Analysis
- 12.1.3 AMD
- 12.1.3.1. Company Overview
- 12.1.3.2. Products
- 12.1.3.3. Company Financials
- 12.1.3.4. SWOT Analysis
- 12.1.4 Samsung
- 12.1.4.1. Company Overview
- 12.1.4.2. Products
- 12.1.4.3. Company Financials
- 12.1.4.4. SWOT Analysis
- 12.1.5 Toshiba
- 12.1.5.1. Company Overview
- 12.1.5.2. Products
- 12.1.5.3. Company Financials
- 12.1.5.4. SWOT Analysis
- 12.1.6 Matrox
- 12.1.6.1. Company Overview
- 12.1.6.2. Products
- 12.1.6.3. Company Financials
- 12.1.6.4. SWOT Analysis
- 12.1.7 VIA
- 12.1.7.1. Company Overview
- 12.1.7.2. Products
- 12.1.7.3. Company Financials
- 12.1.7.4. SWOT Analysis
- 12.1.8 EVGA
- 12.1.8.1. Company Overview
- 12.1.8.2. Products
- 12.1.8.3. Company Financials
- 12.1.8.4. SWOT Analysis
- 12.1.9 SIS
- 12.1.9.1. Company Overview
- 12.1.9.2. Products
- 12.1.9.3. Company Financials
- 12.1.9.4. SWOT Analysis
- 12.1.10 MSI
- 12.1.10.1. Company Overview
- 12.1.10.2. Products
- 12.1.10.3. Company Financials
- 12.1.10.4. SWOT Analysis
- 12.1.11 ASUS
- 12.1.11.1. Company Overview
- 12.1.11.2. Products
- 12.1.11.3. Company Financials
- 12.1.11.4. SWOT Analysis
- 12.1.12 Leadtek
- 12.1.12.1. Company Overview
- 12.1.12.2. Products
- 12.1.12.3. Company Financials
- 12.1.12.4. SWOT Analysis
- 12.1.13 GALAXY Microsystems Ltd
- 12.1.13.1. Company Overview
- 12.1.13.2. Products
- 12.1.13.3. Company Financials
- 12.1.13.4. SWOT Analysis
- 12.1.14 ZOTAC
- 12.1.14.1. Company Overview
- 12.1.14.2. Products
- 12.1.14.3. Company Financials
- 12.1.14.4. SWOT Analysis
- 12.1.15 Ming xuan
- 12.1.15.1. Company Overview
- 12.1.15.2. Products
- 12.1.15.3. Company Financials
- 12.1.15.4. SWOT Analysis
- 12.1.16 Sapphire
- 12.1.16.1. Company Overview
- 12.1.16.2. Products
- 12.1.16.3. Company Financials
- 12.1.16.4. SWOT Analysis
- 12.1.17 CFG
- 12.1.17.1. Company Overview
- 12.1.17.2. Products
- 12.1.17.3. Company Financials
- 12.1.17.4. SWOT Analysis
- 12.1.1 Intel
- 12.2. Market Entropy
- 12.2.1 Company's Key Areas Served
- 12.2.2 Recent Developments
- 12.3. Company Market Share Analysis 2025
- 12.3.1 Top 5 Companies Market Share Analysis
- 12.3.2 Top 3 Companies Market Share Analysis
- 12.4. List of Potential Customers
- 13. Research Methodology
List of Figures
- Figure 1: Global Laptop Graphics Card Revenue Breakdown (undefined, %) by Region 2025 & 2033
- Figure 2: Global Laptop Graphics Card Volume Breakdown (K, %) by Region 2025 & 2033
- Figure 3: North America Laptop Graphics Card Revenue (undefined), by Application 2025 & 2033
- Figure 4: North America Laptop Graphics Card Volume (K), by Application 2025 & 2033
- Figure 5: North America Laptop Graphics Card Revenue Share (%), by Application 2025 & 2033
- Figure 6: North America Laptop Graphics Card Volume Share (%), by Application 2025 & 2033
- Figure 7: North America Laptop Graphics Card Revenue (undefined), by Type 2025 & 2033
- Figure 8: North America Laptop Graphics Card Volume (K), by Type 2025 & 2033
- Figure 9: North America Laptop Graphics Card Revenue Share (%), by Type 2025 & 2033
- Figure 10: North America Laptop Graphics Card Volume Share (%), by Type 2025 & 2033
- Figure 11: North America Laptop Graphics Card Revenue (undefined), by Country 2025 & 2033
- Figure 12: North America Laptop Graphics Card Volume (K), by Country 2025 & 2033
- Figure 13: North America Laptop Graphics Card Revenue Share (%), by Country 2025 & 2033
- Figure 14: North America Laptop Graphics Card Volume Share (%), by Country 2025 & 2033
- Figure 15: South America Laptop Graphics Card Revenue (undefined), by Application 2025 & 2033
- Figure 16: South America Laptop Graphics Card Volume (K), by Application 2025 & 2033
- Figure 17: South America Laptop Graphics Card Revenue Share (%), by Application 2025 & 2033
- Figure 18: South America Laptop Graphics Card Volume Share (%), by Application 2025 & 2033
- Figure 19: South America Laptop Graphics Card Revenue (undefined), by Type 2025 & 2033
- Figure 20: South America Laptop Graphics Card Volume (K), by Type 2025 & 2033
- Figure 21: South America Laptop Graphics Card Revenue Share (%), by Type 2025 & 2033
- Figure 22: South America Laptop Graphics Card Volume Share (%), by Type 2025 & 2033
- Figure 23: South America Laptop Graphics Card Revenue (undefined), by Country 2025 & 2033
- Figure 24: South America Laptop Graphics Card Volume (K), by Country 2025 & 2033
- Figure 25: South America Laptop Graphics Card Revenue Share (%), by Country 2025 & 2033
- Figure 26: South America Laptop Graphics Card Volume Share (%), by Country 2025 & 2033
- Figure 27: Europe Laptop Graphics Card Revenue (undefined), by Application 2025 & 2033
- Figure 28: Europe Laptop Graphics Card Volume (K), by Application 2025 & 2033
- Figure 29: Europe Laptop Graphics Card Revenue Share (%), by Application 2025 & 2033
- Figure 30: Europe Laptop Graphics Card Volume Share (%), by Application 2025 & 2033
- Figure 31: Europe Laptop Graphics Card Revenue (undefined), by Type 2025 & 2033
- Figure 32: Europe Laptop Graphics Card Volume (K), by Type 2025 & 2033
- Figure 33: Europe Laptop Graphics Card Revenue Share (%), by Type 2025 & 2033
- Figure 34: Europe Laptop Graphics Card Volume Share (%), by Type 2025 & 2033
- Figure 35: Europe Laptop Graphics Card Revenue (undefined), by Country 2025 & 2033
- Figure 36: Europe Laptop Graphics Card Volume (K), by Country 2025 & 2033
- Figure 37: Europe Laptop Graphics Card Revenue Share (%), by Country 2025 & 2033
- Figure 38: Europe Laptop Graphics Card Volume Share (%), by Country 2025 & 2033
- Figure 39: Middle East & Africa Laptop Graphics Card Revenue (undefined), by Application 2025 & 2033
- Figure 40: Middle East & Africa Laptop Graphics Card Volume (K), by Application 2025 & 2033
- Figure 41: Middle East & Africa Laptop Graphics Card Revenue Share (%), by Application 2025 & 2033
- Figure 42: Middle East & Africa Laptop Graphics Card Volume Share (%), by Application 2025 & 2033
- Figure 43: Middle East & Africa Laptop Graphics Card Revenue (undefined), by Type 2025 & 2033
- Figure 44: Middle East & Africa Laptop Graphics Card Volume (K), by Type 2025 & 2033
- Figure 45: Middle East & Africa Laptop Graphics Card Revenue Share (%), by Type 2025 & 2033
- Figure 46: Middle East & Africa Laptop Graphics Card Volume Share (%), by Type 2025 & 2033
- Figure 47: Middle East & Africa Laptop Graphics Card Revenue (undefined), by Country 2025 & 2033
- Figure 48: Middle East & Africa Laptop Graphics Card Volume (K), by Country 2025 & 2033
- Figure 49: Middle East & Africa Laptop Graphics Card Revenue Share (%), by Country 2025 & 2033
- Figure 50: Middle East & Africa Laptop Graphics Card Volume Share (%), by Country 2025 & 2033
- Figure 51: Asia Pacific Laptop Graphics Card Revenue (undefined), by Application 2025 & 2033
- Figure 52: Asia Pacific Laptop Graphics Card Volume (K), by Application 2025 & 2033
- Figure 53: Asia Pacific Laptop Graphics Card Revenue Share (%), by Application 2025 & 2033
- Figure 54: Asia Pacific Laptop Graphics Card Volume Share (%), by Application 2025 & 2033
- Figure 55: Asia Pacific Laptop Graphics Card Revenue (undefined), by Type 2025 & 2033
- Figure 56: Asia Pacific Laptop Graphics Card Volume (K), by Type 2025 & 2033
- Figure 57: Asia Pacific Laptop Graphics Card Revenue Share (%), by Type 2025 & 2033
- Figure 58: Asia Pacific Laptop Graphics Card Volume Share (%), by Type 2025 & 2033
- Figure 59: Asia Pacific Laptop Graphics Card Revenue (undefined), by Country 2025 & 2033
- Figure 60: Asia Pacific Laptop Graphics Card Volume (K), by Country 2025 & 2033
- Figure 61: Asia Pacific Laptop Graphics Card Revenue Share (%), by Country 2025 & 2033
- Figure 62: Asia Pacific Laptop Graphics Card Volume Share (%), by Country 2025 & 2033
List of Tables
- Table 1: Global Laptop Graphics Card Revenue undefined Forecast, by Application 2020 & 2033
- Table 2: Global Laptop Graphics Card Volume K Forecast, by Application 2020 & 2033
- Table 3: Global Laptop Graphics Card Revenue undefined Forecast, by Type 2020 & 2033
- Table 4: Global Laptop Graphics Card Volume K Forecast, by Type 2020 & 2033
- Table 5: Global Laptop Graphics Card Revenue undefined Forecast, by Region 2020 & 2033
- Table 6: Global Laptop Graphics Card Volume K Forecast, by Region 2020 & 2033
- Table 7: Global Laptop Graphics Card Revenue undefined Forecast, by Application 2020 & 2033
- Table 8: Global Laptop Graphics Card Volume K Forecast, by Application 2020 & 2033
- Table 9: Global Laptop Graphics Card Revenue undefined Forecast, by Type 2020 & 2033
- Table 10: Global Laptop Graphics Card Volume K Forecast, by Type 2020 & 2033
- Table 11: Global Laptop Graphics Card Revenue undefined Forecast, by Country 2020 & 2033
- Table 12: Global Laptop Graphics Card Volume K Forecast, by Country 2020 & 2033
- Table 13: United States Laptop Graphics Card Revenue (undefined) Forecast, by Application 2020 & 2033
- Table 14: United States Laptop Graphics Card Volume (K) Forecast, by Application 2020 & 2033
- Table 15: Canada Laptop Graphics Card Revenue (undefined) Forecast, by Application 2020 & 2033
- Table 16: Canada Laptop Graphics Card Volume (K) Forecast, by Application 2020 & 2033
- Table 17: Mexico Laptop Graphics Card Revenue (undefined) Forecast, by Application 2020 & 2033
- Table 18: Mexico Laptop Graphics Card Volume (K) Forecast, by Application 2020 & 2033
- Table 19: Global Laptop Graphics Card Revenue undefined Forecast, by Application 2020 & 2033
- Table 20: Global Laptop Graphics Card Volume K Forecast, by Application 2020 & 2033
- Table 21: Global Laptop Graphics Card Revenue undefined Forecast, by Type 2020 & 2033
- Table 22: Global Laptop Graphics Card Volume K Forecast, by Type 2020 & 2033
- Table 23: Global Laptop Graphics Card Revenue undefined Forecast, by Country 2020 & 2033
- Table 24: Global Laptop Graphics Card Volume K Forecast, by Country 2020 & 2033
- Table 25: Brazil Laptop Graphics Card Revenue (undefined) Forecast, by Application 2020 & 2033
- Table 26: Brazil Laptop Graphics Card Volume (K) Forecast, by Application 2020 & 2033
- Table 27: Argentina Laptop Graphics Card Revenue (undefined) Forecast, by Application 2020 & 2033
- Table 28: Argentina Laptop Graphics Card Volume (K) Forecast, by Application 2020 & 2033
- Table 29: Rest of South America Laptop Graphics Card Revenue (undefined) Forecast, by Application 2020 & 2033
- Table 30: Rest of South America Laptop Graphics Card Volume (K) Forecast, by Application 2020 & 2033
- Table 31: Global Laptop Graphics Card Revenue undefined Forecast, by Application 2020 & 2033
- Table 32: Global Laptop Graphics Card Volume K Forecast, by Application 2020 & 2033
- Table 33: Global Laptop Graphics Card Revenue undefined Forecast, by Type 2020 & 2033
- Table 34: Global Laptop Graphics Card Volume K Forecast, by Type 2020 & 2033
- Table 35: Global Laptop Graphics Card Revenue undefined Forecast, by Country 2020 & 2033
- Table 36: Global Laptop Graphics Card Volume K Forecast, by Country 2020 & 2033
- Table 37: United Kingdom Laptop Graphics Card Revenue (undefined) Forecast, by Application 2020 & 2033
- Table 38: United Kingdom Laptop Graphics Card Volume (K) Forecast, by Application 2020 & 2033
- Table 39: Germany Laptop Graphics Card Revenue (undefined) Forecast, by Application 2020 & 2033
- Table 40: Germany Laptop Graphics Card Volume (K) Forecast, by Application 2020 & 2033
- Table 41: France Laptop Graphics Card Revenue (undefined) Forecast, by Application 2020 & 2033
- Table 42: France Laptop Graphics Card Volume (K) Forecast, by Application 2020 & 2033
- Table 43: Italy Laptop Graphics Card Revenue (undefined) Forecast, by Application 2020 & 2033
- Table 44: Italy Laptop Graphics Card Volume (K) Forecast, by Application 2020 & 2033
- Table 45: Spain Laptop Graphics Card Revenue (undefined) Forecast, by Application 2020 & 2033
- Table 46: Spain Laptop Graphics Card Volume (K) Forecast, by Application 2020 & 2033
- Table 47: Russia Laptop Graphics Card Revenue (undefined) Forecast, by Application 2020 & 2033
- Table 48: Russia Laptop Graphics Card Volume (K) Forecast, by Application 2020 & 2033
- Table 49: Benelux Laptop Graphics Card Revenue (undefined) Forecast, by Application 2020 & 2033
- Table 50: Benelux Laptop Graphics Card Volume (K) Forecast, by Application 2020 & 2033
- Table 51: Nordics Laptop Graphics Card Revenue (undefined) Forecast, by Application 2020 & 2033
- Table 52: Nordics Laptop Graphics Card Volume (K) Forecast, by Application 2020 & 2033
- Table 53: Rest of Europe Laptop Graphics Card Revenue (undefined) Forecast, by Application 2020 & 2033
- Table 54: Rest of Europe Laptop Graphics Card Volume (K) Forecast, by Application 2020 & 2033
- Table 55: Global Laptop Graphics Card Revenue undefined Forecast, by Application 2020 & 2033
- Table 56: Global Laptop Graphics Card Volume K Forecast, by Application 2020 & 2033
- Table 57: Global Laptop Graphics Card Revenue undefined Forecast, by Type 2020 & 2033
- Table 58: Global Laptop Graphics Card Volume K Forecast, by Type 2020 & 2033
- Table 59: Global Laptop Graphics Card Revenue undefined Forecast, by Country 2020 & 2033
- Table 60: Global Laptop Graphics Card Volume K Forecast, by Country 2020 & 2033
- Table 61: Turkey Laptop Graphics Card Revenue (undefined) Forecast, by Application 2020 & 2033
- Table 62: Turkey Laptop Graphics Card Volume (K) Forecast, by Application 2020 & 2033
- Table 63: Israel Laptop Graphics Card Revenue (undefined) Forecast, by Application 2020 & 2033
- Table 64: Israel Laptop Graphics Card Volume (K) Forecast, by Application 2020 & 2033
- Table 65: GCC Laptop Graphics Card Revenue (undefined) Forecast, by Application 2020 & 2033
- Table 66: GCC Laptop Graphics Card Volume (K) Forecast, by Application 2020 & 2033
- Table 67: North Africa Laptop Graphics Card Revenue (undefined) Forecast, by Application 2020 & 2033
- Table 68: North Africa Laptop Graphics Card Volume (K) Forecast, by Application 2020 & 2033
- Table 69: South Africa Laptop Graphics Card Revenue (undefined) Forecast, by Application 2020 & 2033
- Table 70: South Africa Laptop Graphics Card Volume (K) Forecast, by Application 2020 & 2033
- Table 71: Rest of Middle East & Africa Laptop Graphics Card Revenue (undefined) Forecast, by Application 2020 & 2033
- Table 72: Rest of Middle East & Africa Laptop Graphics Card Volume (K) Forecast, by Application 2020 & 2033
- Table 73: Global Laptop Graphics Card Revenue undefined Forecast, by Application 2020 & 2033
- Table 74: Global Laptop Graphics Card Volume K Forecast, by Application 2020 & 2033
- Table 75: Global Laptop Graphics Card Revenue undefined Forecast, by Type 2020 & 2033
- Table 76: Global Laptop Graphics Card Volume K Forecast, by Type 2020 & 2033
- Table 77: Global Laptop Graphics Card Revenue undefined Forecast, by Country 2020 & 2033
- Table 78: Global Laptop Graphics Card Volume K Forecast, by Country 2020 & 2033
- Table 79: China Laptop Graphics Card Revenue (undefined) Forecast, by Application 2020 & 2033
- Table 80: China Laptop Graphics Card Volume (K) Forecast, by Application 2020 & 2033
- Table 81: India Laptop Graphics Card Revenue (undefined) Forecast, by Application 2020 & 2033
- Table 82: India Laptop Graphics Card Volume (K) Forecast, by Application 2020 & 2033
- Table 83: Japan Laptop Graphics Card Revenue (undefined) Forecast, by Application 2020 & 2033
- Table 84: Japan Laptop Graphics Card Volume (K) Forecast, by Application 2020 & 2033
- Table 85: South Korea Laptop Graphics Card Revenue (undefined) Forecast, by Application 2020 & 2033
- Table 86: South Korea Laptop Graphics Card Volume (K) Forecast, by Application 2020 & 2033
- Table 87: ASEAN Laptop Graphics Card Revenue (undefined) Forecast, by Application 2020 & 2033
- Table 88: ASEAN Laptop Graphics Card Volume (K) Forecast, by Application 2020 & 2033
- Table 89: Oceania Laptop Graphics Card Revenue (undefined) Forecast, by Application 2020 & 2033
- Table 90: Oceania Laptop Graphics Card Volume (K) Forecast, by Application 2020 & 2033
- Table 91: Rest of Asia Pacific Laptop Graphics Card Revenue (undefined) Forecast, by Application 2020 & 2033
- Table 92: Rest of Asia Pacific Laptop Graphics Card Volume (K) Forecast, by Application 2020 & 2033
Frequently Asked Questions
1. What is the projected Compound Annual Growth Rate (CAGR) of the Laptop Graphics Card?
The projected CAGR is approximately 17.05%.
2. Which companies are prominent players in the Laptop Graphics Card?
Key companies in the market include Intel, Nvidia, AMD, Samsung, Toshiba, Matrox, VIA, EVGA, SIS, MSI, ASUS, Leadtek, GALAXY Microsystems Ltd, ZOTAC, Ming xuan, Sapphire, CFG.
3. What are the main segments of the Laptop Graphics Card?
The market segments include Application, Type.
4. Can you provide details about the market size?
The market size is estimated to be USD XXX N/A as of 2022.
5. What are some drivers contributing to market growth?
N/A
6. What are the notable trends driving market growth?
N/A
7. Are there any restraints impacting market growth?
N/A
8. Can you provide examples of recent developments in the market?
N/A
9. What pricing options are available for accessing the report?
Pricing options include single-user, multi-user, and enterprise licenses priced at USD 3950.00, USD 5925.00, and USD 7900.00 respectively.
10. Is the market size provided in terms of value or volume?
The market size is provided in terms of value, measured in N/A and volume, measured in K.
11. Are there any specific market keywords associated with the report?
Yes, the market keyword associated with the report is "Laptop Graphics Card," which aids in identifying and referencing the specific market segment covered.
12. How do I determine which pricing option suits my needs best?
The pricing options vary based on user requirements and access needs. Individual users may opt for single-user licenses, while businesses requiring broader access may choose multi-user or enterprise licenses for cost-effective access to the report.
13. Are there any additional resources or data provided in the Laptop Graphics Card report?
While the report offers comprehensive insights, it's advisable to review the specific contents or supplementary materials provided to ascertain if additional resources or data are available.
14. How can I stay updated on further developments or reports in the Laptop Graphics Card?
To stay informed about further developments, trends, and reports in the Laptop Graphics Card, consider subscribing to industry newsletters, following relevant companies and organizations, or regularly checking reputable industry news sources and publications.
Methodology
Step 1 - Identification of Relevant Samples Size from Population Database


Step 2 - Approaches for Defining Global Market Size (Value, Volume* & Price*)

Note*: In applicable scenarios
Step 3 - Data Sources
Primary Research
- Web Analytics
- Survey Reports
- Research Institute
- Latest Research Reports
- Opinion Leaders
Secondary Research
- Annual Reports
- White Paper
- Latest Press Release
- Industry Association
- Paid Database
- Investor Presentations

Step 4 - Data Triangulation
Involves using different sources of information in order to increase the validity of a study
These sources are likely to be stakeholders in a program - participants, other researchers, program staff, other community members, and so on.
Then we put all data in single framework & apply various statistical tools to find out the dynamic on the market.
During the analysis stage, feedback from the stakeholder groups would be compared to determine areas of agreement as well as areas of divergence