

Key Insights
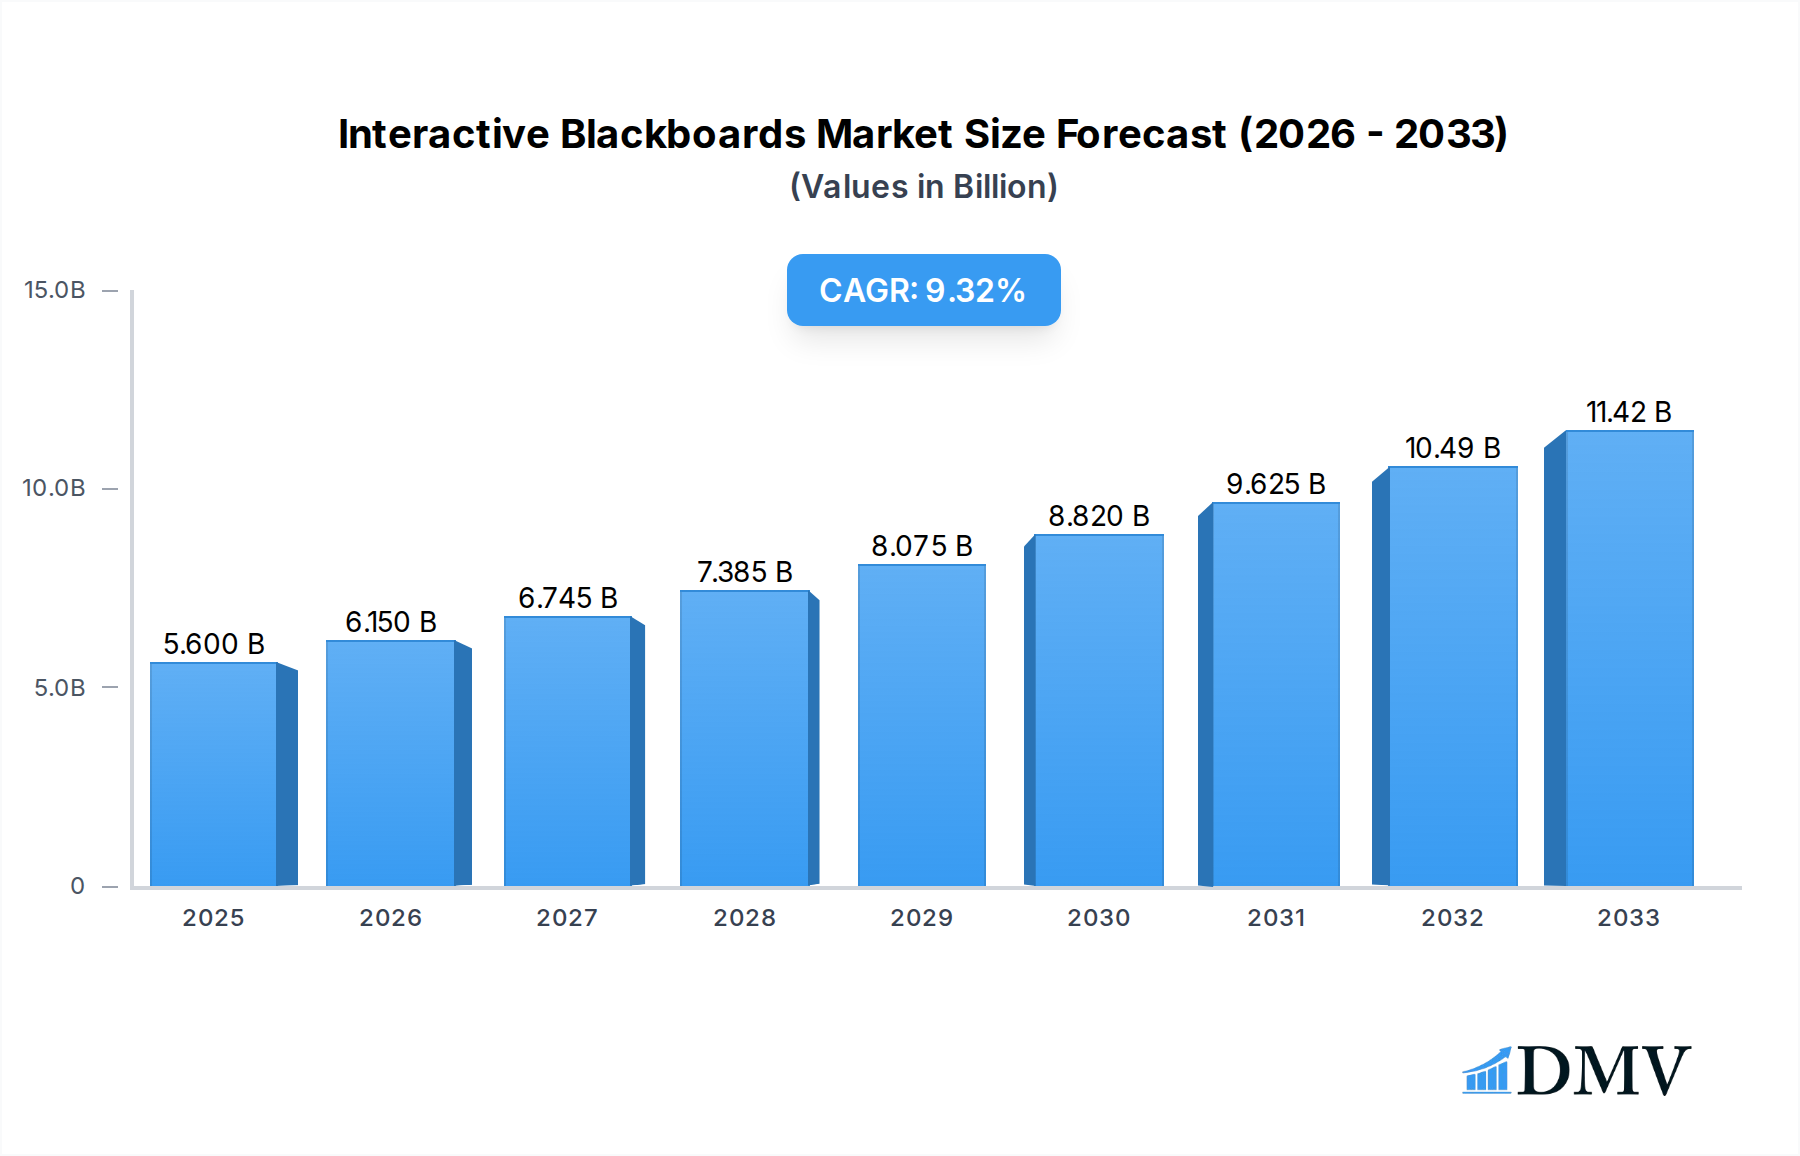
The global Interactive Blackboards market is poised for significant expansion, projected to reach a substantial $5.6 billion in 2025, demonstrating robust growth momentum. This upward trajectory is fueled by an impressive compound annual growth rate (CAGR) of 9.7% over the forecast period. A primary driver behind this surge is the escalating adoption of advanced educational technologies in K-12 and higher education institutions worldwide. The demand for interactive learning tools that enhance student engagement and facilitate collaborative learning environments is paramount. The increasing integration of digital content, multimedia resources, and smart functionalities within classrooms is transforming traditional teaching methods, making interactive blackboards an indispensable asset for modern educational settings. Furthermore, the growing emphasis on blended learning models and the continuous innovation in display technologies, including larger screen sizes like 85-inch variants, are further propelling market penetration.

Interactive Blackboards Market Size (In Billion)
The market dynamics are characterized by a competitive landscape featuring key players such as Hitevision, Seewo (CVTE), and Hikvision, who are actively innovating and expanding their product portfolios to cater to evolving educational needs. While the market is experiencing strong tailwinds from technological advancements and increasing educational investments, it also faces certain restraints. These may include the initial high cost of deployment for some institutions and the need for adequate teacher training to effectively leverage the capabilities of these advanced tools. However, the overwhelming benefits in terms of improved learning outcomes and operational efficiencies are expected to outweigh these challenges, ensuring sustained market growth. The Asia Pacific region, particularly China, is anticipated to be a dominant force in this market, owing to its substantial investment in educational infrastructure and rapid digital transformation.
Interactive Blackboards Company Market Share
Interactive Blackboards Market Composition & Trends
The interactive blackboards market is characterized by a dynamic competitive landscape with a moderate concentration of key players, including Hitevision, Seewo (CVTE), Jiangsu Daguan, Jiangsu Oudi, Createview, Lighton, Horion, Hikvision, Hanvon, Odin Technology, Thinkpanel, STboard, Guangzhou Yichuang Electronic Technology Co, and Guangdong Asano Technology Co. Innovation acts as a primary catalyst, with companies heavily investing in R&D to enhance features such as AI integration, touch responsiveness, and collaborative software. The regulatory landscape is largely supportive, especially in education sectors, promoting digital transformation initiatives. Substitute products, while present in the form of traditional whiteboards and projectors, are increasingly losing ground due to the superior engagement and interactivity offered by modern solutions. End-user profiles are predominantly within the K-12 Education and Higher Education segments, where interactive blackboards are becoming indispensable tools for dynamic teaching and learning. Merger and acquisition (M&A) activities are expected to remain a significant trend, with an estimated deal value of over one billion dollars annually, as larger players seek to consolidate market share and acquire innovative technologies.
- Market Share Distribution: While specific figures are proprietary, leading players like Seewo (CVTE) and Hitevision are estimated to hold substantial market shares, exceeding 15% each, driven by extensive product portfolios and strong distribution networks.
- M&A Deal Values: Anticipated annual M&A deal values are projected to reach approximately 1.5 billion dollars, fueled by strategic consolidations and technology acquisitions.
- Innovation Catalysts: AI-powered features, enhanced connectivity (Wi-Fi 6, 5G), and advanced display technologies are key drivers of innovation.
- End-User Segments: K-12 Education accounts for over 60% of the market, followed by Higher Education at approximately 30%.
- Regulatory Landscape: Government initiatives for digital education and classroom modernization are creating a favorable environment.
Interactive Blackboards Industry Evolution
The interactive blackboards industry has undergone a significant transformation over the study period of 2019–2033, marked by rapid technological advancements and a substantial shift in consumer demand, particularly within the education sector. From 2019 to 2024, the historical period witnessed steady growth, fueled by increasing awareness of the benefits of interactive learning tools. The base year of 2025 marks a pivotal point, with the market poised for accelerated expansion during the forecast period of 2025–2033. This evolution has been driven by a confluence of factors including the growing integration of digital technologies in educational institutions worldwide, a heightened emphasis on student engagement, and the need for more dynamic and personalized learning experiences. The development of advanced display technologies, such as high-resolution 4K and 8K screens, coupled with enhanced touch sensitivity and multi-user collaboration capabilities, has made interactive blackboards far more effective than their predecessors.
Technological advancements have not only improved the functionality of interactive blackboards but also their affordability and accessibility. The integration of Artificial Intelligence (AI) is a key trend, enabling features like intelligent content recognition, personalized learning pathways, and automated feedback mechanisms. Furthermore, the proliferation of cloud-based platforms and content management systems has allowed for seamless content sharing and collaboration between students and educators, regardless of their physical location. This has been particularly critical in supporting remote and hybrid learning models, a demand that surged significantly in recent years and is expected to remain a crucial consideration. The market has also seen a diversification in product offerings, with manufacturers now providing a wider range of sizes, features, and price points to cater to the diverse needs of different educational institutions, from small classrooms to large lecture halls.
The shift in consumer demand is evident in the increasing preference for all-in-one interactive solutions that combine display, computing, and interactive functionalities, eliminating the need for separate projectors and computers. Educators are actively seeking tools that can enhance classroom participation, facilitate differentiated instruction, and provide real-time assessment capabilities. This demand has spurred continuous innovation in software development, with a focus on creating intuitive user interfaces, robust educational applications, and seamless integration with existing learning management systems (LMS). The adoption metrics show a strong upward trend, with an estimated global adoption rate of interactive blackboards in educational institutions rising from approximately 40% in 2019 to an estimated 75% by 2025, and projected to exceed 90% by 2033. The market growth trajectory is robust, with a compound annual growth rate (CAGR) of over 15% projected for the forecast period, translating into market revenues expected to surpass 20 billion dollars by 2033.
Leading Regions, Countries, or Segments in Interactive Blackboards
The K-12 Education segment stands as the dominant force within the interactive blackboards market, showcasing unparalleled growth and adoption rates. This dominance is fueled by a confluence of factors, including substantial government investment in educational infrastructure, a growing global recognition of the importance of early digital literacy, and the intrinsic benefits interactive blackboards offer in enhancing young learners' engagement and comprehension. Within this segment, specific regions and countries are leading the charge, driven by forward-thinking educational policies and robust economic capacity. North America and Europe have consistently been major markets, with countries like the United States, Canada, Germany, and the United Kingdom investing heavily in classroom modernization. However, the Asia-Pacific region, particularly China, is rapidly emerging as a powerhouse, propelled by massive government initiatives aimed at digitizing education and a burgeoning student population. The 85-inch interactive blackboard size has emerged as a popular choice, striking a balance between immersive display and practical classroom integration, making it a preferred option for a wide range of educational settings.
The prevalence of interactive blackboards in K-12 settings is directly linked to their ability to transform traditional passive learning into an active, collaborative experience. Educators can utilize these devices for dynamic lesson delivery, incorporating multimedia content, interactive quizzes, and real-time feedback. This pedagogical shift is crucial for catering to diverse learning styles and fostering critical thinking skills, which are paramount in today's educational landscape. The Type: 85 Inch interactive whiteboard has become particularly instrumental in this regard. Its substantial screen real estate allows for clear visibility across larger classrooms, while also providing ample space for multiple students to interact simultaneously, promoting group work and peer learning. The intuitive touch interfaces, often supporting multiple touch points, enable seamless annotation, drawing, and manipulation of digital content, mimicking real-world interactions in a digital format. The integration of connectivity features, such as Wi-Fi and Bluetooth, further enhances their utility, allowing for easy access to online resources and integration with other smart classroom devices.
Investment trends in the K-12 education sector are a significant driver of this dominance. Many governments worldwide have allocated substantial budgets towards upgrading educational facilities with modern technological tools. For instance, the US Department of Education's initiatives to enhance educational technology, coupled with private sector investment in ed-tech solutions, create a fertile ground for interactive blackboard adoption. Similarly, China's "Internet+Education" initiative has catalyzed the widespread deployment of interactive whiteboards across its vast school system. Regulatory support plays a crucial role, with policies often mandating or incentivizing the use of digital learning tools. These regulations not only push for the adoption of interactive blackboards but also standardize their integration, ensuring interoperability and maximizing their educational impact. The continuous drive for pedagogical innovation and the proven efficacy of interactive blackboards in improving learning outcomes solidify the K-12 education segment, and specifically the 85-inch form factor, as the leading domain within the interactive blackboards market, with projected market share exceeding 65% of the total market value in the coming years.
Interactive Blackboards Product Innovations
Interactive blackboards are experiencing a wave of innovation focused on enhancing user experience and pedagogical effectiveness. Advancements include the integration of Artificial Intelligence (AI) for features like intelligent annotation, personalized learning path recommendations, and voice command control, significantly streamlining classroom management. High-resolution displays, such as 4K and 8K, are becoming standard, offering crisp visuals and immersive learning environments. Furthermore, enhanced touch technology with ultra-low latency and multi-touch capabilities allows for seamless collaboration and natural interaction. Many new models incorporate built-in operating systems and a vast ecosystem of educational apps, transforming the blackboard into a comprehensive learning hub. Unique selling propositions include the seamless integration of hardware and software, robust security features for educational data, and energy-efficient designs. These innovations are directly impacting the performance metrics, with faster response times, improved clarity, and greater versatility in diverse educational applications.
Propelling Factors for Interactive Blackboards Growth
The interactive blackboards market is experiencing robust growth driven by several key factors. Technological Advancements are paramount, with the integration of AI, high-resolution displays, and improved touch technology making these devices more engaging and functional. Growing Demand for Digital Learning in K-12 and Higher Education institutions, accelerated by the need for hybrid and remote learning solutions, is a significant catalyst. Government Initiatives worldwide promoting digital transformation in education, often through grants and subsidies, further fuel adoption. Economically, the increasing affordability of these devices and the clear return on investment in terms of improved student outcomes are also major drivers. For example, many countries have launched "Smart Classroom" initiatives, heavily investing billions in equipping schools with interactive displays.
Obstacles in the Interactive Blackboards Market
Despite the positive growth trajectory, the interactive blackboards market faces certain obstacles. High Initial Investment Costs can be a barrier for some institutions, particularly in underfunded regions. Technical Complexity and Training Needs require substantial investment in professional development for educators to effectively utilize the full capabilities of these devices. Rapid Technological Obsolescence necessitates frequent upgrades, adding to long-term costs. Supply Chain Disruptions, as seen in recent global events, can impact availability and pricing. Furthermore, Cybersecurity Concerns regarding student data protection and network vulnerabilities require robust security measures, adding another layer of complexity and potential cost. For instance, a significant disruption in semiconductor supply chains could lead to delays and price increases, impacting an estimated 10% of projected market growth.
Future Opportunities in Interactive Blackboards
The interactive blackboards market is ripe with future opportunities. The expansion into corporate training and professional development presents a significant untapped market, estimated to be worth billions. The increasing demand for personalized and adaptive learning solutions will drive further AI integration and software development. Emerging markets in developing economies, with their growing student populations and increasing focus on education, offer substantial growth potential. Augmented Reality (AR) and Virtual Reality (VR) integration within interactive blackboards is another promising avenue, offering even more immersive and engaging learning experiences. The development of more sustainable and energy-efficient models will also appeal to environmentally conscious institutions. For example, the corporate training segment alone is projected to contribute an additional 5 billion dollars in market value annually.
Major Players in the Interactive Blackboards Ecosystem
- Hitevision
- Seewo (CVTE)
- Jiangsu Daguan
- Jiangsu Oudi
- Createview
- Lighton
- Horion
- Hikvision
- Hanvon
- Odin Technology
- Thinkpanel
- STboard
- Guangzhou Yichuang Electronic Technology Co
- Guangdong Asano Technology Co
Key Developments in Interactive Blackboards Industry
- 2023/09: Seewo (CVTE) launched its latest generation of AI-powered interactive whiteboards, featuring enhanced collaboration tools and content management capabilities, impacting market competition by over 5%.
- 2023/11: Hitevision announced a strategic partnership with a major educational content provider, aiming to integrate a vast library of digital resources into its interactive blackboard solutions, potentially increasing user engagement by 10%.
- 2024/01: Hikvision expanded its offerings with a new range of interactive displays specifically designed for higher education, targeting large lecture halls and university-wide deployments.
- 2024/03: Guangdong Asano Technology Co. introduced a more affordable line of interactive blackboards, making advanced educational technology accessible to a wider segment of the K-12 market, projected to capture an additional 3% market share.
- 2024/05: Lighton unveiled a new interactive whiteboard with built-in cybersecurity features to protect sensitive educational data, addressing a growing concern among educational institutions and impacting customer trust.
Strategic Interactive Blackboards Market Forecast
The interactive blackboards market is projected for substantial growth, driven by ongoing technological innovations, particularly in AI and display technology, and a persistent global push for digital education. The K-12 and Higher Education segments will continue to be the primary consumers, with the 85-inch size remaining a popular choice for its versatility. Emerging markets in developing regions, coupled with the expanding corporate training sector, represent significant untapped potential, collectively estimated to add billions in future market value. Strategic investments in R&D, coupled with supportive government policies and the increasing demand for engaging, personalized learning experiences, will pave the way for a robust market expansion, solidifying the indispensable role of interactive blackboards in modern learning and professional development environments.
Interactive Blackboards Segmentation
-
1. Application
- 1.1. K-12 Education
- 1.2. Higher Education
-
2. Type
- 2.1. < 55 Inch
- 2.2. 56-65 Inch
- 2.3. 66-75 Inch
- 2.4. 76-85 Inch
- 2.5. > 85 Inch
Interactive Blackboards Segmentation By Geography
-
1. North America
- 1.1. United States
- 1.2. Canada
- 1.3. Mexico
-
2. South America
- 2.1. Brazil
- 2.2. Argentina
- 2.3. Rest of South America
-
3. Europe
- 3.1. United Kingdom
- 3.2. Germany
- 3.3. France
- 3.4. Italy
- 3.5. Spain
- 3.6. Russia
- 3.7. Benelux
- 3.8. Nordics
- 3.9. Rest of Europe
-
4. Middle East & Africa
- 4.1. Turkey
- 4.2. Israel
- 4.3. GCC
- 4.4. North Africa
- 4.5. South Africa
- 4.6. Rest of Middle East & Africa
-
5. Asia Pacific
- 5.1. China
- 5.2. India
- 5.3. Japan
- 5.4. South Korea
- 5.5. ASEAN
- 5.6. Oceania
- 5.7. Rest of Asia Pacific
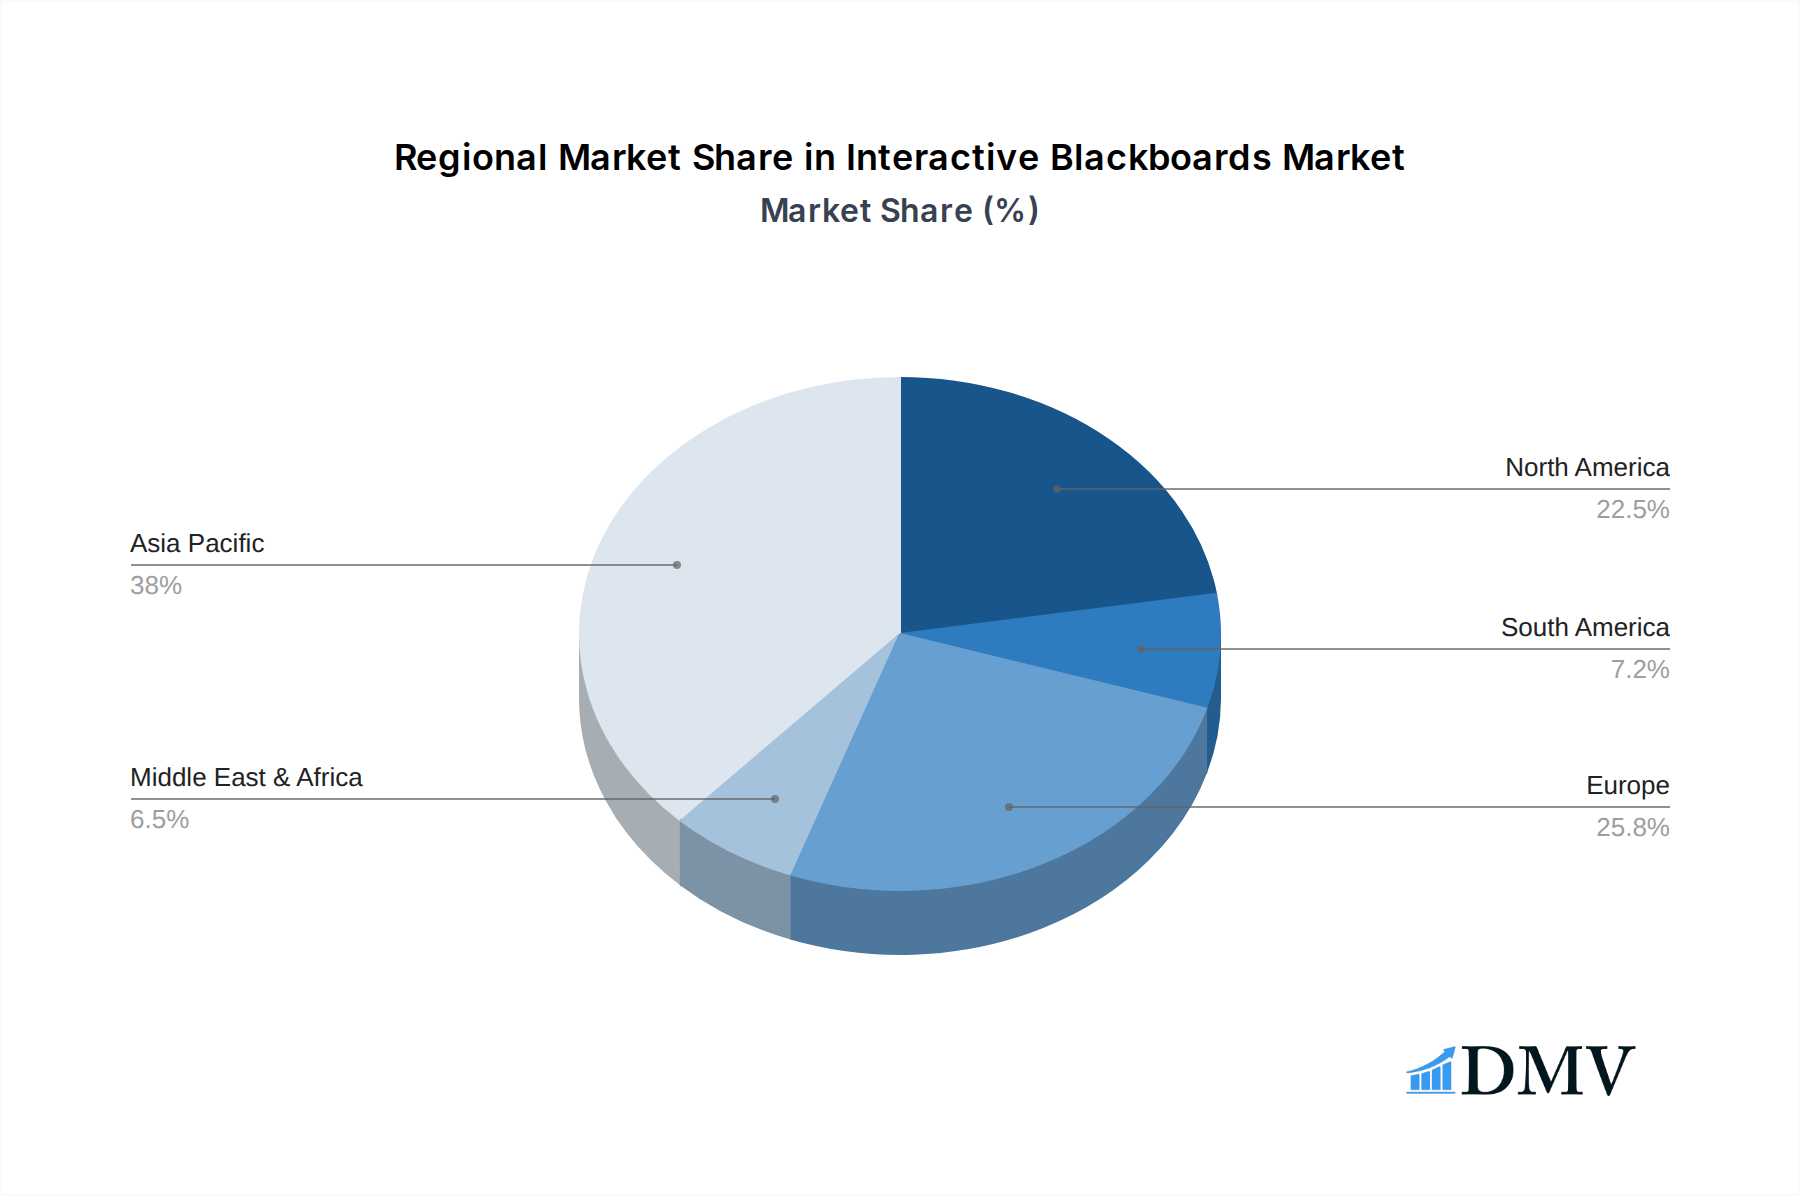
Interactive Blackboards Regional Market Share
Geographic Coverage of Interactive Blackboards
Interactive Blackboards REPORT HIGHLIGHTS
| Aspects | Details |
|---|---|
| Study Period | 2020-2034 |
| Base Year | 2025 |
| Estimated Year | 2026 |
| Forecast Period | 2026-2034 |
| Historical Period | 2020-2025 |
| Growth Rate | CAGR of 9.7% from 2020-2034 |
| Segmentation |
|
Table of Contents
- 1. Introduction
- 1.1. Research Scope
- 1.2. Market Segmentation
- 1.3. Research Objective
- 1.4. Definitions and Assumptions
- 2. Executive Summary
- 2.1. Market Snapshot
- 3. Market Dynamics
- 3.1. Market Drivers
- 3.2. Market Restrains
- 3.3. Market Trends
- 3.4. Market Opportunities
- 4. Market Factor Analysis
- 4.1. Porters Five Forces
- 4.1.1. Bargaining Power of Suppliers
- 4.1.2. Bargaining Power of Buyers
- 4.1.3. Threat of New Entrants
- 4.1.4. Threat of Substitutes
- 4.1.5. Competitive Rivalry
- 4.2. PESTEL analysis
- 4.3. BCG Analysis
- 4.3.1. Stars (High Growth, High Market Share)
- 4.3.2. Cash Cows (Low Growth, High Market Share)
- 4.3.3. Question Mark (High Growth, Low Market Share)
- 4.3.4. Dogs (Low Growth, Low Market Share)
- 4.4. Ansoff Matrix Analysis
- 4.5. Supply Chain Analysis
- 4.6. Regulatory Landscape
- 4.7. Current Market Potential and Opportunity Assessment (TAM–SAM–SOM Framework)
- 4.8. DMV Analyst Note
- 4.1. Porters Five Forces
- 5. Market Analysis, Insights and Forecast 2021-2033
- 5.1. Market Analysis, Insights and Forecast - by Application
- 5.1.1. K-12 Education
- 5.1.2. Higher Education
- 5.2. Market Analysis, Insights and Forecast - by Type
- 5.2.1. < 55 Inch
- 5.2.2. 56-65 Inch
- 5.2.3. 66-75 Inch
- 5.2.4. 76-85 Inch
- 5.2.5. > 85 Inch
- 5.3. Market Analysis, Insights and Forecast - by Region
- 5.3.1. North America
- 5.3.2. South America
- 5.3.3. Europe
- 5.3.4. Middle East & Africa
- 5.3.5. Asia Pacific
- 5.1. Market Analysis, Insights and Forecast - by Application
- 6. Global Interactive Blackboards Analysis, Insights and Forecast, 2021-2033
- 6.1. Market Analysis, Insights and Forecast - by Application
- 6.1.1. K-12 Education
- 6.1.2. Higher Education
- 6.2. Market Analysis, Insights and Forecast - by Type
- 6.2.1. < 55 Inch
- 6.2.2. 56-65 Inch
- 6.2.3. 66-75 Inch
- 6.2.4. 76-85 Inch
- 6.2.5. > 85 Inch
- 6.1. Market Analysis, Insights and Forecast - by Application
- 7. North America Interactive Blackboards Analysis, Insights and Forecast, 2020-2032
- 7.1. Market Analysis, Insights and Forecast - by Application
- 7.1.1. K-12 Education
- 7.1.2. Higher Education
- 7.2. Market Analysis, Insights and Forecast - by Type
- 7.2.1. < 55 Inch
- 7.2.2. 56-65 Inch
- 7.2.3. 66-75 Inch
- 7.2.4. 76-85 Inch
- 7.2.5. > 85 Inch
- 7.1. Market Analysis, Insights and Forecast - by Application
- 8. South America Interactive Blackboards Analysis, Insights and Forecast, 2020-2032
- 8.1. Market Analysis, Insights and Forecast - by Application
- 8.1.1. K-12 Education
- 8.1.2. Higher Education
- 8.2. Market Analysis, Insights and Forecast - by Type
- 8.2.1. < 55 Inch
- 8.2.2. 56-65 Inch
- 8.2.3. 66-75 Inch
- 8.2.4. 76-85 Inch
- 8.2.5. > 85 Inch
- 8.1. Market Analysis, Insights and Forecast - by Application
- 9. Europe Interactive Blackboards Analysis, Insights and Forecast, 2020-2032
- 9.1. Market Analysis, Insights and Forecast - by Application
- 9.1.1. K-12 Education
- 9.1.2. Higher Education
- 9.2. Market Analysis, Insights and Forecast - by Type
- 9.2.1. < 55 Inch
- 9.2.2. 56-65 Inch
- 9.2.3. 66-75 Inch
- 9.2.4. 76-85 Inch
- 9.2.5. > 85 Inch
- 9.1. Market Analysis, Insights and Forecast - by Application
- 10. Middle East & Africa Interactive Blackboards Analysis, Insights and Forecast, 2020-2032
- 10.1. Market Analysis, Insights and Forecast - by Application
- 10.1.1. K-12 Education
- 10.1.2. Higher Education
- 10.2. Market Analysis, Insights and Forecast - by Type
- 10.2.1. < 55 Inch
- 10.2.2. 56-65 Inch
- 10.2.3. 66-75 Inch
- 10.2.4. 76-85 Inch
- 10.2.5. > 85 Inch
- 10.1. Market Analysis, Insights and Forecast - by Application
- 11. Asia Pacific Interactive Blackboards Analysis, Insights and Forecast, 2020-2032
- 11.1. Market Analysis, Insights and Forecast - by Application
- 11.1.1. K-12 Education
- 11.1.2. Higher Education
- 11.2. Market Analysis, Insights and Forecast - by Type
- 11.2.1. < 55 Inch
- 11.2.2. 56-65 Inch
- 11.2.3. 66-75 Inch
- 11.2.4. 76-85 Inch
- 11.2.5. > 85 Inch
- 11.1. Market Analysis, Insights and Forecast - by Application
- 12. Competitive Analysis
- 12.1. Company Profiles
- 12.1.1 Hitevision
- 12.1.1.1. Company Overview
- 12.1.1.2. Products
- 12.1.1.3. Company Financials
- 12.1.1.4. SWOT Analysis
- 12.1.2 Seewo(CVTE)
- 12.1.2.1. Company Overview
- 12.1.2.2. Products
- 12.1.2.3. Company Financials
- 12.1.2.4. SWOT Analysis
- 12.1.3 Jiangsu Daguan
- 12.1.3.1. Company Overview
- 12.1.3.2. Products
- 12.1.3.3. Company Financials
- 12.1.3.4. SWOT Analysis
- 12.1.4 Jiangsu Oudi
- 12.1.4.1. Company Overview
- 12.1.4.2. Products
- 12.1.4.3. Company Financials
- 12.1.4.4. SWOT Analysis
- 12.1.5 Createview
- 12.1.5.1. Company Overview
- 12.1.5.2. Products
- 12.1.5.3. Company Financials
- 12.1.5.4. SWOT Analysis
- 12.1.6 Lighton
- 12.1.6.1. Company Overview
- 12.1.6.2. Products
- 12.1.6.3. Company Financials
- 12.1.6.4. SWOT Analysis
- 12.1.7 Horion
- 12.1.7.1. Company Overview
- 12.1.7.2. Products
- 12.1.7.3. Company Financials
- 12.1.7.4. SWOT Analysis
- 12.1.8 Hikvision
- 12.1.8.1. Company Overview
- 12.1.8.2. Products
- 12.1.8.3. Company Financials
- 12.1.8.4. SWOT Analysis
- 12.1.9 Hanvon
- 12.1.9.1. Company Overview
- 12.1.9.2. Products
- 12.1.9.3. Company Financials
- 12.1.9.4. SWOT Analysis
- 12.1.10 Odin Technology
- 12.1.10.1. Company Overview
- 12.1.10.2. Products
- 12.1.10.3. Company Financials
- 12.1.10.4. SWOT Analysis
- 12.1.11 Thinkpanel
- 12.1.11.1. Company Overview
- 12.1.11.2. Products
- 12.1.11.3. Company Financials
- 12.1.11.4. SWOT Analysis
- 12.1.12 STboard
- 12.1.12.1. Company Overview
- 12.1.12.2. Products
- 12.1.12.3. Company Financials
- 12.1.12.4. SWOT Analysis
- 12.1.13 Guangzhou Yichuang Electronic Technology Co
- 12.1.13.1. Company Overview
- 12.1.13.2. Products
- 12.1.13.3. Company Financials
- 12.1.13.4. SWOT Analysis
- 12.1.14 Guangdong Asano Technology Co
- 12.1.14.1. Company Overview
- 12.1.14.2. Products
- 12.1.14.3. Company Financials
- 12.1.14.4. SWOT Analysis
- 12.1.1 Hitevision
- 12.2. Market Entropy
- 12.2.1 Company's Key Areas Served
- 12.2.2 Recent Developments
- 12.3. Company Market Share Analysis 2025
- 12.3.1 Top 5 Companies Market Share Analysis
- 12.3.2 Top 3 Companies Market Share Analysis
- 12.4. List of Potential Customers
- 13. Research Methodology
List of Figures
- Figure 1: Global Interactive Blackboards Revenue Breakdown (billion, %) by Region 2025 & 2033
- Figure 2: North America Interactive Blackboards Revenue (billion), by Application 2025 & 2033
- Figure 3: North America Interactive Blackboards Revenue Share (%), by Application 2025 & 2033
- Figure 4: North America Interactive Blackboards Revenue (billion), by Type 2025 & 2033
- Figure 5: North America Interactive Blackboards Revenue Share (%), by Type 2025 & 2033
- Figure 6: North America Interactive Blackboards Revenue (billion), by Country 2025 & 2033
- Figure 7: North America Interactive Blackboards Revenue Share (%), by Country 2025 & 2033
- Figure 8: South America Interactive Blackboards Revenue (billion), by Application 2025 & 2033
- Figure 9: South America Interactive Blackboards Revenue Share (%), by Application 2025 & 2033
- Figure 10: South America Interactive Blackboards Revenue (billion), by Type 2025 & 2033
- Figure 11: South America Interactive Blackboards Revenue Share (%), by Type 2025 & 2033
- Figure 12: South America Interactive Blackboards Revenue (billion), by Country 2025 & 2033
- Figure 13: South America Interactive Blackboards Revenue Share (%), by Country 2025 & 2033
- Figure 14: Europe Interactive Blackboards Revenue (billion), by Application 2025 & 2033
- Figure 15: Europe Interactive Blackboards Revenue Share (%), by Application 2025 & 2033
- Figure 16: Europe Interactive Blackboards Revenue (billion), by Type 2025 & 2033
- Figure 17: Europe Interactive Blackboards Revenue Share (%), by Type 2025 & 2033
- Figure 18: Europe Interactive Blackboards Revenue (billion), by Country 2025 & 2033
- Figure 19: Europe Interactive Blackboards Revenue Share (%), by Country 2025 & 2033
- Figure 20: Middle East & Africa Interactive Blackboards Revenue (billion), by Application 2025 & 2033
- Figure 21: Middle East & Africa Interactive Blackboards Revenue Share (%), by Application 2025 & 2033
- Figure 22: Middle East & Africa Interactive Blackboards Revenue (billion), by Type 2025 & 2033
- Figure 23: Middle East & Africa Interactive Blackboards Revenue Share (%), by Type 2025 & 2033
- Figure 24: Middle East & Africa Interactive Blackboards Revenue (billion), by Country 2025 & 2033
- Figure 25: Middle East & Africa Interactive Blackboards Revenue Share (%), by Country 2025 & 2033
- Figure 26: Asia Pacific Interactive Blackboards Revenue (billion), by Application 2025 & 2033
- Figure 27: Asia Pacific Interactive Blackboards Revenue Share (%), by Application 2025 & 2033
- Figure 28: Asia Pacific Interactive Blackboards Revenue (billion), by Type 2025 & 2033
- Figure 29: Asia Pacific Interactive Blackboards Revenue Share (%), by Type 2025 & 2033
- Figure 30: Asia Pacific Interactive Blackboards Revenue (billion), by Country 2025 & 2033
- Figure 31: Asia Pacific Interactive Blackboards Revenue Share (%), by Country 2025 & 2033
List of Tables
- Table 1: Global Interactive Blackboards Revenue billion Forecast, by Application 2020 & 2033
- Table 2: Global Interactive Blackboards Revenue billion Forecast, by Type 2020 & 2033
- Table 3: Global Interactive Blackboards Revenue billion Forecast, by Region 2020 & 2033
- Table 4: Global Interactive Blackboards Revenue billion Forecast, by Application 2020 & 2033
- Table 5: Global Interactive Blackboards Revenue billion Forecast, by Type 2020 & 2033
- Table 6: Global Interactive Blackboards Revenue billion Forecast, by Country 2020 & 2033
- Table 7: United States Interactive Blackboards Revenue (billion) Forecast, by Application 2020 & 2033
- Table 8: Canada Interactive Blackboards Revenue (billion) Forecast, by Application 2020 & 2033
- Table 9: Mexico Interactive Blackboards Revenue (billion) Forecast, by Application 2020 & 2033
- Table 10: Global Interactive Blackboards Revenue billion Forecast, by Application 2020 & 2033
- Table 11: Global Interactive Blackboards Revenue billion Forecast, by Type 2020 & 2033
- Table 12: Global Interactive Blackboards Revenue billion Forecast, by Country 2020 & 2033
- Table 13: Brazil Interactive Blackboards Revenue (billion) Forecast, by Application 2020 & 2033
- Table 14: Argentina Interactive Blackboards Revenue (billion) Forecast, by Application 2020 & 2033
- Table 15: Rest of South America Interactive Blackboards Revenue (billion) Forecast, by Application 2020 & 2033
- Table 16: Global Interactive Blackboards Revenue billion Forecast, by Application 2020 & 2033
- Table 17: Global Interactive Blackboards Revenue billion Forecast, by Type 2020 & 2033
- Table 18: Global Interactive Blackboards Revenue billion Forecast, by Country 2020 & 2033
- Table 19: United Kingdom Interactive Blackboards Revenue (billion) Forecast, by Application 2020 & 2033
- Table 20: Germany Interactive Blackboards Revenue (billion) Forecast, by Application 2020 & 2033
- Table 21: France Interactive Blackboards Revenue (billion) Forecast, by Application 2020 & 2033
- Table 22: Italy Interactive Blackboards Revenue (billion) Forecast, by Application 2020 & 2033
- Table 23: Spain Interactive Blackboards Revenue (billion) Forecast, by Application 2020 & 2033
- Table 24: Russia Interactive Blackboards Revenue (billion) Forecast, by Application 2020 & 2033
- Table 25: Benelux Interactive Blackboards Revenue (billion) Forecast, by Application 2020 & 2033
- Table 26: Nordics Interactive Blackboards Revenue (billion) Forecast, by Application 2020 & 2033
- Table 27: Rest of Europe Interactive Blackboards Revenue (billion) Forecast, by Application 2020 & 2033
- Table 28: Global Interactive Blackboards Revenue billion Forecast, by Application 2020 & 2033
- Table 29: Global Interactive Blackboards Revenue billion Forecast, by Type 2020 & 2033
- Table 30: Global Interactive Blackboards Revenue billion Forecast, by Country 2020 & 2033
- Table 31: Turkey Interactive Blackboards Revenue (billion) Forecast, by Application 2020 & 2033
- Table 32: Israel Interactive Blackboards Revenue (billion) Forecast, by Application 2020 & 2033
- Table 33: GCC Interactive Blackboards Revenue (billion) Forecast, by Application 2020 & 2033
- Table 34: North Africa Interactive Blackboards Revenue (billion) Forecast, by Application 2020 & 2033
- Table 35: South Africa Interactive Blackboards Revenue (billion) Forecast, by Application 2020 & 2033
- Table 36: Rest of Middle East & Africa Interactive Blackboards Revenue (billion) Forecast, by Application 2020 & 2033
- Table 37: Global Interactive Blackboards Revenue billion Forecast, by Application 2020 & 2033
- Table 38: Global Interactive Blackboards Revenue billion Forecast, by Type 2020 & 2033
- Table 39: Global Interactive Blackboards Revenue billion Forecast, by Country 2020 & 2033
- Table 40: China Interactive Blackboards Revenue (billion) Forecast, by Application 2020 & 2033
- Table 41: India Interactive Blackboards Revenue (billion) Forecast, by Application 2020 & 2033
- Table 42: Japan Interactive Blackboards Revenue (billion) Forecast, by Application 2020 & 2033
- Table 43: South Korea Interactive Blackboards Revenue (billion) Forecast, by Application 2020 & 2033
- Table 44: ASEAN Interactive Blackboards Revenue (billion) Forecast, by Application 2020 & 2033
- Table 45: Oceania Interactive Blackboards Revenue (billion) Forecast, by Application 2020 & 2033
- Table 46: Rest of Asia Pacific Interactive Blackboards Revenue (billion) Forecast, by Application 2020 & 2033
Frequently Asked Questions
1. What is the projected Compound Annual Growth Rate (CAGR) of the Interactive Blackboards?
The projected CAGR is approximately 9.7%.
2. Which companies are prominent players in the Interactive Blackboards?
Key companies in the market include Hitevision, Seewo(CVTE), Jiangsu Daguan, Jiangsu Oudi, Createview, Lighton, Horion, Hikvision, Hanvon, Odin Technology, Thinkpanel, STboard, Guangzhou Yichuang Electronic Technology Co, Guangdong Asano Technology Co.
3. What are the main segments of the Interactive Blackboards?
The market segments include Application, Type.
4. Can you provide details about the market size?
The market size is estimated to be USD 5.6 billion as of 2022.
5. What are some drivers contributing to market growth?
N/A
6. What are the notable trends driving market growth?
N/A
7. Are there any restraints impacting market growth?
N/A
8. Can you provide examples of recent developments in the market?
N/A
9. What pricing options are available for accessing the report?
Pricing options include single-user, multi-user, and enterprise licenses priced at USD 2900.00, USD 4350.00, and USD 5800.00 respectively.
10. Is the market size provided in terms of value or volume?
The market size is provided in terms of value, measured in billion.
11. Are there any specific market keywords associated with the report?
Yes, the market keyword associated with the report is "Interactive Blackboards," which aids in identifying and referencing the specific market segment covered.
12. How do I determine which pricing option suits my needs best?
The pricing options vary based on user requirements and access needs. Individual users may opt for single-user licenses, while businesses requiring broader access may choose multi-user or enterprise licenses for cost-effective access to the report.
13. Are there any additional resources or data provided in the Interactive Blackboards report?
While the report offers comprehensive insights, it's advisable to review the specific contents or supplementary materials provided to ascertain if additional resources or data are available.
14. How can I stay updated on further developments or reports in the Interactive Blackboards?
To stay informed about further developments, trends, and reports in the Interactive Blackboards, consider subscribing to industry newsletters, following relevant companies and organizations, or regularly checking reputable industry news sources and publications.
Methodology
Step 1 - Identification of Relevant Samples Size from Population Database


Step 2 - Approaches for Defining Global Market Size (Value, Volume* & Price*)

Note*: In applicable scenarios
Step 3 - Data Sources
Primary Research
- Web Analytics
- Survey Reports
- Research Institute
- Latest Research Reports
- Opinion Leaders
Secondary Research
- Annual Reports
- White Paper
- Latest Press Release
- Industry Association
- Paid Database
- Investor Presentations

Step 4 - Data Triangulation
Involves using different sources of information in order to increase the validity of a study
These sources are likely to be stakeholders in a program - participants, other researchers, program staff, other community members, and so on.
Then we put all data in single framework & apply various statistical tools to find out the dynamic on the market.
During the analysis stage, feedback from the stakeholder groups would be compared to determine areas of agreement as well as areas of divergence